ISSN ONLINE(2319-8753)PRINT(2347-6710)
ISSN ONLINE(2319-8753)PRINT(2347-6710)
B. Ramesh1,*, A. Elayaperumal2, R. Venkatesh1, S. Madhav3 , Kamal Jain3
|
| Related article at Pubmed, Scholar Google |
Visit for more related articles at International Journal of Innovative Research in Science, Engineering and Technology
With the more demands of modern engineering products with utmost precision and productivity, the control of surface roughness (Ra) together with Material Removal Rate (MRR) have become more significant. This paper optimizes the process parameters (spindle speed, feed and depth of cut) for beryllium copper alloy (C17200) in conventional vertical milling operation using a 6 mm carbide end mill. The experiments were conducted by using Response Surface Methodology (RSM) face centered central composite design. The experimental values obtained for quality characteristics (Ra and MRR) are empirically related to process parameters by developing a response surface model using Design-Expert version 7 software. The results show that the optimal parameter levels within the selected range for machining a straight groove with both lower Ra and higher MRR in the plate of beryllium copper alloy using CNC Vertical Machining Centre (VMC) are 4416 rpm spindle speed, 0.49 mm/rev feed and 2 mm depth of cut.
Keywords |
| Beryllium, RSM, MRR, surface roughness, end milling |
INTRODUCTION |
| Cube2-C17200 (CDA 172) Beryllium Copper is the most commonly utilized Copper Beryllium alloy and is notable for its highest strength and hardness compared to commercial copper alloys. C17200 alloy contains approximately 2% of beryllium and its ultimate tensile strength can exceed 1379 MPa, while the hardness approaches Rockwell C45. Meanwhile, the electrical conductivity is a minimum of 22% IACS in the fully aged condition. C17200 also exhibits exceptional resistance to stress relaxation at elevated temperatures. Typical application for C17200 beryllium copper alloys includes electrical switch and relay blades, fuse clips, spring connectors, navigational instruments, washers, fasteners, retaining rings, roll pins, screws, bolts, pumps, springs, shafts, non sparking safety tools, flexible metal hose, housings for instruments, bearings, bushings, valve seats, valve stems, diaphragms, springs, welding equipment, rolling mill parts, spline shafts, pump parts, valves, bourdon tubes, wear plates on heavy equipment, bellows etc.[1]. |
| Technology nowadays demands precision for sophisticated modern engineering products with enhanced control over surface roughness (Ra) together with dimensional accuracy and Material Removal Rate (MRR). It has been investigated that surface texture greatly influences the functioning of the machined parts. The improved qualities of product and the economics of the manufacturing operation are very important consideration to produce product having the functional, visual and cost appeal. |
| Many attempts have been made by various researchers in machining beryllium copper alloys. They are briefly presented here. Aggarwal et al. [2] have worked on the interaction graphs for a two-level combined array experimental design. Their conclusion is that quality can be obtained by robust design. Benardos & Vosniakos [3] have presented the prediction of surface roughness in CNC face milling using neural network and Taguchi's design of experiments. They predicted that surface roughness is influenced by feed, speed and depth of cut. Bouzakis et al. [4] have determined the chip geometry, cutting force and roughness in milling with ball end tools. Dae et al. [5] has studied the issue of optimization in a face milling operation. Henri et al. [6] studied surface shape prediction in high speed milling. Surface roughness performance was studied by Yang and Chen [7]. Their study is how to identify and decide optimum parameters in end- milling operations. |
| Kishawy & Elbestawi [8] have presented case studies on the effects of process parameters on material side flow during hard turning. They concluded that through the proper design of a system, the process could be made insensitive to variations, thus avoiding the costly eventualities of rejection and / or rework. The similar views have been expressed by Savage & Chen [9] in their research work entitled multiple regression-based multilevel surface roughness recognition system in milling operation. Wang & Chang [10] have done experimental study of surface roughness in slot end milling. They advocate that the optimization of process parameter can greatly enhance surface roughness. According to Unal and Dean [11] quality and cost are the main ingredients in Taguchi's approach to design optimization. A methodology of decision system was given by Vidal et al. [12] for optimizing the selection of parameters when planning milling operations. |
| Warner & O’connor [13] have found through application of Taguchi's design of experiment that the product quality and productivity have been improved as optimization of the process played a crucial role in molding process. Alberti et al. [14] investigated the system for optimizing the surface roughness and material removal rate in high speed CNC milling operations. Once the parameters viz. cutting speed, feed and depth of cut has been given the surface roughness and material removal rate can be predicted. Saffar et al. [15] aimed at optimizing the machining parameters with the help of genetic approach keeping the surface roughness and tool life as the constraints. The obtained results indicate that the optimized parameters are capable of machining the workpiece more accurately with better surface finish. Sanjit Moshat et al. [16] highlighted optimization of CNC end milling process parameters to provide good surface finish as well as high material removal rate (MRR). An attempt has been made to optimize aforesaid quality attributes in a manner that these multi-criterions could be fulfilled simultaneously up to the expected level. Deepak [17] has discussed the Particle Swarm Optimization (PSO) and Genetic Algorithm (GA) for optimization of milling process parameters. |
| The above literature review shows that many researchers have worked towards attaining optimal parameters and levels in milling operation considering surface roughness (Ra) and Material Removal Rate (MRR). However, literature on the conventional milling of beryllium copper alloy using end mill is scarce. Hence the research interest in the present study is to investigate the relative influence of milling process parameters such as spindle speed, feed and depth of cut on Ra and MRR during straight grooving operation in beryllium copper alloy and to attain optimal process parameter levels in the selected range for groove quality and productivity considering minimum Ra and higher MRR together using Response Surface Methodology (RSM). This research will establish a reliable cutting theory and thereby aids a manufacturing engineer with a database of parameters and their optimal levels while upmilling beryllium copper alloys using end mill. This paper also presents the application of RSM to attain response surface model for Ra and MRR with process parameters by analyzing Signal/Noise (S/N) ratio. |
II. EXPERIMENTAL DETAILS |
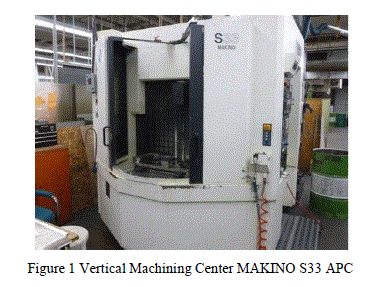
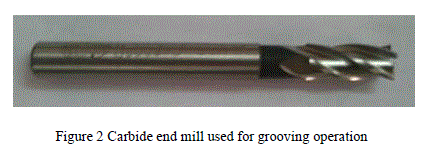
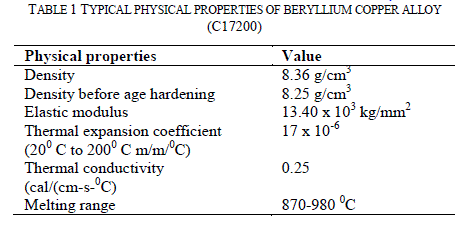
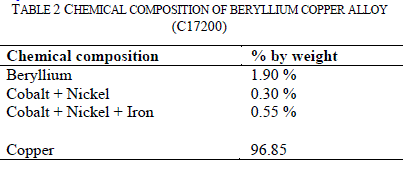
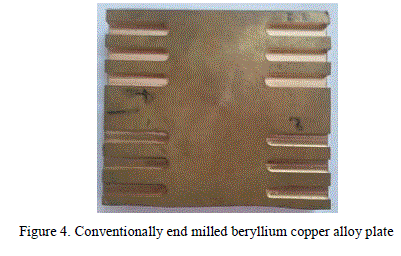
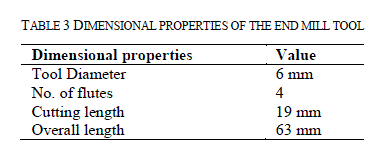
| CNC vertical machining center (MAKINO S33 APC) was used to perform the conventional milling operations (Fig.1). A beryllium copper alloy plate (C17200) of dimensions 106 x 92 x 19 mm was used as a work piece. The typical physical properties and chemical composition of the work piece is given in Tables 1 and 2 respectively. The tool used for the straight grooving operation is a 6 mm carbide end mill (Fig. 2). The dimensional properties of end mill tool are given in Table 3. |
 |
 |
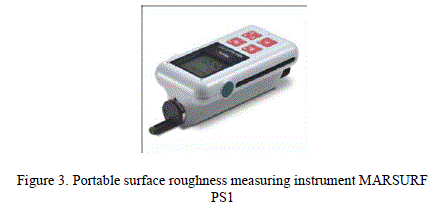
| Average surface roughness (Ra) measurement has been done using a portable surface roughness measuring instrument MARSURF PS1 as shown in Figure 3. It is equipped with a diamond stylus having a tip radius of 5 μm. The weight of the work piece has been measured in a high precision digital balance meter which can measure up to an accuracy of 10-4 g and thus eliminates the possibility of large error while calculating MRR. |
A. Plan of Experiments |
| The Response Surface Methodology (RSM) is an empirical modeling approach for predicting the relationship between process parameters and responses. The RSM is a collection of mathematical and statistical procedures, used for the analysis of problems in which the desired response is affected by several parameters and for optimizing the process parameter levels considering multiple responses together [18]. The experiments were designed by applying RSM with selected cutting conditions. The process parameters and their levels selected for the experiments are presented in Table 4. In applying RSM, central composite face centered (CCF) design was used which fits the second order response surfaces very accurately. All the coefficients were obtained by applying CCF design using the Design-Expert version 7 statistical software package. After determining the significant coefficients (at 95% confidence level), the final models were developed using only these coefficients for the quality characteristics (Ra and MRR) of conventional end milling in Cube2. |
 |
 |
 |
| length of 4 mm. The roughness instrument has been made to measure along the groove (30 x 6 mm) i.e. across the lays, three times at various places and an average was taken for analysis. |
| MRR has been calculated from the difference in weight of work piece before and after each trial of experiment. |
| MRR in mm3/min = (Wi - Wf)/ (ρt) (1) |
| Where, Wi is initial weight of work piece in kg, Wf is final weight of work piece in kg, ρ is density of beryllium copper alloy in kg/mm3, t is machining time in minutes. Each experiment has been repeated three times and the average values of MRR and Ra has been presented in Table 5. |
 |
| From Fig 5 (a) it is observed that Ra increases as speed and feed increases. Lower Ra is achieved at medium speed, lower feed and medium depth of cut. From Fig 5 (b) it is observed that MRR increases as speed and feed increases. Higher MRR is achieved at higher speed and feed and lower depth of cut. |
B. Adequacy analysis of model using ANOVA |
| The adequacy of the second order response surface models (2) and (3) was tested using the Analysis of Variance (ANOVA) technique and the result of the regression model (2) fitting in the form of ANOVA is given in Table 6. The ANOVA table consists of sum of squares and degrees of freedom. The sum of squares is usually performed into contributions from regression model and residual error. Mean square is the ratio of sum of squares to the degrees of freedom and F-ratio is the ratio of mean square of regression model to the mean square of residual error. As per this technique, the calculated value of F-ratio of the developed model should be more than tabulated value of F-table for 95% confidence level, for the model to be adequate. |
| The Model F-value of 47.53 for surface roughness implies the model is significant. There is only a 0.01% chance for surface roughness that a "Model F-Value" this large could occur due to noise. Values of "Prob > F" less than 0.05 indicate model terms are significant. For surface roughness S, F and S2 are significant model terms. Values greater than 0.1 indicate the model terms are not significant. If there are many insignificant model terms (not counting those required to support hierarchy), model reduction may improve the resulting model. It is observed that feed is more significant followed by speed in influencing the quality charcteristic. Lack of fit is not significant as it is desired. A relatively lower value of the coefficient of variation indicates improved precision and reliability of the conducted experiments. |
 |
 |
| The determination coefficient (R2) indicates the goodness of fit of the model i.e. it indicates the agreement between experimental and predicted values. The determination coefficient indicates that only remaining % of the total variations are not explained by the model. The obtained R2 value of 0.8991 for surface roughness indicates a better fit of the model. The "Pred R-Squared" of 0.8181 is in reasonable agreement with the "Adj R-Squared" of 0.8802. "Adeq Precision" measures the signal to noise ratio. A ratio greater than 4 is desirable. The obtained ratio of 22.038 indicates an adequate signal. Similarly the adequacy of the model (3) was tested using ANOVA. Therefore, the models (2) and (3) in terms of actual factors can be used to navigate the design space |
 |
C. Analysis of the effect of process parameters on quality characteristics |
 |
| Figure 6 presents three dimensional response surfaces developed for the quality characteristics, taking the two process parameters in X and Y axis and response obtained from the regression model in Z axis. The response surfaces clearly reveal the optimal response point. As feed increases with speed both surface roughness and material removal rate increases. As speed increases with feed both surface roughness and material removal rate increases. |
D. Optimizing the process parameter levels in conventional milling of beryllium copper alloy |
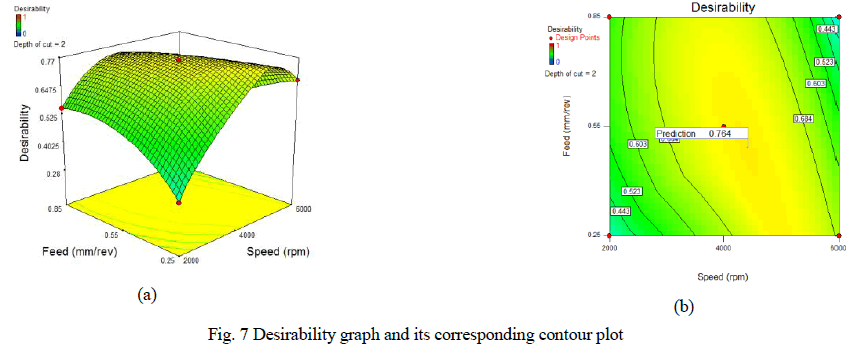
| RSM is used to find the optimal set of process parameter levels that produce a maximum or minimum value of the response [20]. In the present investigation the process parameter levels corresponding to the minimization of the quality characteristics (Ra and MRR) together are considered as optimum. The desirability graph (Fig. 7) shows that the process parameter level combination (4416 rpm spindle speed, 0.49 mm/rev feed and 2 mm depth of cut) having the highest desirability of 0.764 is optimum. The average range of surface roughness in milling is 0.8 – 6.3 μm [21]. |
| Therefore the optimal parameter levels in conventional milling of beryllium copper alloy using 6 mm carbide end mill can be concluded as 4416 rpm spindle speed, 0.49 mm/rev feed and 2 mm depth of cut by which 507.3378 mm3/min MRR and 0.7950 μm Ra is obtained. |
| From the above discussions, it can be concluded that RSM approach is very useful in analyzing the parametric influence on any response of interest and to optimize the parametric levels in the selected range considering multiple responses together. Further, the model development requires only limited number of experiments. However, the main limitation of modeling in RSM is that the range of the process parameters selected should be narrow for better prediction accuracy. Hence, the interpolation may not be so accurate with wide range of process parameters. |
 |
IV. CONCLUSION |
| This paper has described the use of Response Surface Methodology (RSM) to investigate the relative influence of milling process parameters (spindle speed, feed and depth of cut) on quality characteristics (surface roughness and material removal rate), adequacy analysis of response surface models and to attain optimal process parameter levels in the selected range which leads to attain high machining quality and productivity in conventional milling of beryllium copper alloy plate using 6 mm carbide end mill. Based on the experimental results and methodology used, the following conclusions can be drawn for straight grooving operation. |
| 1. Surface roughness and material removal rate increases as speed and feed increases. Lower Ra is achieved at medium speed, lower feed and medium depth of cut. Higher MRR is achieved at higher speed and feed and lower depth of cut. |
| 2. Feed is more significant followed by speed in influencing Ra and speed is more significant followed by feed in influencing MRR. |
| 3. The response surface models developed for MRR and Ra with milling process parameters deems to be fit. |
| 4. The optimal parameter levels in conventional milling of beryllium copper alloy using 6 mm carbide end mill can be concluded as 4416 rpm spindle speed, 0.49 mm/rev feed and 2 mm depth of cut by which 507.3378 mm3/min MRR and 0.7950 μm Ra is obtained. |
| 5. Lower MRR will lead to higher surface finish. |
ACKNOWLEDGMENT |
| The authors are grateful to M/S Piyush Steel Pvt. Ltd. Mumbai, India for supplying the Beryllium copper alloy for experimentation. |
References |
|