ISSN ONLINE(2319-8753)PRINT(2347-6710)
ISSN ONLINE(2319-8753)PRINT(2347-6710)
A.K. Singh1, Prof. K. Subba Rao2
|
| Related article at Pubmed, Scholar Google |
Visit for more related articles at International Journal of Innovative Research in Science, Engineering and Technology
In today EW scenario the Radar features are getting advanced day by day. To intercept and analyse signals coming from such Radar, ESM receivers also should have modern and advanced features and techniques. There are many ESM Receivers developed/being developed based on Analog and Digital techniques to measure the intercepted Radar signal parameters. Frequency of the signal is one of the important basic parameter measured by ESM Receiver. Better frequency resolution and accuracy are desirable specifications of the receiver. Systems based on Digital Receiver are sampled signal systems. By means of the Fast Fourier Transform (FFT) algorithm, Frequencies of intercepted signals can be estimated from their locations in the discrete spectrum with a resolution depending on the number of points of FFT. But computational or other limitations often restrict the number of points, which correspondingly restricts the resolution of the estimate provided by the FFT. This paper brings out implementation of interpolation algorithm in FPGA for fine Frequency accuracy without increasing the FFT size.
Keywords |
| EW-Electronics Warfare, ESM- Electronic Support Measure, DSP-Digital Signal Processing, FFT-Fast Fourier Transform, FPGA- Field Programmable Gate Array, LSA-Logic State Analyser, MATLAB-Matrix Laboratory, VHDL- VASIC High Descriptive Language |
I. INTRODUCTION |
| Electronic Support Measure (ESM) is very important section in Electronic Warfare field, which is used to search, intercept, locate and identify sources of the enemy Radar signals and extract the parameters of that particular Radar signal. The information provided by the ESM is used for the threat recognition and for the tactical deployment of forces or assets such as Electronic Counter Measures (ECM). There are many ESM receivers developed/being developed based on Analog (Homodyne Receiver, DIFM, Superhet Receiver, Channelized Receiver etc.) and Digital techniques [1]-[3]. Because of the regeneration and re-configurability features of Digital Receiver, it is now a day’s better choice over Analog Receiver. In system point of view, Digital Receiver also offers high processing gains for extraction of the parameters of the signals. The use of digital signal processing (DSP) can often improve stability, and overall performance of the system, while reducing size and cost, compared to the analog approach. |
| Frequency of the Radar signal is one of the important basic parameter measured by ESM Receiver. The performance of the Receiver can be evaluated in terms of frequency resolution and accuracy. Better frequency resolution and accuracy are desirable specifications of the receiver. FFT is used to measure the frequency of the signal. But computational or other limitations often restrict the number of points of FFT, which correspondingly restricts the resolution of the estimate provided by the FFT. Selection of number of points of FFT is a tradeoff between the amount of collected data that is to be processed or computed and the resolution/accuracy of the frequency. To get the fine frequency resolution and accuracy, many ESM Receivers use the higher number of points of FFT but it is hardware intensive and will consume more power. |
| To achieve good frequency accuracy while running the short FFT is the motivation of this work. This paper discusses a simple technique which is implemented in Digital Receiver in real time to improve the frequency accuracy after FFT with minimum number of calculations. The concept behind this work is that in many cases frequency estimation of isolated tones can be aided by curve fitting to, or interpolation of interbin energy levels in FFT outputs. |
II. FREQUENCY INTERPOLATION METHOD |
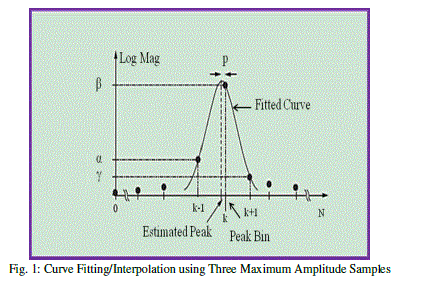
| Curve fitting [4], [5] is the process of constructing a curve, or mathematical function, which has the best fit to a series of data points, possibly subject to constraints and is used to find the best fit line or curve for a series of data points. Most of the time, the curve fit will produce an equation that can be used to find points anywhere along the curve. Curve fitting can involve interpolation, where an exact fit to the data is required, or smoothing, in which a smooth function is constructed that approximately fits the data. Fitted curves can be used as an aid for data visualization, to infer values of a function where no data is available, and to summarize the relationships among two or more variables. Interpolation is a curve fitting method of constructing new data points within the range of a discrete set of known data points. By means of the Fast Fourier Transform algorithm, frequencies of individual components can be evaluated from their locations in the discrete spectrum with a resolution depending on the number of samples. If the actual frequency of a signal does not fall on the center frequency of a FFT bin, several bins near the actual frequency will appear to have a signal component. In that case, we can use the magnitudes of the nearby bins to determine the actual signal frequency. The frequency of a sinusoidal component can be determined with improved resolution by curve fitting using interpolation method for a parabola through the three largest consecutive spectrum bins corresponding to the component. The abscissa of its maximum constitutes a better frequency approximation. The frequency response of a FFT is shown in Fig. 1. The x-axis is the frequency bin and the y-axis is the logarithmic magnitude of the N points FFT spectrum. K-1, K and K+1 are the locations of previous peak bin, peak bin and next peak bin of the spectrum respectively. The respective logarithmic amplitudes of the bins are α, The center point p gives us interpolated peak location (in bins). The frequency resolution for N points FFT is Fs/N. The proposed FFT Curve Fitting Frequency Estimation method calculates the offset in frequency bin ‘p’ using the three maximum amplitude samples to estimate the frequency of the signal with high accuracy. The similar approaches are also published in [6], [7]. |
 |
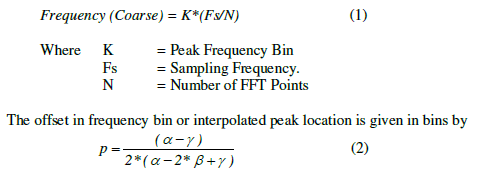
| The input frequency of the signal after normal FFT spectrum analysis is given by |
 |
 |
III. DIGITAL RECEIVER TECHNOLOGY |
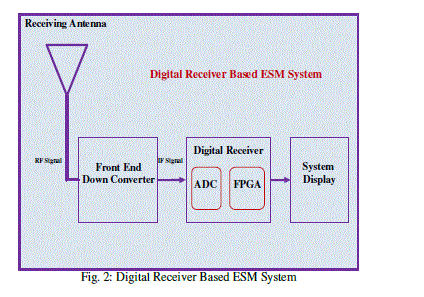
| Fig. 2 shows the ESM System [2] based on the Digital Receiver Technology. It consists of the receiving antenna covering the frequency range 0.5 – 40 GHz. Using the front end down converter this frequency range of RF signals are converted to IF frequency bandwidth of 500 MHz or 1 GHz which becomes input for the Digital Receiver. The major basic components of digital receiver are ADCs and FPGAs. Because of availability of high speed ADCs, high end FPGAs and DSPs, direct sampling of the IF signals having this frequency bandwidth is feasible. To process 500 MHz IF bandwidth signals, most of the Digital Receivers employ the band pass sampling frequency around 1.2 – 1.5 GHz and real time FFT of 256 points or 512 points are used to find out the parameters of the signals. Finally the measured parameters are displayed on the system display as emitter track. |
 |
IV. IMPLEMENTION OF FREQUENCY INTERPOLATION ALGORITHM IN FPGA |
| The procedures for implementation of FFT and Frequency Estimation in FPGA are shown in Fig. 3. First, the sampled data from the ADC is latched in the FPGA. N points FFT is then performed. The magnitude of the FFT spectrum is measured in logarithmic scale. From the FFT spectrum the three maximum amplitude values α, and their corresponding frequency bins K-1, K, K+1 are stored. |
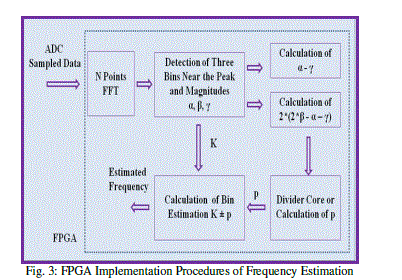 |
| After storing these values the following steps are required for the frequency estimation. |
 |
V. SIMULATION RESULTS |
| The simulation work for frequency estimation is performed using 256 points in MATLAB and ISE environment. In ISE environment, VHDL code is written along with test bench. The sampling frequency of the ADC is chosen as band pass sampling frequency of 1.35 GHz. The performance of the frequency estimation algorithm is evaluated for different pulse width and for different power level of the signals. The input frequency of the signal is varied in steps of 0.5 MHz and RMS frequency measurement error is calculated |
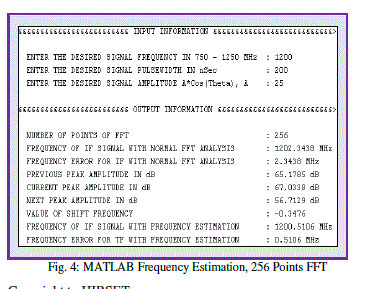 |
| The MATLAB simulation in Fig. 4 shows the output of 256 points FFT. The selected frequency is 1200 MHz having pulse width of 200 nSec. Using the normal FFT analysis the measured frequency error is 2.3438 MHz whereas using frequency estimation algorithm the measured frequency error is 0.5106 MHz The MATLAB simulation in Fig. 5 shows the output of 256 points FFT. In this simulation the RMS frequency measurement error is calculated for the frequency range of 750 – 780 MHz in steps of 0.5 MHz, Using the normal FFT analysis the measured RMS frequency error is 1.5231 MHz and peak frequency error is 2.6953 MHz whereas using frequency estimation algorithm the measured RMS frequency error is 0.3459 MHz and peak frequency error is 0.8186 MHz |
VI. REAL TIME TEST RESULTS USING DIGITAL RECEIVER |
| The frequency estimation algorithm presented in this paper is implemented in Xilinx Virtex-5 FPGA LX240. ADC used in the Digital Receiver hardware is ADC08D1500. The sampling frequency of the ADC is 1350 MHz which is a band pass sampling frequency for 750 – 1250 MHz (500 MHz IF bandwidth) frequency range signals. The performance of the algorithm is evaluated by implementing 256 points. The inbuilt pipeline FFT IP cores of FPGA are used for spectral analysis. The output of the algorithm is analysed for different frequencies and pulse widths of the signal using Logic State Analser (LSA) by programming FPGAs through JTAG port in real time. |
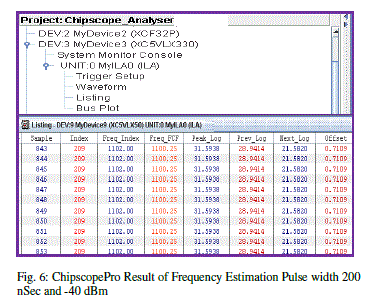 |
| Fig. 6 shows the ChipscopePro output of 256 points FFT. The frequency of the signal is 1100 MHz having pulse width of 200 nSec and -40 dBm power level. Using the normal FFT analysis the measured frequency is 1102.00 MHz i.e. error of 2 MHz, whereas using frequency estimation algorithm, the measured frequency of the signal is 1100.25 MHz i.e. error of 0.25 MHz, these results also show the three maximum peak amplitude values in dB which are used for calculation of shift in the frequency bin value. Fig. 7 shows the LSA output of 256 points FFT. The frequency of the signal is 1000 MHz having pulse width of 200 nSec and -40 dBm power level. Using the normal FFT analysis the measured frequency is 1001.75 MHz i.e. error of 1.75 MHz, whereas using frequency estimation algorithm the measured frequency of the signal is 1000.00 MHz i.e. error of 0 MHz |
VII. FPGA RESOURCE UTILIZATION |
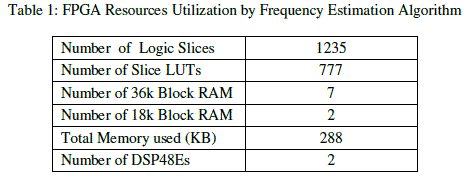
| The complete VHDL code of Frequency Estimation Algorithm along with FFT implementation has been done in Xilinx Virtex-5 LX 240 FPGA. Table 1 shows the resource utilization by this particular algorithm presented in this paper. This utilization is very much less as per the latest FPGAs which is having large number of Logic Slices, Block RAMs, and DSP Slices resources, described in [8]. |
 |
VIII. CONCLUSION |
| From proposed Curve Fitting FFT Frequency Estimation Algorithm approach, it is observed that there is huge improvement in frequency resolution and accuracy measurement. In case of 256 points, the frequency measurement accuracies with this approach are less than 0.5 MHz rms against 1.56 MHz rms with normal FFT spectrum analysis. After the FFT implementation in FPGAs, this approach can be applied over and above FFT spectrum for fine frequency measurement. With the minimum FPGA resources, frequency resolution and accuracy can be improved by large factors using frequency estimation algorithm, which will be helpful for realising a good ESM system based on Digital Receiver for EW applications. |
ACKNOWLEDGEMENTS |
| The author expresses their sincere acknowledgement to Shri S. P. Dash, DS & Director DLRL for his continuous encouragement, guidance and support for this work. The author would also like to acknowledge senior officers and colleagues for their guidance and support to perform this work. |
References |
|