ISSN ONLINE(2319-8753)PRINT(2347-6710)
ISSN ONLINE(2319-8753)PRINT(2347-6710)
Dr. Leena Singh 1 & Prof. (Dr.) S.K Choudhary 2
|
| Related article at Pubmed, Scholar Google |
Visit for more related articles at International Journal of Innovative Research in Science, Engineering and Technology
The river Ganga, the life line of millions of people, provides water for the essential requirements of life. However, over the years it has been subject to tremendous pressure due to untreated sewage and industrial effluents being dumped in to the river at numerous places and the residues of pesticides and insecticides used in the farms are washed in to it. In this study, water samples from river Ganga were monitored for pH, dissolved oxygen, total hardness, nitrate nitrogen and phosphate phosphorous at three sampling locations for two consecutive years on monthly basis. The study of physico-chemical parameters indicates that the quality of its water has substantially declined. Detoriated water quality of river has potential health risks to drinking water consumers and organisms in Ganga river basin. Further work is needed to determine the bioaccumulation of these toxic elements in the food web and the associated risks to the ecosystem and human health. are compared.
Keywords |
| Ganga River, Water quality, Physio-Chemical parameters. |
INTRODUCTION |
| Rivers are designated as sacred and have remained a lifeline in India and other countries. The river Ganga, a symbol of India’s age-old cultural heritage and civilization, occupies a unique position in the ethos of Indian people. Love of people for this river is beyond limit and reason. The river Ganga, the life line of millions of people, provides water for the essential requirements of life. The river Ganga, a holy river, has over the years been subject to tremendous pressure. Most of its water in the upper reaches is diverted in to canals; untreated sewage and industrial effluents are dumped in to the river at numerous places and the residues of pesticides and insecticides used in the farms are washed in to it. It is further aggravated by deforestation resulting in silting, floods and reduced navigational possibilities. River Ganges once valued for her absolute purity, has become a site for environment catastrophe in last hundred years. Thus this study evaluates the physico-chemical characters of water of river Ganga from Champanala, Nathnagar to Barari, Bhagalpur. There is distinct correlation between physico-chemical and biological composition of rivers which is well balanced. This balance gets greatly disturbed due to inputs from towns, industries, agricultural lands and all other kinds of human activities. Therefore, it becomes necessary to analyse the physico-chemical characteristics of river water which to a great extent determines the pattern of aquatic biota and biological productivity. Besides, chemical factors either individually or in association with each other are very important in the assessment and control of water pollution [1, 2]. The limnological study of the river Ganga from Champanala, Nathnagar to Barari, Bhagalpur was undertaken and monthly evaluation of physico-chemical quality of the river water was done during the course of investigation at three different pre-selected sites. The periodic fluctuations in physico-chemical properties of the river water, their interrelationship, seasonal variation are detailed in this study. |
MATERIALS AND METHODS |
| Study Area |
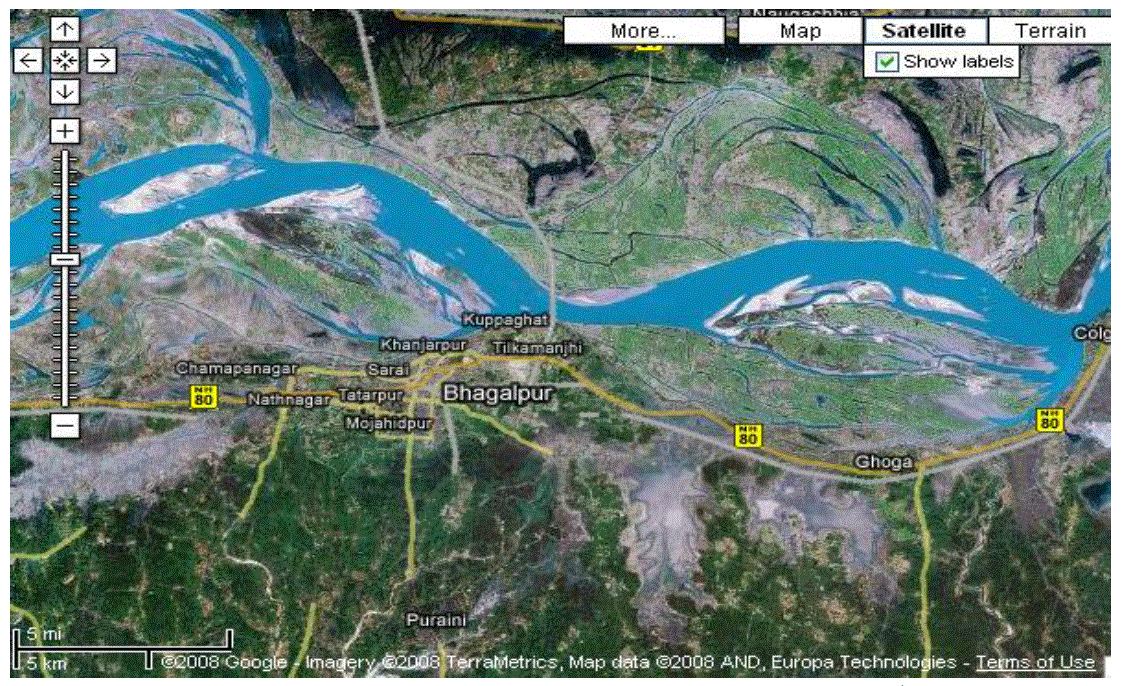
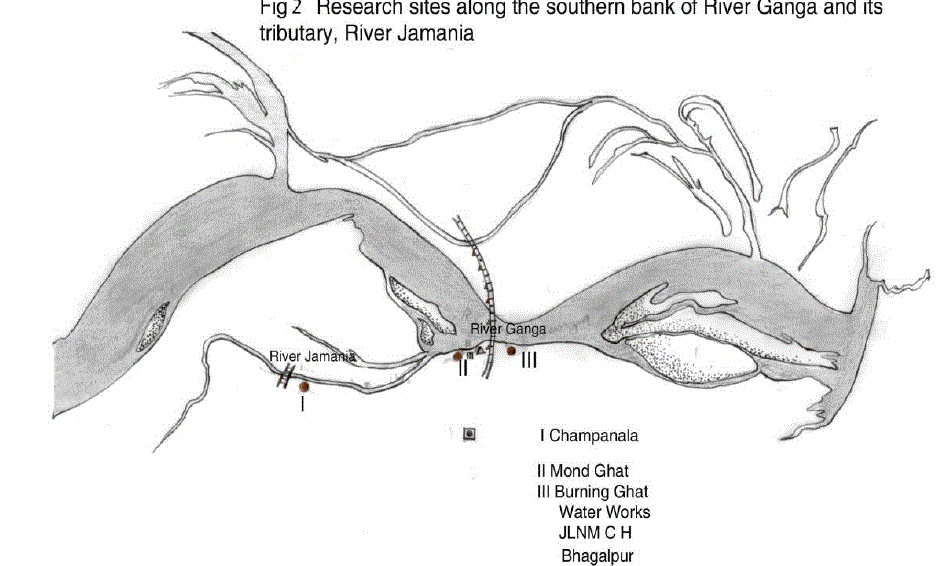
| The study area included the gangetic stretch in Bhagalpur starting from Champanala Nathnagar to Burning ghat Barari. (Fig.1& 2) A total of three sampling locations were selected on the Southern bank of Jamania river channel and Ganga depending upon the presumed water quality and extent of pollution. They were Champanala (site I, upstream), Mond ghat (site II, midstream) and Burning ghat (Site III, downstream). |
 |
 |
| Sample Collection |
| Analysis of certain Physico-chemical parameters like pH, dissolved oxygen (DO), total hardness (TH), phosphatephosphorous (PO4-P), nitrate-nitrogen (NO3-N), of water samples collected from of river Ganga at pre selected sites at Bhagalpur was done at monthly intervals between 8.00 and 11.00 hours. Water samples were brought to the laboratory in Pyrex glass specimen bottles. Parameters like pH and dissolved oxygen were estimated at the spot immediately after the collection of the samples whereas water analysis relating to other chemical factors was done in the laboratory. Each sample was subjected to the concerned analytical (gravimetric/ volumetric/ calorimetric) procedure and the mean value of three observations was taken. |
| For determining the different physico-chemical characteristics of water Standard Methods for Examination of Water and Wastewater [3], was followed. |
RESULTS AND DISCUSSION |
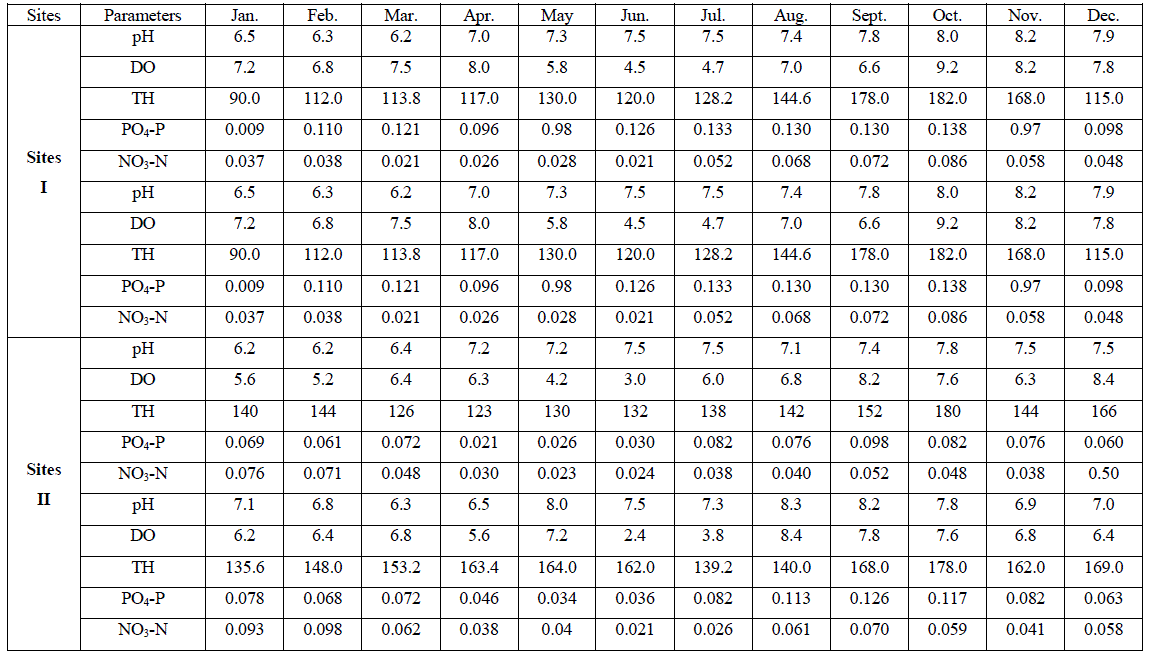
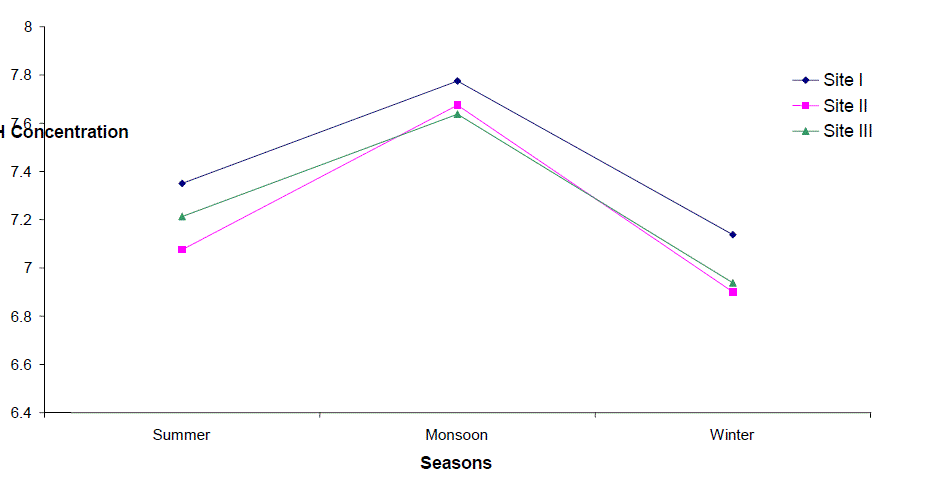
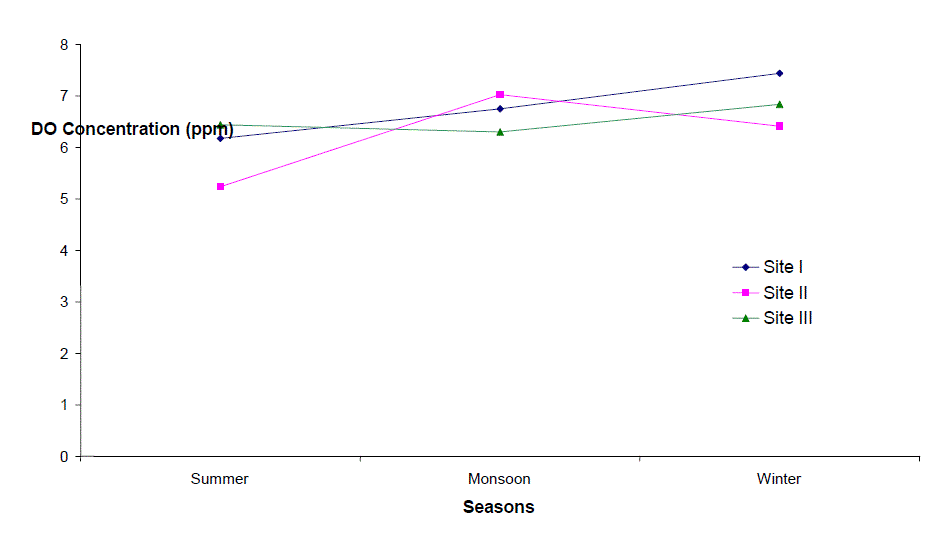
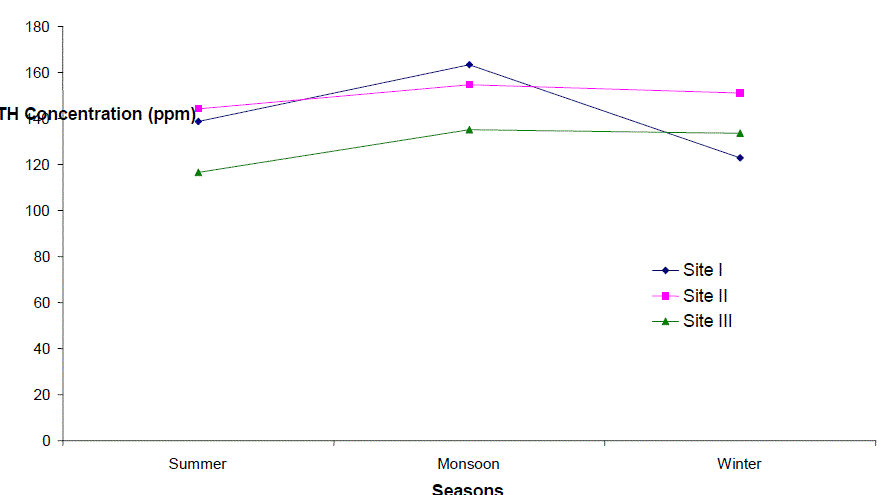
| An account of monthly value of different factors evaluated at sites I to III is depicted in Tables 1. The average seasonal variations in physico-chemical factors have been presented in Figs. 3 -7. |
| Hydrogen Ion Concentration (pH) |
| pH fluctuated between 6.2 to 8.5, 6.2 - 8.3 and 6.2 to 8.3 at sites I to III respectively. The seasonal variation of pH of water ranged from 6.7 to 7.8 with the peak in monsoon months and lowest in summer months at site I and site III respectively in the next year. However, overall lower pH values were observed in winter months. The pH value of Ganga water falls between slightly acidic to moderately alkaline in the present study which is well within the permissible limit of pH (6.5 to 8.5 for multiple uses of water) as prescribed by [4]. |
| According to Hutchinson [5] in most of the instances where the water is neither very acidic nor very alkaline, the pH is regulated by the CO2-HCO3 system. The relatively higher values of pH in monsoon months coinciding with maxima of total rainfall may be attributed to the considerable dilution of water which increased the buffering effects of the systems. The river water seems to possess high buffering capacity as evidenced by pH fluctuation within a narrow range. pH was positively correlated to Total hardness and Nitrate-Nitrogen at site I, the values being significant at 5% and 1% respectively. |
| Dissolved Oxygen (DO) |
| Dissolved Oxygen content of the water varied from 3.2 to 9.2 ppm, 2.4 to 8.4 ppm, and 4.0 to 8.2 ppm at sites I to III respectively. It was high during the winter as well as in monsoon months with the maxima at site I (9.2 ppm). Its concentration declined gradually touching a minimum level during summer months at all the sites. Site II registered lower (2.4 – 8.4 ppm) and site I higher DO content (4.5 – 9.2 ppm) except that of 3.2 ppm in June, during the study period. The minimum concentration was recorded in summer in almost all the sites. It is clear from the result that there was a low DO concentration during the summer months at almost all the sites that might be due to dependence of DO on temperature [6, 7]. They also made similar observations while studying physico-chemical factors of river and lake waters. The minimum level of DO at site III during rainy season might be due to turbidity effect which minimized the dissolve oxygen content or due to inflow of more town sewage with less oxygen content. Welch, Rattner and Blum [8, 9,10], also reported the reduction of oxygen contents due to the entry of drainage water. Talling [11], also made similar observation while studying the ecology of river Nile. Highest concentration of DO was recorded during winter month (9.2 ppm); this might be due to low water temperature. Lowest DO content in the month of June and July is much below the critical values assigned by BIS [4] i.e. 6 mgl-1. This might be due to increased respiration of plants, animals and aerobic bacteria and decay and decomposition of organic matter. Most of the causes of oxygen reduction mentioned above act simultaneously. The dissolve oxygen content was below as well as above the permissible limit assigned by BIS[4], at almost all the sites and in all the seasons. However, no definite correlationship between dissolved oxygen and other physico-chemical parameters were established. From the results of the present study, it appears that temperature is the factor which influences DO directly. DO does not have any direct bearing on the health risks of humans but can predict the water quality of the system. |
| Total Hardness (TH) |
| Total hardness ranged from 90 to 200 ppm, 123 to 180 ppm and 93.5 to 172.5 ppm at sites I to III respectively. It varied from 90 to 200 ppm. The seasonal behaviors of TH were more or less similar at all the sites. It was lowest at site I (90 ppm) and even highest at site I (200 ppm) in winter and monsoon respectively. The hardness of water is not a pollution indicator parameter but indicates water quality mainly in terms of Ca2+ and Mg2+. Water with less than 75 mgl-1 (or ppm) of CaCO3 is considered soft and above 75 mgl-1 (or ppm) of CaCO3 as hard [12]. TH values crosses the WHO limit of 100 mgl-1 (or ppm) [13], in almost all months at all the sites, indicating that it may affect the potability of water and indicating that water of all sites as fairly hard. However, it may not be harmful from human health point of view. CO2 reacts more readily with calcium and magnesium and convert them in to soluble bicarbonates and this probably accounts for the higher values of the total hardness. The higher value of total hardness in rainy season and in some months of winter may be assumed to result from poor dilution owing to low precipitation rate. The lower values of TH in some months of summer season may be assumed that in the absence of carbon dioxide in free form, some of the half bound carbon (HCO3) gets channelized in to bound form (CO3), thus resulting in low bicarbonate values. TH was positively correlated to pH at site I and DO at site II in the second year. |
| Phosphate- Phosphorus (PO4 – P) |
| The variation in phosphate content of water ranged from 0.009 to 0.97 ppm, 0.021 to 0.117 ppm and 0.012 to 0.110 ppm at sites I to III respectively. It varied in the range of 0.009 to 0.117 ppm. Lower values were recorded during summer months except that of at site I and higher in rainy as well as winter months. PO4 – P comes mainly from sewage, household effluents and detergents in to these water bodies. It is one of the most important nutrients for the growth of algal flora [14, 15(a, b),16].The concentration of PO4 – P showed periodic fluctuations at different sites. The minimum concentration at site I i.e. 0.009 ppm might be due to growth of maximum phytoplankton at that time. Similar conclusion was made by [17, 18, 19, 20, 21, 22, 23]. However overall the increase in phosphorous content at site I in all season and at site II in rainy season may be possibly due to regeneration of phosphorous from the bottom as also reported by [18]. An average increase in phosphorous contents during rainy season at all the sites might be possibly due to inflow of water, rich in colloidal clay particles containing various salts from extraneous sources [24]. PO4 – P was positively correlated to DO at site II in both the years of study. |
| Nitrate- Nitrogen (NO3 – N) |
| Nitrate content of the water varied from 0.021 to 0.116 ppm, 0.021 to 0.098 ppm and 0.016 to 0.110 ppm at sites I to III respectively. It varied in the range of 0.016 to 0.116 ppm. Its concentration was low in summer and high in rainy season except that of at site II which registered higher concentration in winter months. NO3 content was lowest at site III (0.016 ppm) in April, month and highest at site I (0.116 ppm) in the month of November. Nitrogen content of water is of great significance for the algal growth. During rainy season its concentration was comparatively higher except that of at site II. The chief source of nitrogen in the river water is the decomposed organic matter due to microbial population. Besides, rain washings and the rain water also contribute substantially towards the supply of nitrogen. Mordy [25] reported that rain water could supply 0.20 – 0.28 ppm of nitrates. 0.01 – 0.25 ppm of nitrate-nitrogen was established in rain water [24]. Even though rainfall is a consistent source of combined nitrogen, yet its concentration varies greatly with geographical conditions of the area [26]. NO3 – N content was low in summer, this might be due to its rapid rate of consumption by the phytoplankton. Singh, Pahwa and Mehrotra , Wang and Evans and Edmondson [18,27,19,20] also made similar observations. NO3 – N was positively correlated to pH at site I in the first year of study. |
 |
 |
 |
 |
 |
CONCLUSION |
| Thus we can conclude that the Ganga River gets seriously polluted due to discharge untreated sewage and industrial effluents and the residues of pesticides and insecticides used in the farms are washed in to it from the point and non point sources. As these toxic substances do not degrade, they remain persistent in the environment, and also have the ability to bioaccumulate in the food chain, which might pose potential hazards in long run. Although the toxicity of these elements have been discussed and could itself become a research topic. The present data indicated the potential of further water quality deterioration and pollution from nearby anthropogenic inputs. Therefore, any future pollution should be reduced and this, of course, should involve the authority to control the pollution sources that would aggravate the pollution levels of river water. Regular monitoring and strict law enforcement is needed to develop a strategy to manage the environmental hazards due to these elements and to improve environmental protection of this area. Our present data should serve as baseline for future reference. |
Acknowledgements |
| The authors are thankful to Department of Zoology, University of Delhi and ICAR, Pusa road New Delhi for providing laboratory as well as library facilities. Valuable scientific inputs by Dr. D.K.Singh and Dr. Irani Mukherjee are gratefully acknowledged. |
References |
|