International Journal of Innovative Research in Science, Engineering and Technology
ISSN ONLINE(2319-8753)PRINT(2347-6710)
ISSN ONLINE(2319-8753)PRINT(2347-6710)
Galadima Abednego1, Dajab D. Danjuma2, Bajoga G. Buba3
|
| Related article at Pubmed, Scholar Google |
Visit for more related articles at International Journal of Innovative Research in Science, Engineering and Technology
Efficient Handover mechanism in a GSM network is one of the parameters critical to GSM network service quality (QoS) and customer satisfaction. Handover is the process that transfers an ongoing call from one cell to another as the users move through the coverage areas of the cellular systems. This research focuses on analysing and optimizing intercell handover dynamics in Airtel Network in Kano. A three months call record sample data was used. Several cells in the Airtel Network in Kano were investigated by profiling and analysing their performance using standard mathematical relationships of Handover success rate, Call setup success rate, Blocking probability, Call drop rate which are relevant Key Performance Indicators. Data was obtained in Microsoft Excel format. Performance evaluation was carried out using Nigerian Communication Commission (NCC) QoS standard for Macrocell as benchmark. The evaluation revealed that seventy two percent (72%) of cells considered performed below NCC targets for Call Setup Success Rate (CSSR), Sixty four percent (64%) failed to achieve Handover Success Rate (HSR) and Standalone Dedicated Control Channel blocking rates targets, twenty one percent (21%) failed to achieve congestion targets. Average call drop rate per cell was predicted to be six (6%).
Keywords |
| GSM Network, Quality of Service (QoS), Intercell Handover, Key Performance Indicators |
INTRODUCTION |
| Global System for Mobile Communications (GSM) is a digital wireless network standard designed by standardization committees from major European telecommunications operators and manufacturers. The GSM standard provides a common set of compatible services and capabilities to all mobile users across Europe and several million customers worldwide [1]. The process of handover within any cellular system is of great importance. It is a critical process and if performed incorrectly can result in the loss of calls [1]. Dropped calls are particularly annoying to users and if the number of incidences of dropped calls rises, dissatisfaction increases that can lead a subscriber to change of network.One of the key elements of a mobile cellular telecommunications system is that the system is split into many small cells to provide good spectrum utilisation and coverage. However as the mobile moves out of one cell area into another, it must be possible to retain the connection.Handover process in cellular network automatically transfers a call from one radio channel to another radio channel while maintaining good quality of services (QoS) of a call [2]. |
| In the work of Nishith et al. [3] on handover in cellular systems, efficient handover algorithms they said will costeffectively preserve and enhance the capacity and Quality of Service (QoS) of communication systems. Ghaderi [1] emphasised that GSM handover is of great importance therefore, particular attention was given when GSM ETS standards were developed. Xuemin [4] analysed GSM handover based on real data, and using fuzzy logic based prediction techniques and found that the received signal strength and the received signal quality are the prime parameters in the handover decision. However, considering received signal strength and received signal quality only are not sufficient to provide an accurate result for optimum handover management solution.A more robust mechanism is required especially for intercell handover that interact more closely with channel assignment schemes. Kyriazakos et al.[5] in their work agreed that in order to be able to measure the network performance, the patterns of a normal day can be considered, while for performance evaluation congestion situations should also be analysed. The performance indicators presented are Traffic, Call Setup Success Rate, Handover Success Rate (HOSR), Standalone dedicated channel Blocking Rate and Traffic channel Blocking Rate. The work was focused on general performance evaluation and as such did not reveal the impact of the interplay among the parameters, specifically the dynamics of intercell handover success rate on network performance. Agustina et al.[6] agreed that an event-driven technique is needed to evaluate the performance degradation of GSM handover traffic due to introduction of GPRS in a GSM/GPRS network when various priority schemes for handover traffic over new call traffic are applied. Their work revealed that the performance of GSM handover traffic can be significantly degraded by the capacity reduction resulting from the introduction of GPRS but can be amended by using appropriate priority schemes. But, the GPRS traffic model used is a simple one therefore, a complex simulation environment is necessary in order to further validate their obtained results. |
| In performance analysis of cellular Networks with generally distributed handoff inter arrival times Dharmarajaet al. [7] provided numerical solutions for new and handoff traffic distribution. They used Markov regenerative process and mathematical theory to develop techniques for important QoS measures and validated the fact that the variance in addition to the mean is important in determining the handoff call blocking measures. The work involved complex and complicated mathematical models which mean that applying this to a large network will pose a great challenge.Wang et al. [8] worked on a probability based adaptive algorithm for call admission using simulation, the performance of probability based algorithm, the guard channels algorithm and adoptive algorithm was compared. The result showed that the probability based algorithm outperformed the later two algorithms in QoS measures which included Handover call blocking and new call blocking probabilities. The analysis was comprehensive and came out with a mature adaptive solution but strategies for deployment in a real network were not considered. Nishanthi [9] discussed handoff as an important component of resource allocation of cellular networks and revealed that Handoff is implemented on the voice channel and the rate varies with the size of the cell. The study did not say anything about possibility of integrating handover algorithm and resource allocation schemes. Moses [10] carried out a performance optimization of call handover in realistic wireless cellular Network. A system model with priority for handover was simulated and analytical equations were derived. Blocking and force termination probabilities were used as evaluation parameters. From simulation results it was discovered that the model improved the system by eighty-six percent (86%). Also, the study considered only measured handover data and neglected the impact of its relational behaviour on other quality of service parameters. |
| This research profiles performance of cells with specific attention on the impact of blocking probability, expected call dropping probability, handover failure rates, Traffic Channel call drop etc. Performance evaluation will be done using the Nigerian Communication Commission’s (NCC) recommended QoS standards for these parameters as the benchmark. Real GSM cell call data statistics from an OMC of Airtel in Kano was sought, processed and analysed. |
THEORETICAL BACKGROUND |
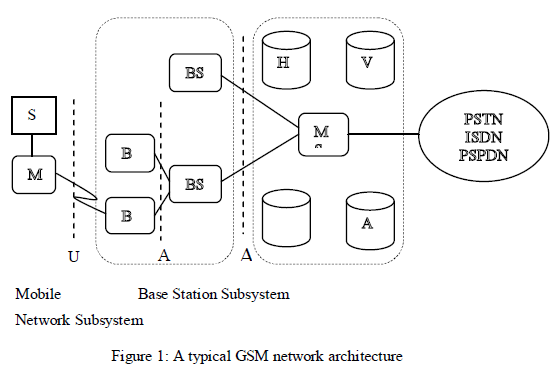
| The basic building block of a typical GSM network is the cell-site also called Base Transceiver Station (BTS). Next in the hierarchy is the Base Station Controller (BSC). This controls a number of base transceiver stations. Depending on the density of users and the topology, each BSC can control anywhere between 5-20 BTSs [11]. Finally the upper most and the most crucial element is the Mobile Switching Centre (MSC). Each MSC covers about 5-15 BSCs. |
| Each service provider has at least one MSC. The MSC normally houses the Home Location Register (HLR), Visitor Location Register (VLR), the Authentication Centre (AuC) and the Equipment Identity Register Equipment Identity Register (EIR). The HLR has all the relevant details of a particular subscriber like the service plan, the supplementary services, and the details about the mobile station, the latest coverage areas visited and billing details. The VLR primarily deals with roaming and exchange details of users gotten from foreign networks and also holds latest details of its own users roaming in other networks. The VLR also assists in handovers. In order to ensure that network operators will have several sources of cellular infrastructure equipment, GSM decided to specify not only the air interface, but also the main interfaces that identify different parts. Figure 1 describes a typical GSM network architecture. |
| Frequency reuse is the use of radio channels on the same carrier frequency to cover different areas which are separated from one another by sufficient distance so that co-channel interference is not a problem. The reuse of frequencies enables a cellular system to handle huge number of calls with limited numbers of channels but causes mutual interference that is Co-channel interference and adjacent channel interference (trade off link quality versus subscriber capacity) [12]. |
 |
| Reusing an identical carrier frequency in different cells is limited by co-channel Interference or C/I. Co-channel interference is the relation between the desired signal C and the undesired re-used signal I, both using the same carrier frequency.Suitable values for this ratio are settled through evaluation by a large group of listeners as to what is acceptable speech quality. The value given in the GSM recommendation European Telecommunication Standards (ETS) [1] for Co-channel interference ratio is ≥9 dB. |
| As the filters, limiting each carrier to its domain of 200kHz, are not ideal, the carriers will somewhat affect each other. The relation between the desired signal C from the correct carrier and the undesired signal (A) from the carrier 200 kHz away is called adjacent channel interference (C/A). When a frequency re-use pattern such as the 3/9 pattern is used, adjacent frequencies will be used in neighboring cells. This means that some of the energy of the adjacent frequency will leak into serving cell and cause interference. The limit for this ratio in GSM is C/A ≥-9 dB [12]. |
| There are different categories of GSM handover which involve different parts of the GSM network. The complexity depends on the number of elements involved in the process, for example, changing cells within the same BSC is not as complex as changing of cells belonging to different MSC. There are mainly two reasons for handover. First, when the mobile station moves out of the coverage range of a station or the antenna of BTS respectively. Secondly the infrastructure in the MSC or the BSC may decide that the traffic in one cell is too high and move some to other cells with lower load. |
| There are various handover methods which are as follows: The threshold method initiates handoff when the average signal strength of the current base station falls below a given threshold value and the signal strength of a neighbouring base station is greater than that of the current base station [13].The Hysteresis method initiates a handover only if the signal strength of oneof the neighbouring base stations is higher than a certain given hysteresis margin of the current base station [14].The Threshold with Hysteresis methodinitiates a handover when the signal strength of the current base station drops below a given threshold and the signal strength of a neighbouring base station is higher by a given hysteresis margin to that of the current base station. This method is often used in practice with +3dBhysteresis [15]. |
| The Fuzzy Handoff Algorithm (FHA) is a complex scheme using a set of prototypes assigned to each cell to calculate the serving base station. This uses a similarity measure to calculate the closeness of the membership function of a user to that of a base station to determine the need for a handoff [15]. A fuzzy logic rule base is created based on the known sensitivity of handoff algorithm parameters (e.g., RSS threshold and RSS hysteresis) to interference, traffic, etc. |
SOME KEY QOS PERFORMANCE INDICATORS |
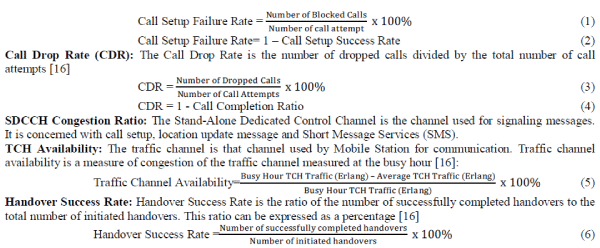
| In this section some relevant key Quality of Service (QoS) performance indicators are outlined and their respective mathematical relationships are given. These serves as valuable tools in QoS service impact assessment as a result of dynamics of intercell handover. |
| Call Setup Failure Rate: This refers to the number of the blocked call attempts divided by the total number of call attempts [16] |
 |
DATA COLLECTION METHODS |
| The main data used in this work was obtained from Airtel network in Kano, Nigeria. The data obtained covered the period from June 2011 to August 2011. Also used was the Nigerian Communication Commissions’ technical standard data which was downloaded. |
| The Nigerian Communication Commission (NCC) is the statutory regulating body for all Operators in the Telecommunication industry in Nigeria; in order to ensure uniform standards and quality service delivery to subscribers they have specified benchmarks for compliance by each industry operator. |
RESULTS AND DISCUSSIONS |
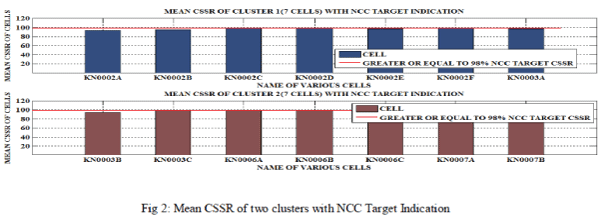
| From the data obtained for a Base Station Controller HKNBSx9, The statistical mean of relevant parameters was computed. The aim is to compare our values with NCC recommended standards. The results for fourteen different cells are presented. The system under study performs handover when the signal strength is at 102dB, else the call is dropped. We presented the mean Call Setup Success Rate values for all the cells when compared with NCC targets. Only KN0002F was able to achieve NCC target minimum of ninety eight percent (98%). A bar chart Fig 2 was plotted for both groups using MatlabR2009b, on the plot a horizontal thick black line was drawn to indicate NCC minimum CSSR recommended target (98%).In the second group of seven cells (cluster B) the cells Call Setup Success Rate performance improved a little bit with cells KN0006A, 7A and 7B achieving the NCC minimum CSSR set target. Note that 57% of the cells in this group did not meet up. This percentage is significantly high |
 |
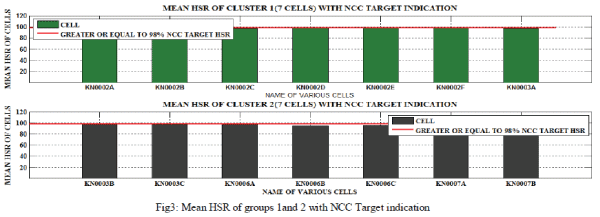
| The Handover success rate was alsocomputed. the statistical mean of cell handover success rates was presented among the first group of seven cells, cells KN0002D, 2E, and 2F achieved slightly above the NCC recommended minimum target of ninety eight percent (98%). It is not so impressive because 57% of the cells in a group of (7) performed below NCC recommended minimum targets. This have a negative effect on inter cell/Inter BTS handover dynamics. ), we qualitatively present, using a bar chart drawn with MatLab R2009b M-files. In the second group of seven cells there are only two cells (KN0003B & KN0006A) achieving the NCC recommended minimum target of 98%. This means that71% of the cells fell below the target. Fig 3 is the Mean HSR of groups 1and 2 with NCC Target indication. |
 |
| The Mean TCH congestion and mean SDCCH blockingwas also determined,it can be seen that whereas43% of the cells in a group (cluster) have the congestion value exceeding the NCC recommended limits the number is up to 57% for the standalone dedicated control channel blocking. |
| Influence of traffic load and SDCCH call drop on intercell handover in cells KN0002A: for cell KN0002A a graph of weekly pattern of behaviour for traffic load, standalone dedicated control channel call drop, and handover failure rate was plotted as shown in Fig 4. |
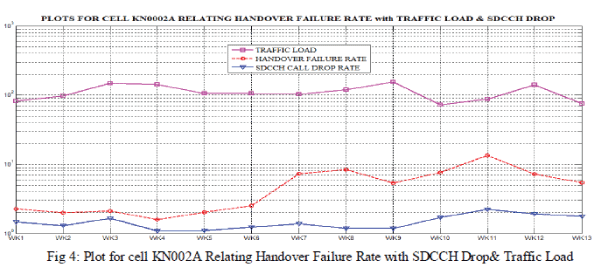 |
| It was observed that standalone dedicated control channel call drop relate in direct proportion with handover failure. Results shows that the standalone dedicated control channel blocking rates are outside the NCC recommended target of ≤0.2%, 70% of the period under consideration. This definitely gave rise to high standalone dedicated control channel drops and this translates into substantial revenue loss by the operator. The situations gave rise to congestion which must be avoided always since it degrades handover performance and therefore negatively affect QoS. |
Influence of traffic load and SDCCH call drop on intercell handover in cell KN0003A: |
| Similarly, a plot of weekly behavioural pattern of traffic load, standalone dedicated control channel call drop rate and handover failure rates was presented in Fig 5 for cell KN0003A. MatLabR2009b was used for the plot. |
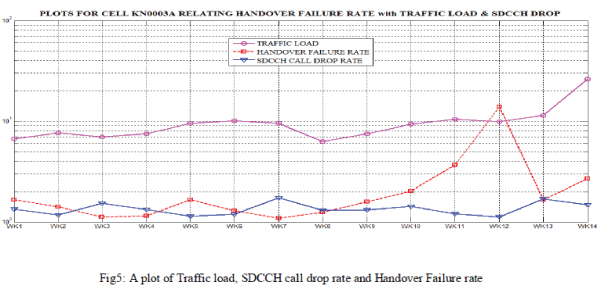 |
| The mean standalone dedicated control channel blocking probability have been poor with over 65% percent of the time performing outside the recommended NCC target. Increase in traffic load produced an increase in handover failure rates. The trend indicates poor dynamics of intercell/ Intercell BTS on call resources. |
Comparing the Influence of TCH Call Drop and Congestion on Intercell Handover in Cells KN0002A and KN0003A |
| Effect of TCH call drop and congestion on intercell handover in cell KN0002A: In Fig 6 traffic channel call drop and Congestion presented graphically alongside handover failure rate. With zero congestion, call drop on traffic channel was minimal until congestion begins to build- up and call drop in traffic channel increased. It was observed that increase in traffic channel call drop produced a corresponding increase in handover failure rates most times. |
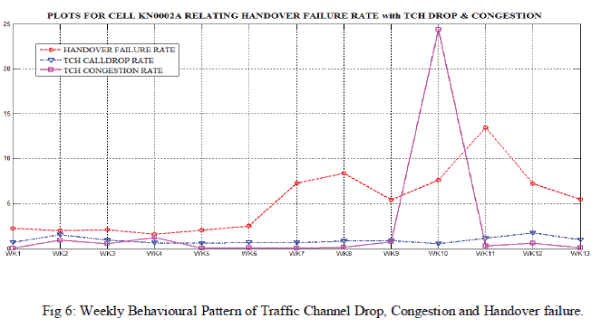 |
| It can be observed that the highest handover failure rate produced the highest Standalone Dedicated control channel call drop this clearly will reduce capacity of the system too for lack of resources and revenue is lost in the process. |
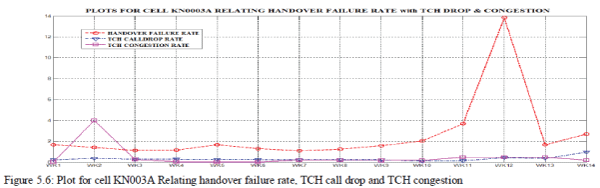
| Effect of TCH call drop and congestion on intercell handover in cell KN0003A: traffic channel congestion and handover failure rate weekly behavioural patterns were related to on the same scale. It was observed that in week eleven (11)there was steady sharp rise in handover failure while in week 12 a steep decline was observed this points to a fault condition in week eleven it is believed that the problem was rectified in week twelve (12). |
| It can also be observed that traffic channel call drop and handover failure rate is directly proportional. it can be observed that decreasing congestion in week 2 produced decreasing handover failure rate this can be attributed to availability of more channels for the handover. |
 |
CONCLUSION |
| Analysis and Performance evaluation was carried out using NCC QoS standard for Macrocell as benchmark. The evaluation revealed that seventy two percent (72%) of cells considered performed below NCC targets for Call Setup Success Rate (CSSR), Sixty four percent (64%) failed to achieve Handover Success Rate (HSR) and Standalone Dedicated Control Channel blocking rates targets, twenty one percent (21%) failed to achieve congestion targets. Average call drop rate per cell was predicted to be six (6%). |
References |
|