ISSN ONLINE(2319-8753)PRINT(2347-6710)
ISSN ONLINE(2319-8753)PRINT(2347-6710)
| MSc. M. Bitri1, Prof. S. Grazhdani1, A. Ahmeti1 Lecturers, Dept. of Wood Production, Faculty of Forestry Sciences, Agricultural University of Tirana, Tirana, Albania |
| Related article at Pubmed, Scholar Google |
Visit for more related articles at International Journal of Innovative Research in Science, Engineering and Technology
Simulation models that quantify the effects of water on yield at the farm level are valuable tools in water and irrigation management. To address this need, FAO has developed a yield-response to water model, named AquaCrop model, which simulates attainable yields of the major field and vegetable crops cultivated worldwide. Although the model is simple, it gives particular attention to the fundamental processes involved in crop productivity and in the responses to water, from a physiological and agronomic background perspective. The objectives of this study were to evaluate the AquaCrop model for its ability to simulate potato performance under full and deficit water conditions in a semi-arid environment in southeaster Albania. The ease of use of the model, the low requirement of input parameters, and its sufficient degree of simulation accuracy make it a valuable tool for estimating crop productivity under rainfed conditions, supplementary and deficit irrigation, and on-farm water management strategies for improving the efficiency of water use in agriculture. A set of conservative parameters calibrated and validated for potato in a prior study and considered applicable to a wide range of conditions and not specific to a given potato cultivar, are used to further evaluate the performance of AquaCrop model for potato using data from environmental conditions of Korça zone. The verification test shows that the model slightly overestimates canopy cover, and biomass. WP values of 31,6 g m−2 was considered to evaluate the model performance. While linear function between observed tuber yields and estimated by AquaCrop had always a correlation coefficient greater than 0.85 (p < 0.001). The AquaCrop model was able to accurately simulate soil water content of root zone, crop biomass and grain yield, with normalized root mean square error (RMSE) less than 10%..
Keywords |
| AquaCrop model, canopy cover, aboveground biomass, grain yield, deficit irrigation, potato production. |
LITERATURE SURVEY |
| Various studies have shown that one of the promising irrigation strategies might be deficit irrigation ([2], [3], [5], [6], [8], [13], [17]), whereby less water than required is applied during the growing period. Although this inevitably results in crop water stress and yield depression, high yield can still be obtained by supplying the required amount of irrigation water during sensitive crop growth stages, and by restricting the water stress to tolerant growth stages ([3[, [8]). Examining the yield response to different water applications in field and/or controlled experiments is laborious and expensive. Considering such limitations, modeling can be a useful tool to study and develop promising deficit irrigation strategies ([3[, [8, [10], [13], [16], [18], [26]). Models allow a combined assessment of different factors affecting yield in order to derive optimal irrigation quantities for different scenarios ([14], [17]). Furthermore, they can allow differentiating evapotranspiration between transpiration and evaporation and splitting up crop production in different sub-models ([9], [19], [20], [23]), which may help elucidate the mechanisms underlying higher water productivity under deficit irrigation. |
INTRODUCTION |
| On a global scale irrigated agriculture uses about 72% of available fresh water resources [8]. The rapid increase of the world population and the corresponding demand for extra water by sectors such as industries and municipal, forces the agricultural sector to use its irrigation water more efficiently, on the one hand, and to produce more food on the other hand. Defining optimum strategies in planning and management of available water resources in the agricultural sector is becoming a national and global priority [22]. Various studies have shown that one of the promising irrigation strategies might be deficit irrigation ([2], [3], [5], [6], [8], [13], [17]), whereby less water than required is applied during the growing period. Although this inevitably results in crop water stress and yield depression, high yield can still be obtained by supplying the required amount of irrigation water during sensitive crop growth stages, and by restricting the water stress to tolerant growth stages ([3[, [8]). Examining the yield response to different water applications in field and/or controlled experiments is laborious and expensive. Considering such limitations, modelling can be a useful tool to study and develop promising deficit irrigation strategies ([3[, [8, [10], [13], [16], [18], [26]). Models allow a combined assessment of different factors affecting yield in order to derive optimal irrigation quantities for different scenarios ([14], [17]). Furthermore, they can allow differentiating evapotranspiration between transpiration and evaporation and splitting up crop production in different sub-models ([9], [19], [20], [23]), which may help elucidate the mechanisms underlying higher water productivity under deficit irrigation. |
| Before any model can be used, calibration, parameterization and evaluation should be performed [1]. For parameterization calibration, one changes model parameters and even coding in order to obtain accurate prediction versus observed data. On the other hand, validation is the process whereby the model is run against independent data, without any modification of model parameters or code [21]. The FAO AquaCrop model predicts crop productivity, water requirement, and water use efficiency under water-limiting conditions. This model has been tested for maize ([10], [11]), cotton ([4,] [7]), sunflower [24], and quinoa [9] under different environmental conditions. All of them have illustrated that the model could accurately simulate the crop biomass and yield as well as soil water dynamics under full and water deficit irrigation and soil fertility stress conditions. As such, the aim of this paper was to evaluate this model under full and deficit irrigation on potato production in a semi-arid region of Korça, Albania. |
MATERIALS AND METHODS |
| A. ACUACROP MODEL DESCRIPTION |
| AquaCrop is a crop water productivity model developed by the Land and Water Division of FAO. It simulates yield response to water of herbaceous crops, and is particularly suited to address conditions where water is a key limiting factor in crop production. It is designed to balance simplicity, accuracy and robustness, and is particularly suited to address conditions where water is a key limiting factor in crop production. AquaCrop is a companion tool for a wide range of users and applications including yield prediction under climate change scenarios. As in other models, aqua-crop model structures its soil–crop–atmosphere continuum by including (i) the soil, with its water balance; (ii) the plant, with its growth, development, and yield processes; and (iii) the atmosphere, with its thermal regime, rainfall, evaporative demand, and carbon dioxide concentration. Additionally, some management aspects are explicit, with emphasis on irrigation, but also the levels of soil fertility as they affect crop development, water productivity, and crop adjustments to stresses, and therefore final yield. Pests and diseases are not considered. The growth engine of AquaCrop is water-driven, in that transpiration is calculated first and translated into biomass using a conservative, crop-specific parameter [9], the biomass water productivity, normalized for atmospheric evaporative demand and air CO2 concentration. The normalization is to make AquaCrop applicable to diverse locations and seasons. Simulations are performed on thermal time, but can be on calendar time, in daily time-steps. The model uses canopy ground cover instead of leaf area index (LAI) as the basis to calculate transpiration and to separate soil evaporation from transpiration. Crop yield is calculated as the product of above-ground dry biomass and harvest index (HI). |
| Although grounded on basic and complex biophysical processes [23], AquaCrop uses a relatively small number of explicit parameters and largely-intuitive input variables, either widely used or requiring simple methods for their determination. The inputs are stored in climate, crop, soil and management files and can be easily changed through the user-interface. |
| B. DESCRIPTION OF THE STUDY AREA |
| Experimental site (15 ha) is located in Drithas County (Fluvisol soil-FAO). Full-season hybrid potato was planted during the growing seasons, under irrigation and in both drainage lysimeters and the surrounding large experimental fields (4.4 ha). |
| C. SOIL AND WEATHER DATA |
| Conventional methods were implemented for the soil analysis. The parameters that were determined include soil texture, hydraulic properties, hydraulic conductivity, bulk density, and soil chemistry. Soil water content was measured gravimetrically in each 0.3 m layers down to 1.2 m depth every 5 days. Measurements were performed in two replications per treatment. Volumetric water content was obtained from gravimetric content and bulk density. The required input soil parameters for AquaCrop model are given in Table I. The experimental site is characterized by a Mediterranean climate, with rainfall confined mostly to the period from October to late March, and totalling 765 mm per year as an average for the past 30 years. An automated weather station inside the research center measured daily values of minimum and maximum air temperature and relative humidity, precipitation, solar radiation, sunshine and wind speed at 2 m height. |
 |
| Daily reference evapotranspiration (ET0) is computed using the FAO 56 Penman–Monteith approach, with data of daily solar radiation, minimum and maximum temperature, wind run, and maximum and minimum relative humidity. The growing season usually starts in middle April and ends in early October. Most of the days of the experimental periods were sunny, with solar radiation of approximately 9.26 to 13.85 MJ m−2 d−1 for the first half of the period and falling gradually to 8.27 to 4.93 MJ m−2 d−1 near crop maturity. Generally the temperature regime is warm during the growing season, with large differences between the daily maximum and minimum air temperature. The ET0 was normally in the 3.01 to 5.07 mm d−1 range, but can rise to 7 or 8 mm d−1 on days of high wind and large scale advection from dry upwind area. |
| D. CROP MANAGEMENT |
| The planting dates were 5 April 2011, and the planting densities were 8 plants m−2 (Table II). The nutrient requirements were determined based on soil analysis and were adequately met by fertilizer applications. Nutrients were applied before planting and nitrogen was also applied as top-dressing at the start of the stem elongation stage. Weeds were effectively controlled using herbicides, and no pests or disease infestations were observed during the plant growing seasons. It was fertilized with 120 kg ha-1, 40 kg ha-1 and 75 kg ha-1 of nitrogen, phosphorus and potassium, respectively. |
| E. USER-SPECIFIC PARAMETERS |
| For convenience, Hsiao et al. [11] grouped site-, management-, and crop-specific parameters such as soil water characteristics, maximum rooting depth, plant density, sowing date, irrigations, and phenology all under the heading of user-specific input parameters. These parameters for our study are presented in Table II. |
 |
| The calculated seasonal ET0, rainfall and irrigation applied for the full and vegetative stress treatments during the growing seasons are given in Table II. In addition, Table II also gives the water productivity values normalized for atmospheric evaporative demand and of carbon dioxide concentration (WP*) , and maximum canopy cover (CCx) also because CCx is density dependent. The LAI, seasonal biomass and grain yield, and other crop parameters were measured. |
| F. CONSERVATIVE PARAMETERS |
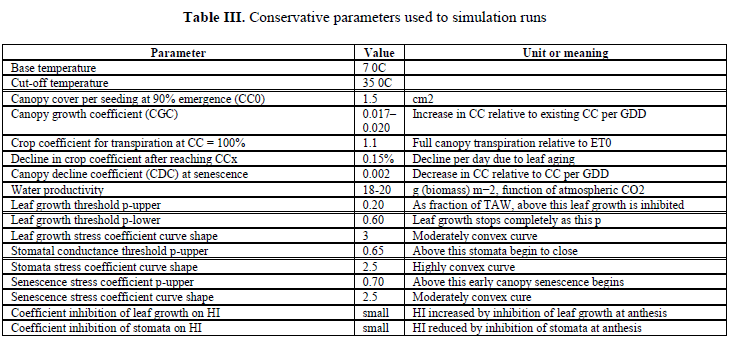
| Out of all the crop parameters in AquaCrop model, 17 of them were demonstrated or assumed to be conservative (constant) in the study of Raes et al. [20]. The same values of this set of 17 parameters (Table III) were used in the validation reported here to further evaluate the performance and robustness of aqua-crop model. These parameters include canopy cover growth and canopy decline coefficient; crop coefficient for transpiration at full canopy; WP* for biomass; soil water depletion thresholds for inhibition of leaf growth and of stomata conductance and for the acceleration of canopy senescence; and coefficients for adjusting the HI in relation to inhibition of leaf growth and stomatal conductance. These parameters are presumed to be applicable to a wide range of conditions and not specific for a given crop cultivar; the same parameters are used to simulate stress conditions, with stress effects manifested through the stress coefficients. |
 |
| G. MODEL VALIDATION |
| Validation is an important step of model verification. It involves a comparison between independent field measurements (data) and output created by the model. Soil water content over the root depth, above-ground dry biomass and grain yield were considered in this study for model evaluation. |
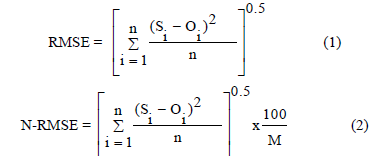
| Different statistic indices including coefficient of determination (r2), regression 1:1, absolute (RMSE) calculated by Eq. (1) and normalized root mean square error (N-RMSE) and agreement index (D-index) were employed for comparison of simulated against observed data. The normalized RMSE expressed in percent (Eq. (2)), was calculated according to Loague and Green [15]. |
 |
| where Si and Oi are the simulated and observed (measured) values as samples taken along the season (e.g., biomass and CC), or at the end of the season (e.g., grain yield), n is the number of observations, and M is the mean of the observed variable. The RMSE in Eq. (1) represents a measure of the overall, or mean, deviation between observed and simulated values, that is, a synthetic indicator of the absolute model uncertainty. In fact, it takes the same units of the variable being simulated, and therefore the closer the value is to zero, the better the model simulation performance. Normalized RMSE gives a measure (%) of the relative difference of simulated versus observed data. The simulation is considered excellent with a normalized RMSE is less than 10%, good if the normalized RMSE is greater than 10% and less than 20%, fair if normalized RMSE is greater than 20 and less than 30%, and poor if the normalized RMSE is greater than 30% [12]. In this study, the index of agreement (D-index) proposed by Willmott et al. [25] was estimated (Eq. (3)). According to the D-statistic, the closer the index value is to one, the better the agreement between the two variables that are being compared and vice versa. |
 |
RESULTS AND DISCUSSION |
| A. SOIL WATER CONTENT |
| The results (Table IV) show that the model performed very well for simulating water dynamics. The calculated RMSE, N-RMSE, D-Index and r2 were 18 mm, 3.5%, 0.89 and 0.94 for full irrigation and 19 mm, 4.2%, 0.92 and 0.96 for water deficit irrigation, respectively. |
 |
| B. CANOPY COVER DEVELOPMENT |
| AquaCrop was able to simulate accuracy the canopy cover (CC) development in irrigated and terminal water deficit treatments (Fig. 1). The simulated canopy cover was close to the observed values from planting to flowering, but after flowering there was a slight mismatch in the last senesced CC measurement, with measured CC declining slightly faster compared with simulated CC. This discrepancy could be related to increase environmental temperature abruptly in Drithas condition high temperature from anthesis onward which was resulted in faster senescence and decline of CC in Drithas condition. In AquaCrop model, as crop approaches maturity, CC enters in a declining phase due to leaf senescence. The starting time for canopy decline is considered to be later than the starting time of leaf senescence. That is because senescence starts generally in the oldest leaf located at the shaded bottom of the canopy that contributes little to transpiration or photosynthesis. The start of canopy senescence is functional at the time when canopy transpiration and photosynthesis start declining as maturity is approached. Senescence of the canopy can be accelerated by water stress any time during the life cycle, provided the stress is severing enough. The decline in green canopy cover is described by canopy decline coefficient. In this model the effect of high temperature stress on CC do not taking account, as such it cannot simulate canopy cover correctly at the end of crop life cycle. |
| C. ABOVEGROUND BIOMASS |
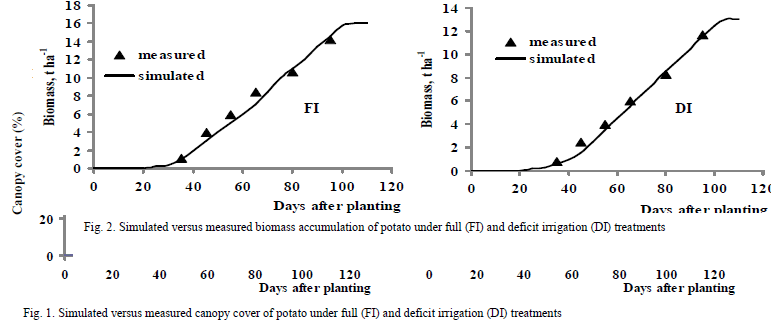
| Figure 2 shows the simulated and observed sequential aboveground dry biomass in irrigated and terminal water deficit treatments. In both treatments, the simulated above-ground dry biomass agrees well with observed values |
 |
| notwithstanding a slight overestimation by the model. This discrepancies might have been caused by error in measured data and/or the manner which the model simulate crop growth. In AquaCrop model aboveground biomass is derived from the crop transpiration by means of the crop water productivity, WP* normalized for ET0 and CO2 [23]. |
| D. FINAL ABOVE-GROUND BIOMASS |
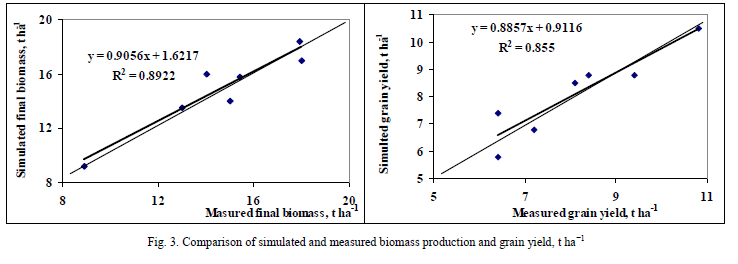
| There was generally a good agreement between the model predictions and measured biomass data (Table V; Fig. 3). The model predicted biomass values at harvest quite well. The calculated values of statistic indices, RMSE, normalized RMSE, D-index, and r2 were 0.6 t ha−1, 4.4%, 0.97 and 0.95, respectively. |
| E. GRAIN YIELD |
| The simulated grain yields showed a good agreement with measured potato yields (Table 5; Fig. 3). The simulated potato yield varied from 8.4 t ha−1 to 9.3 t ha−1, while the measured yield varied from 7.6 to 8.7 t ha−1 for full and deficit irrigation treatments in both of cropping seasons. The calculated model evaluation criteria between simulated and measured yield were RMSE = 0.27 t ha−1, normalized RMSE = 5%, D-index = 0.97 and r2 = 0.95. The AquaCrop model could very well predict top-weight biomass and grain yield of potato under Drithas conditions. |
 |
CONCLUSIONS |
| The validation of the AquaCrop model illustrated that the model was able to simulate soil water content of root zone, crop biomass and grain yield accurately. The simplicity of AquaCrop due to its required minimum input data, which are readily available or can easily be collected, has made it user-friendly for users. One important application of aqua-crop model would be to compare the attainable against actual yields in a field, farm, or a region, to identify the constraints limiting crop production and water productivity (benchmarking tool). It can also |
 |
| be very useful for scenario simulations and for planning purposes for use by economists, water administrators and managers. It is suited for perspective studies such as those under future climate change scenarios. Overall, it is particularly suited to develop agricultural water management strategies for a variety of objectives and applications. |
References |
|