ISSN ONLINE(2319-8753)PRINT(2347-6710)
ISSN ONLINE(2319-8753)PRINT(2347-6710)
| K. Sundararaju, A.Nandhakumar, S.Jeeva Department of Electrical and Electronics Engineering, M. Kumarasamy College of Engineering, Karur (DT), Tamil Nadu, India |
| Related article at Pubmed, Scholar Google |
Visit for more related articles at International Journal of Innovative Research in Science, Engineering and Technology
This paper gives the basic idea on phasor measurement unit (PMU). In this growing field of restructuring the power systems monitoring is of greater importance.This paper presents a critical review on different application of Phasor Measurement Units (PMUs) in electric power system networks for advanced power system monitoring, protection, and control. Also this paper presents the current status of the research and developments in the field of the applications of PMUs in electric power system networks. The laboratory testing of PMUs provides the accuracy in PMU measurements. Authors strongly believe that this survey article will be very much useful to the researchers for finding out the relevant references in the field of the applications of PMUs in electric power system networks.
Keywords |
| PhasorMeasurement Units (PMUs), Electric Power System Networks. Power system monitoring, restructuring power system |
INTRODUCTION |
| Synchrophasor technologies and systems use monitoring devices called phasor measurement units (PMUs) that measure the instantaneous voltage, current, and frequency at specific locations in an electric power transmission system.The sampling of these parameters takes place 20 or more times per electrical cycle which is 1200 or more times per second. PMUs convert the measured parameters into phasor values, typically 30 or more values per second. The PMUs also add a precise time stamp (using a well-defined format known as IEEE C37.118) to these phasor values turning them into synchrophasors. these phasor values, which are provided by PMUs in different locations and across different power industry organizations, to be correlated and timealigned and then combined[1]. The resulting product enables transmission grid planners and operators to have a high-resolution “picture” of conditions throughout the grid.Synchrophasor use has been increasing since 2004 when the U.S.-Canada blackout investigation report recognized that many of North America’s major blackouts have been caused by inadequate situational awareness for grid operators, and recommended the use of synchrophasor technologies to provide this real-time wide-area grid visibility[2]. More recently, the North American Electric Reliability Corporation’s (NERC’s) Real-Time Tools Best Practices Task Force recommended that real-time operational tools should have high-speed capabilities, both in terms of accessing data and processing the data, to ensure that the electric power systems in the future will be reliable. |
COMPONENTS OF PMU |
| 1.PMUs, which calculate and time stamp phasors, and use the created synchrophasors to measure grid conditions. Other devices with PMU-like capabilities include upgraded relays and digital fault recorders (DFRs), which normally capture data during specific events such as system faults (or short-circuits such as when a tree falls against a transmission line), equipment failure, and generators tripping out of service. |
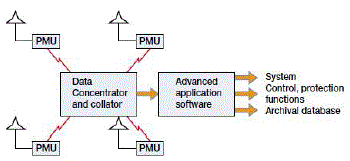
| 2. Phasor Data Concentrators (PDCs), which are computers with software that receive data streams from PMUs and other PDCs, time-align synchrophasor data from multiple sources to create a system-wide set of linked measurements that are sent to computers for processing in applications software. PDCs also perform data-quality checks, monitor the performance of the PMUs and feed a data archive[3]. Increasingly, PDC functionality can be located within the grid at transmission substations, aggregating local PMU data and feeding it to local applications and actions, as well as passing the data upstream to multiple applications and operations centers. |
| 3.Communications networks of varying technologies and speeds are used to deliver synchrophasor data between PMUs, PDCs, and operations centers. |
| 4.Applications that use synchrophasor data for online and offline use. An example of an online application is real-time grid monitoring and control for use by reliability engineers and by operators in the operations center. Off-line applications include uses such as operations modeling, transmission planning and forensic analysis. |
| Most of the Recovery Act synchrophasor projects are developing Wide-Area Measurement Systems (WAMS) to collect synchrophasor measurements from PMUs that are on their power system or across the interconnection if they are a reliability coordinator. The components of PMUs has been given in fig 1. |
 |
| A. Outlook of PMUs |
| PMUs facilitate innovative solutions to traditional utility problems and offer power system engineers a whole range of potential benefits,including: |
| • Precise estimates of the power system state can be obtained at frequent intervals, enabling dynamic phenomena to be observed from a central location, and appropriate control actions taken. |
| • To ensure acceptable quality of the power supplied to the consumers. |
| • Post-disturbance analyses are much improved because precise snapshots of the system states are obtained through GPS synchronization. |
| • To analyze the vulnerability of the system against any contingency. This is known as security assessment of the power system networks.Advanced protection based upon synchronized phasor measurements could be implemented, with options for improving overall system response to catastrophic events. |
| • Advanced control using remote feedback becomes possible, thereby improving controller performance. |
UTILIZATION OF PMU IN A POWER SYSTEM |
| The GPS system consists of 24 satellites in six orbits at an approximate altitude of 10,000 miles above the surface of the earth. They are thus approximately at one half the altitudes corresponding to a geo-synchronous orbit. The positioning of the orbital plane and the positioning of the satellites in the orbits is such that at any given instant at least four satellites are in view from any point on the surface of the earth. Often, more than six satellites are visible. |
 |
| The civilian-use channel of the GPS system transmits positional coordinates of the satellites from which the location of a receiver station on earth could be determined. In addition, the satellites transmit a onepulse per- second signal, along with an identifier for the signal that can be interpreted by the earth station receivers[5]-[8]. The civilian-use transmission of the time signal is precise to within 1 microsecond, and often in practice is found to be much more accurate. The time pulse is of critical importance to the application considered here. The normal practice is to phaselock a sampling clock to this pulse. The sampling instant would be identified as the pulse number within a one-second interval identified by the GPS time-tag. The exact format for time-tagging is defined in IEEE standard 1344. It should be mentioned that a time standard known as the IRIG-B standard is currently being used by the power industry for time-tagging digital fault recorders and other substation event monitoring systems. However, with standard IRIG-B receivers the synchronization accuracy is of the order of 1 millisecond, which is not enough for precise power system measurement. |
| A.Concepts Of Phasor Measurement |
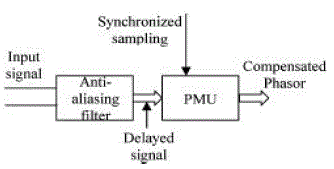
| Although a constant phasor implies a stationary sinusoidal waveform, in practice it is necessary to deal with phasor measurements whichconsider the input signal over a finite data window. In many PMUs the data window in use is one period of the fundamental frequency of the input signal. If the power system frequency is not equal to its nominal value (it is seldom), the PMU uses a frequency-tracking step and thus estimates the period of the fundamental frequency component before the phasor is estimated. It is clear that the input signal may have harmonic or non-harmonic components. The task of the PMU is to separate the fundamental frequency component and find its phasor representation. The most common technique for determining the phasor representation of an input signal is to use data samples taken from the waveform, and apply the Discrete Fourier Transform (DFT) to compute the phasor. Since sampled data are used to represent the input signal, it is essential that antialiasing filters be applied to the signal before data samples are taken. The antialiasing filters are analog devices which limit the bandwidth of the pass band to less than half the data sampling frequency (Nyquist criterion). |
 |
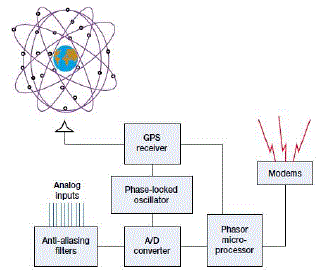
| The synchronization is achieved by using a sampling clock which is phase-locked to the one-pulse-per-second signal provided by a GPS receiver given in fig 3. The receiver may be built in the PMU, or may be installed in the substation and the synchronizing pulse distributed to the PMU and to any other device which requires it. The time tags are at intervals that are multiples of a period of the nominal power system frequency. It should also be noted that the normal output of the PMU is the positive sequence voltage and current phasors. In many instances the PMUs are also able to provide phasors for individual phase voltages and currents |
TESTING OF PMUs |
| Laboratory testing of PMUs includes two major aspects:Steady-state testing and dynamic testing, which intends to evaluate PMU performance with a set of laboratory testing Equipment[10]. In WECC, BPA in collaboration with the DOE Pacific Northwest National Laboratory (PNNL) has developed and practiced laboratory testing technology in support of WECC certification of PMUs for more than a decade. The US National Institute of Standards and Technology (NIST) initiated a standardization effort to characterize PMU performance. Several other testing efforts contributed to the area of PMU laboratory testing. |
| 1. Good quality GPS receiver with a GPS antenna. |
| 2. Good reception of GPS signals is needed to ensure the timingaccuracy. |
| 3. A signal generator: It should be able to generate multiphasesteady state and dynamic signals with specified accuracy for magnitude, phase, frequency, phase balance, and rate of change in these parameters. |
| 4. A data collection device: The data collection device receives phasor measurements from the PMU and transmits to analysis tools in appropriate formats. |
| 5. Analysis tools: A set of tools are needed to parse the PMU data and analyze them per testing specifications so the PMU performance can be characterized. |
| If defined, the steady-state tests shall be performedaccording to the signal range and test conditions .In this context, these steady-state tests are conformance tests to evaluate PMU performance against defined criteria in the IEEE C37.118 Standard. In contrast, other steady-state and dynamic tests are termed performance tests, for which the criteria are yet to be developed. |
| A.Steady-state PMU testing |
| For steady-state tests, the signals have a constant amplitude and frequency during the data collection part of the test. Thesteady-state tests are conducted to confirm that the accuracy of a PMU is within the specified limits when exposed to N specified steady-state operating conditions. The IEEE C37.118 Standard clearly defined the Total Vector Error (TVE) metric, and established the level 0 and level 1 compliance requirements under steady-state conditions for a PMU.These compliance requirements define the TVE level for phasor magnitude measurement, phasor angle measurement, harmonic distortion and out-of-band interference. |
| The following types of steady-state tests are proposed in Testing Guide: |
| • Magnitude accuracy test |
| • Phase accuracy test |
| • Frequency accuracy test |
| • Rate of change of frequency accuracy test |
| • Unbalanced magnitude response test |
| • Off-nominal frequency response test |
| • Harmonic frequency response test |
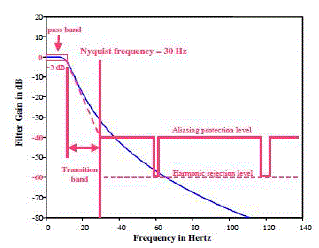
| • Out-of-band interference test: To evaluate PMU performance in response to signals with frequency outside the pass band of the PMU’s filtering characteristics. The requirements of filtering have been given in fig 4. |
| • Data reporting test: This is to confirm the PMU phasor protocol (e.g. C37.118), phasor reporting rate (e.g. 30 samples per second), and fractional second values corresponding to the reporting rate. |
| B. Dynamic PMU testing |
| For dynamic tests, the amplitude or frequency of thesignals varies during the test. IEEE C37.118 Standard does not establish compliance requirements under dynamic conditions. In this context, dynamic tests are performance tests in contrast to conformance tests. In many phasor applications, consistent dynamic performance among all PMUs in an interconnected system is of a great importance in addition to their steady state performance. For example, a system that measures and records phasors for post-event small signal stability analysis of system dynamics during a large system disturbance, where system frequencies at different locations could change dynamically, would require the PMUs to be able to follow the frequency change quickly and consistently among all PMUs. One of the key aspects of PMU dynamic performance is its filtering characteristic. |
 |
SURVEY OF PMU IN POWER SYSTEM APPLICATIONS |
| A.Distributed power system |
| Large-scale distributed measurement systems are the object of several applications and research. The goal of this literature is to develop, by employing GPS receivers, measurement techniques that are suited to the continuous monitoring of the electrical quantities indistribution networks in terms of synchronized phasors. |
| B.Harmonic Measurement in power system |
| A measurement system, based on high-performance Global Positioning System (GPS) receivers and generalpurpose acquisition (DAQ) boards, for the evaluation of the synchronized harmonic phasors in the nodes of an electric distribution network, is presented.To meet the requirements of different fields of application, two measurement procedures have been implemented: One is based on a fixedobservation window, whereas, in the other one, the observation interval is a function of the actual power system frequency. The measurement procedures have been extended to the field of harmonic quantities, making them suitable to set up an innovativemeasurement system that is able to perform evaluations of synchronized harmonic phasors on electric distribution networks. In this literature,further refinements of the procedures, along with new experimental results, are presented. Some works existing in the literature (see, for instance, |
| Proposed GPS-based harmonic measurement systems to determine the harmonic state, specifically for transmission systems. Such systems were developed to address issues of harmonic contamination in the transmission network and the associated possibility ofharmonic resonances. PMUs are among the most interesting developments in the field of real-time monitoring of electric power systems. In this literature, the implementation of digital procedures that are suitable for the evaluation of the synchronizedharmonic phasors in a flexible PMUs based on PXI modular hardware is presented. The results of the experimental tests are shown Tocharacterize the measurement system to evaluate the behavior of the designed instrument under real operating conditions on three-phase electric distribution networks |
| C. Power system voltage stability |
| Voltage collapse is a critical problem that impacts power system operational security. Timely and accurate assessment of voltage security is necessary to detect post-contingency voltage problems in order to prevent a large scaleblackout. This paper presents an online voltage security assessment scheme using synchronized phasor measurements and periodically updateddecision trees (DTs). Glavic and Cutsem addressed the early detection of impending voltage instability from the system states providedby synchronized phasor measurements. Recognizing that voltage instability detection requires assessing a multidimensional system, the methodfits a set of algebraic equations to the sampled states, and performs an efficient sensitivity computation in order to identify when a combination ofload powers has passed through a maximum. The important effects of over excitation limiters are accounted[12]. The approach does not requireany load model. The early detection of impending voltage instability from the system statesprovided by synchronized phasor measurements. |
| D. Oscillation Detection |
| Oscillations occur when a disturbance, such as a generator trips in the power grid and voltage or frequency swing high and low so that they are beyond their standard acceptable operating limits. A stable, welldamped electric system will settle back to normal operating values after an event or disturbance; undamped oscillations causing an unstable system could accelerate and lead to a voltage collapse or blackout. Because PMUs sample grid conditions at very high speeds, they can detect oscillations and facilitate operator alerting or automated intervention to facilitate damping actions, Routine low-frequency (small-magnitude) oscillations occur when an individual or group of generators oscillate or swing against other generators operating synchronously on the same system. These oscillations can be caused by power transfers from one utility system to another when high-speed automatic turbine controls attempt to maintain an exact frequency. |
| E.Frequency Stability Monitoring |
| PMUs measure power system frequency, which is a key indicator of the balance between generation and load in the power system. North America’s ac (alternating current) power system operates at a frequency of 60Hz (60 cycles per second), and normally deviates slightly higher or lower from 60Hz as the state of the power system continuously changes with generation and load. If the frequency is high then the generation is greater than the load, while generation lower than load yields frequency lower than 60 Hz. Abrupt changes in frequency due to major losses in generation or load can compromise power system stability and lead to a blackout. |
| F.Disturbance Detection and Alarming Studies |
| Analyses indicate that the rate of change of the phase angle difference between transmission substations, for example, is an important indicator of growing powersystem stress. Increasing phase angle or large phase angle difference is used as a basis for transmission operator alarms. One application for synchrophasorbased situational awareness and trending tools is to have them show the trend in phase angles compared to phase angle limits in order to warn operators when the stress is increasing. Such a tool offers intelligence to the power system operator. When phase angles exceed critical limits, operators can perform corrective actions. |
CONCLUSIONS |
| As the power system tends to restructuring the PMUs plays a vital role in empowering its operation. This survey aims to provide the operation of PMUs and its impact in power system. With the growing interest in PMUs and WAMS throughout the world, it is clear that these systems will be implemented in most major transmission networks. To a large extent the success of this endeavor depends upon adherence to the industry standard governing the PMUs. This paper has been also addressed a survey on major power system applications and helps in reducing the major power system blackouts.The real strength of using PMUs for disturbance recording isthe ability to easily support wide area recording using existing communications networks. Capturing data at various points on the system provides better analysis of system performance during power system faults. |
References |
|