ISSN ONLINE(2319-8753)PRINT(2347-6710)
ISSN ONLINE(2319-8753)PRINT(2347-6710)
Samir Chtita1, Majdouline Larif2, Mounir Ghamali1, Azeddine Adad1, Hmamouchi Rachid1 Mohammed. Bouachrine3 and Tahar Lakhlifi4*
|
| Related article at Pubmed, Scholar Google |
Visit for more related articles at International Journal of Innovative Research in Science, Engineering and Technology
To establish a quantitative structure-activity relationship for cytotoxic effects of two against different cancer cell lines, a series of thirteen imidazo[1,2-a]pyrazine derivatives molecules was submitted to a principal components analysis (PCA), to a multiple regression analysis (MRA), to a regression partial least squares (PLS), to a non-linear regression (RNLM) and to a neural network (NN). We accordingly propose a quantitative model, and we interpret the activity of the compounds relying on the multivariate statistical analysis. Density functional theory (DFT) and ab-initio molecular orbital calculations have been carried out in order to get insights into the structure, chemical reactivity and property information for the series of study compounds. The topological descriptors (Formula Weight, Molar Volume, Molecular Weight, Molar Refractivity, Parachor, Density, Refractive Index, Surface Tension and Polarizability) and the electronic descriptors (total energy (E), highest occupied molecular orbital energy (EHOMO), lowest unoccupied molecular orbital energy, (ELUMO) difference between the LUMO and the HOMO energy (Gap), total dipole moment of the molecules (ïÂÂ), absolute hardness (ï¨), absolute electron negativity (ï£) and reactivity index (ï·)) were computed with ACD/ChemSketch and Gaussian 03W program, respectively. This study shows that the MRA, PLS, and MNLR have served also to predict activities, but when compared with the results given by the ANN, we realized that the predictions fulfilled by this latter were more effective
Keywords |
| QSAR, DFT, imidazo[1,2-a]pyrazine, cell lines. |
I. INTRODUCTION |
| The use of chemicals in commerce, medicine and other aspects of daily life are generally acknowledged to be a quite positive benefit; however there is continuing concern about their negative impact on human health and the environment [1]. More than 100000 chemical substances are produced and used on a commercial scale, and about 2000 new ones are introduced onto the market each year. Many of these substances have little or no adverse effects, but some may be harmful to human health and the natural environment [2]. This dichotomy in social concern has caused both regulatory agencies and chemical industries to take an interest in the potential environmental impact of a particular chemical prior to its release into an ecosystem. The limited availability of experimental data necessary for the risk assessment of chemicals, and the general lack of knowledge of the properties and activities of existing substances, has led the European Commission to adopt a “White Paper on a strategy for a future Community Policy for Chemicals” [3]. |
| Quantitative Structure-Property/Activity Relationship (QSPR/QSAR) methods are among the most practical tools in computational physical chemistry. These methods are based on the axiom that the variance in the physicochemical properties and activities of chemical compounds is determined by the variance in their molecular structures. Thus, if experimental data are available for only some chemicals in a group, one can predict the missing from molecular descriptors calculated for the whole group and suitable mathematical model [4]. The global prediction of toxicity using QSAR has been the goal of many workers who utilized a variety of approaches. This goal is alluring, but has yet to be achieved satisfactorily. There are a number of reasons for the absence of success [5]. The deficiency of available toxicity data has clearly held back progress. This lack of success has been compounded in many studies by a poor appreciation of the insufficient heterogeneity, or chemical diversity, in the dataset. Further, while some molecular properties (such as hydrophobicity) are well described, others, including electrophilic reactivity, ionization, and hydrogen bonding, are poorly parameterized. Last, mechanisms of toxic action are not fully understood or misinterpreted, or their relevance in the modelling of toxicity is ignored [6]. |
| Discovery of new drugs for treatment of cancer has been gaining a great deal of interest mainly due to a universal resistance to conventional single drug chemotherapeutic agents. Multidrug resistance [7] characterized by resistance not only to drugs that are similar structurally and functionally but also cross-resistance to unrelated drugs like doxorubicin, vincristine, vinblastine, colchicines and actinomycin has been documented. Thus, search for novel anticancer agents with diverse chemical structure is need of the hour. Herein, we report the synthesis and evaluation of a series of imidazo [1, 2-a] pyrazines as potent anticancer agents. |
| Imidazo[1,2-a]pyrazines have been gaining attention in drug discovery realm especially as structural analogues of purines [8-10] (Fig. 1). Derivatives of imidazo[1,2-a]pyrazine exhibit various pharmacological activities such as antibacterial [11], anti- inflammatory [12-14], uterine relaxing activity [15], antibronchospastic [16], antiulcer [17], cardiac stimulating [18], antidepressant [19], hypoglycemic activity [20], antiproliferative activity [21], controlling allergic reactions [22], smooth muscle relaxant properties [23] and phosphodiesterase inhibitory activity [24]. They have also been shown to inhibit the receptor tyrosine kinase EphB4 recently [25]. |
 |
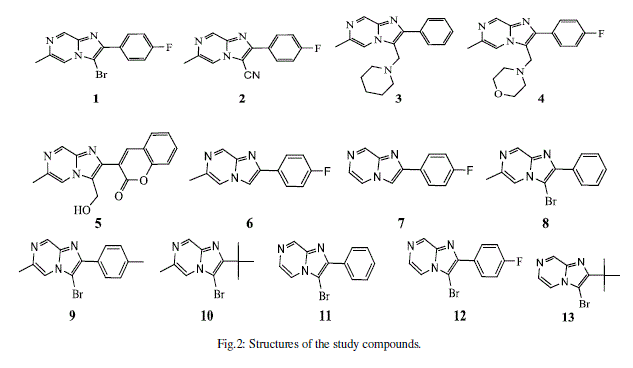
| In this work we attempt to establish a quantitative structure-activity relationship for cytotoxic effects of two against different cancer cell lines, by studying a series of 13 substituted imidazo[1,2-a]pyrazines (Figure 2) [26] have been synthesized with substitutions at 2, 3, 6-ring positions being varied generating mono-, di-, tri-substituted imidazo[1,2-a]pyrazines possessing functional groups like halo, hydroxymethyl, amine, alkyl, aryl, heteroaryl etc…[27]. |
 |
| We accordingly propose a quantitative model, and we try to interpret the activity of the compounds relying on the multivariate statistical analyses. The principal components analysis (PCA) has served to classify the compounds according to their activities and to give an estimation of the values of the pertinent descriptors that govern this classification. The multiple linear regression (MLR) has served to select the descriptors used as the input parameters for the partial least square regression (PLS), the multiples nonlinear regression (MNLR), and artificial neural network (ANN). These methods (MRA, PLS, and MNLR) have served also to predict activities, but when compared with the results given by the ANN, we realized that the predictions fulfilled by this latter were more effective. |
II. MATERIAL AND METHODS |
| A. Experimental data |
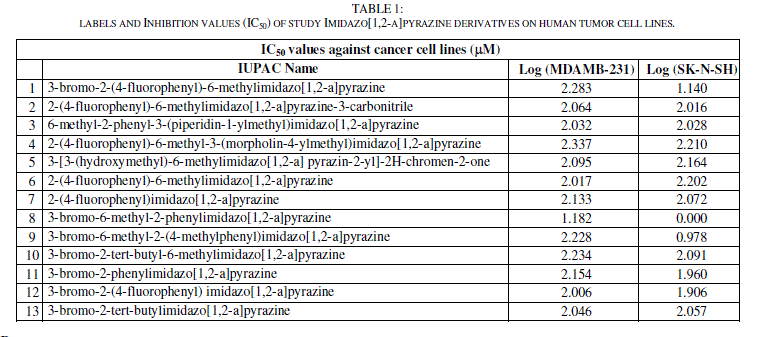
| The experimental IC50 (μM) cytotoxic effects of two against different cancer cell lines activities (MDAMB-231 and SK-N-SH) of imidazo[1,2-a]pyrazine derivatives are collected from recent publications [27]. The observations are converted into minus logarithm scale logIC50 and are included in table 1. |
 |
| B. Computational methods |
| An attempt has been made to correlate the activity of these compounds with various physicochemical parameters. |
| DFT (density functional theory) methods were used in this study. These methods have become very popular in recent years because they can reach similar precision to other methods in less time and less cost from the computational point of view. In agreement with the DFT results, energy of the fundamental state of a polyelectronic system can be expressed through the total electronic density, and in fact, the use of electronic density instead of wave function for calculating the energy constitutes the fundamental base of DFT [28] using the B3LYP functional [29] and a 6-31G (d) basis set. The B3LYP, a version of DFT method, uses Becke’s three-parameter functional (B3) and includes a mixture of HF with DFT exchange terms associated with the gradient corrected correlation functional of Lee, Yang and Parr (LYP). The geometry of all species under investigation was determined by optimizing all geometrical variables without any symmetry constraints [30]. |
| The 3D structures of the molecules were generated using the Gauss View 3.0, and then, all calculations were performed using Gaussian 03W program series, Geometry optimization of thirteen compounds was carried out by B3LYP method employing 6–31G (d) basis set. ChemSketch program (Demo version 10.0) [31] was employed to calculate the others molecular descriptors |
| C. Calculation of molecular descriptors |
| Calculation of descriptors using Gaussian 03W |
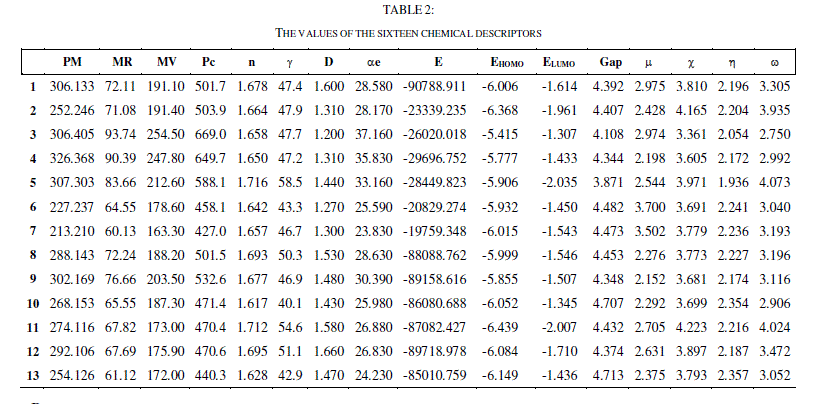
| From the results of the DFT calculations, the quantum chemistry descriptors were obtained for the model building as follows: the total energy (ET (u.a)), the highest occupied molecular orbital energy (EHOMO (eV)), the lowest unoccupied molecular orbital energy (ELUMO (eV)), the energy difference between the LUMO and the HOMO energy (Gap (eV)), the total dipole moment of the molecule (ïÃÂÃÂ(Debye)), absolute hardness (ïÃÂè), absolute electron negativity (ïÃÂã) and reactivity index (ïÃÂ÷) [33]. ïÃÂè, ïÃÂã and ïÃÂ÷ were determined by the following equations: |
 |
| Calculation of descriptors using ACD/ChemSketch |
| Advanced chemistry development's ACD/ChemSketch program [31] was used to calculate Formula Weight (PM), Molar Volume (MV (cm3)), Molecular Weight (MW), Molar Refractivity (MR (cm3)), Parachor (Pc (cm3)), Density (D (g/cm3)), Refractive Index (n), Surface Tension (ïÃÂçïÃâ¬Ã (dyne/cm) and Polarizability (ïÃÂáe (cm3)) [32]. |
| ïÃâ÷ Molecular Weight (MW): Used as the descriptor in systems such as transport studies where diffusion is the mode of operation. It is an important variable in QSAR studies pertaining to cross resistance of various drugs in multi-drug resistant cell lines. |
| Molar Volume (MV): The molar volume calculates from additive increments. The additive atomic increments were obtained using a database of density and calculated MW: |
 |
| D. Statistical analysis |
| To explain the structure - activity relationship, these 16 descriptors are calculated for 13 molecules using the Gaussian 03W, Gauss View and ChemSketch software. |
| The study we conducted consists of: |
| The principal component analysis (PCA) available in a software called XLSTAT |
| The multiple linear regressions (MLR) available in the XLSTAT software |
| The regression partial least squares (PLS) available in the XLSTAT software. |
| The non-linear regression (RNLM) available in XLSTAT software. |
| The Neural Network (RN) available in the software MATLAB Version 9. |
| The structures of the molecules based on imidazo[1,2-a]pyrazines, (1–13) were studied by statistical methods based on the principal component analysis (PCA) [34] using the software XLSTAT version Demo 2009 [35]. PCA is a statistical technique useful for summarizing all the information encoded in the structures of the compounds. It is also very helpful for understanding the distribution of the compounds [36]. This is an essentially descriptive statistical method which aims to present, in graphic form, the maximum of information contained in the data table 1 and table 2. |
| The multiple linear regression (MLR) analysis with descendent selection and elimination of variables was employed to model the structure activity relationships. It is a mathematic technique that minimizes differences between actual and predicted values. It has served also to select the descriptors used as the input parameters in the partial least squares (PLS), and the Multiples nonlinear regression (MNLR) and artificial neural network (ANN). |
| The (MLR), the (PLS), and the (MNLR) were generated using the software XLSTAT version Demo 2009 [35], to predict cytotoxic effects IC50 activities. Equations were justified by the correlation coefficient (R), mean squared error (MSE), fishers F-statistic (F), and significance level (F value) [35]. ANN is artificial systems simulating the function of the human brain. Three components constitute a neural network: the processing elements or nodes, the topology of the connections between the nodes, and the learning rule by which new information is encoded in the network. While there are a number of different ANN models, the most frequently used type of ANN in QSAR is the three-layered feedforward network [37]. In this type of networks, the neurons are arranged in layers (an input layer, one hidden layer and an output layer). Each neuron in any layer is fully connected with the neurons of a succeeding layer and no connections are between neurons belonging to the same layer. |
| According to the supervised learning adopted, the networks are taught by giving them examples of input patterns and the corresponding target outputs. Through an iterative process, the connection weights are modified until the network gives the desired results for the training set of data. A backpropagation algorithm is used to minimize the error function. This algorithm has been described previously with a simple example of application [38] and a detail of this algorithm is given elsewhere [39]. |
III. RESULTS AND DISCUSSION |
| A. Data set for analysis |
| The QSAR analysis was performed using the IC50 of the 13 compounds against the MDAMB-231, and SK-N-SH cells (experimental values) as reported in [27], the values of the 16 chemical descriptors as shown in table 2. |
| The principle (for the two studies) is to perform in the first time, a main component analysis (PCA), which allows us to eliminate descriptors that are highly correlated (dependent), then perform a decreasing study of MLR based on the elimination of descriptors (one by one) aberrant until a valid model (including the critical probability: p-value <0.05 for all descriptors and the model complete). |
 |
| B. Principal component analysis |
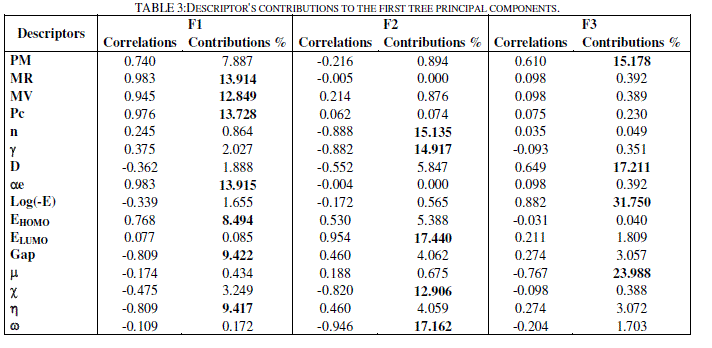
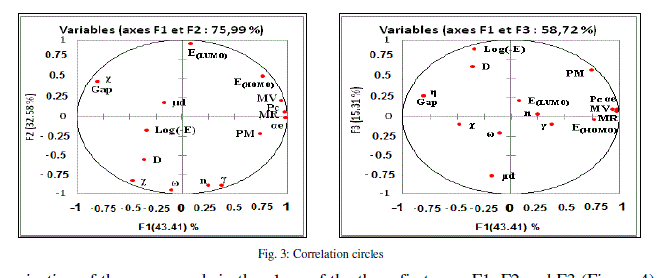
| The totality of the sixteen descriptors (variables) coding the thirteen molecules was submitted to a principal components analysis (PCA). Twelve principal components were obtained. The first three axes F1, F2 and F3 contributing respectively 43.4 %, 32.6 % and 15.3 % to the total variance, the total information is estimated to a percentage of 91.3%, were sufficient to describe the information represented by the data set. Table 3 shows the descriptor's contributions to F1, F2 and F3. The descriptors MR, MV, Pc, ïÃÂáe, EHOMO, Gap and ïÃÂèïÃâ¬Ã have the most significant contributions to F1, the descriptors n, ïÃÂç, ELUMO, ïÃÂã and ïÃÂ÷ have the most significant contributions to F2, and the descriptors PM, D, ïÃÂàand log(-E) have the most significant contributions to F3. |
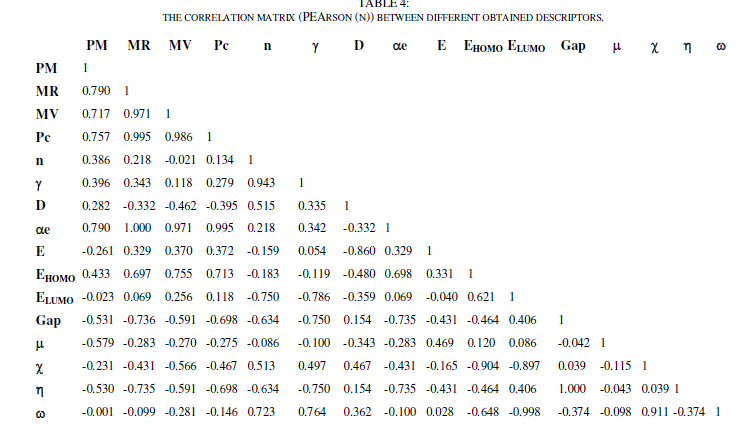 |
| The principal component analysis (PCA) was conducted to identify the link between the different variables. Correlations between the sixteen descriptors are shown in table 4 as a correlation matrix, in figure 3 these descriptors are represented in a correlation circles. |
 |
 |
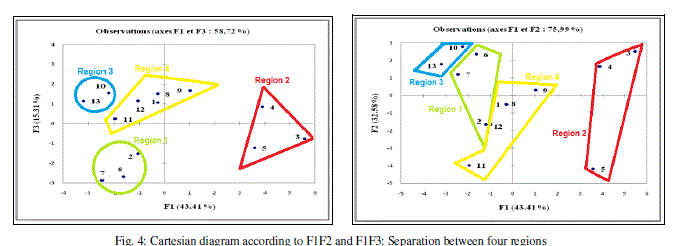
| In the projection of the compounds in the plane of the three first axes F1, F2 and F3 (Figure 4), the compounds are distributed in four regions. Region 1 contains compounds having a values of log (- E) between 4.296 and 4.368, region 2 contains compounds having a values of log (-E) between 4.415 and 4.473, region 3 contains compounds having a values of log (-E) between 4.929 and 4.935 and region 4 contains compounds having a values of log (-E) between 4.940 and 4.953. |
 |
| C. Multiple Linear Regressions MLR |
| In order to propose a mathematical model and to evaluate quantitatively the substituent's physicochemical effects on the two activities of the totality of the set of these 13 molecules, we submitted the data matrix constituted obviously from the 14 physicochemical variables corresponding to the 13 molecules, to a progressive multiple regression analysis. This method used the coefficients R, R2, and the F-values to select the best regression performance. Where R is the correlation coefficient; R² is the coefficient of determination; MSE is the mean squared error; F is the Fisher F-statistic. |
| Treatment with multiple linear regressions is more accurate because it allows you to connect the structural descriptors for each activity of 13 molecules to quantitatively evaluate the effect of substituent. The selected descriptors are: |
| PM, n, ïÃÂàand ïÃÂã for MDAMB-231 ; ïÃÂçïÃâ¬Ã and n for SK-N-SH |
| The QSAR models built using multiple linear regression (MLR) method is represented by the following equation: |
 |
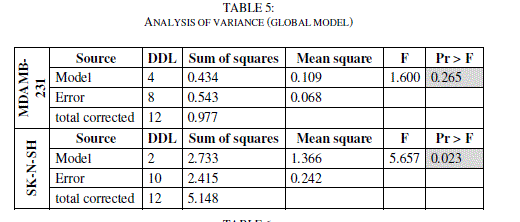
| The Fisher's F test is used. Given the fact that the probability corresponding to the F value is lower than 0.05 for SK-N-SH, it means that we would be taking a lower than 0.28% risk in assuming that the null hypothesis is wrong. Therefore, we can conclude with confidence that the models do bring a significant amount of information. For MDAMB-123, the F value (F value = 0.265) is up than 0.05, the model is not significant. (Tables 5 and 6) |
 |
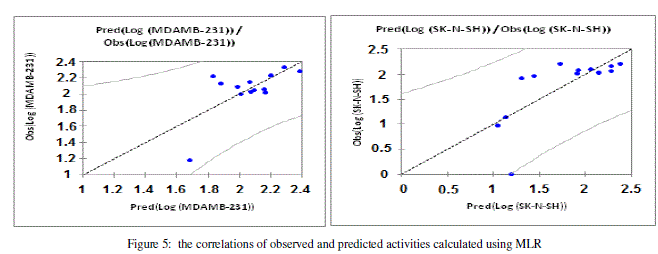
| The values of predicted activities (Log (MDAMB-231) and Log (SK-N-SH) calculated from equations (1and 2), and the observed values are given in table 10. The correlations of predicted and observed are illustrated in figure 5. |
 . . |
| The descriptors proposed in equations (1and 2) by MLR were, therefore, used as the input parameters in the partial least squares (PLS), and the Multiples nonlinear regression (MNLR) and artificial neural network (ANN). |
| D. Partial least squares PLS |
| Partial Least Squares regression (PLS) is an efficient and optimal for a criterion method based on covariance. It is recommended in cases where the number of variables is high, and where it is likely that the explanatory variables are correlated. (http://www.xlstat.com/en/productssolutions/ pls.html). We submitted the data matrix constituted obviously from the descriptors proposed by MLR corresponding to the 13 molecules, to the partial least squares (PLS). This method used the coefficients R, R2, and the F-values to select the best regression performance. The QSAR models built using partial least squares (PLS) method is represented by the following equation: |
 |
| The correlation coefficient (R), the coefficient of determination (R²), the Mean Squared Error (MSE) and Standard deviation (S) for the two models.(Table 7). |
 |
| The values of predicted activities (Log (MDAMB-231) and Log (SK-N-SH)) calculated from equations (3 and 4), and the observed values are given in table 10. The correlations of predicted and observed are illustrated in figure 6. |
 |
| Despite the good results we have obtained by multiple linear regressions and partial least squares (PLS), it is likely that any non-linear relationship took place. Nonlinear regression performed by XLSTAT software and the neural network are suitable concepts to accomplish this task. |
| E. Multiples nonlinear regression (MNLR) |
| We have used also the technique of nonlinear regression model to improve the structure - activity relationship to quantitatively evaluate the effect of substituent. It takes into account several parameters. This is the most common tool for the study of multidimensional data. We have applied to the data matrix constituted obviously from the descriptors proposed by MLR corresponding to the 13 molecules. The coefficients R, R2, and the F-values are used to select the best regression performance. |
 |
 |
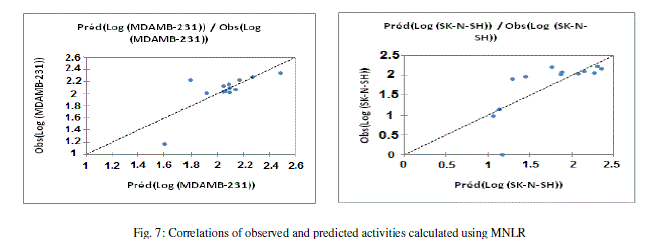
| The values of predicted activities calculated from equations (5and 6), and the observed values are given in table 10. The correlations of predicted and observed are illustrated in figure 7. |
 |
| F. Artificial neural networks (ANN) |
| Neural networks (ANN) can be used to generate predictive models of quantitative structure–activity relationships (QSAR) between a set of molecular descriptors obtained from the MLR and observed activity. |
| The correlations coefficients and Standard Error of Estimate, obtained with the Neural network (Table 9), show that the selected descriptors by MLR are pertinent and that the model proposed to predict activity is relevant. |
 |
| The values of predicted activities and the observed values are given in table 10. |
| The obtained squared correlation coefficient (R2) value confirms that the neural network result were the best to build the quantitative structure activity relationship models. |
| In this part, we investigated the best linear QSAR regression equations established in this study. Based on this result, a comparison of the quality of ACP, MLR, PLS, MNLR and ANN models shows that the ANN models have substantially better predictive capability because the ANN approach gives better results than MLR, PLS and MNLR. ANN was able to establish a satisfactory relationship between the molecular descriptors and the activity of the studied compounds. |
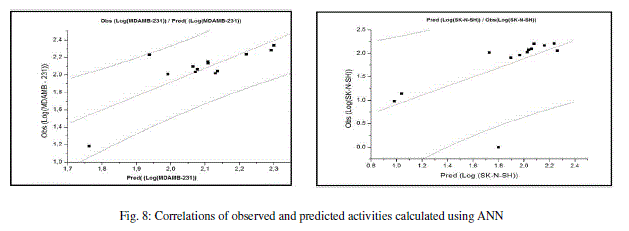
| The values of predicted activities calculated using ANN and the observed values are given in table 10. The correlations of predicted and observed are illustrated in figure 8. |
 |
 |
 |
IV. CONCLUSION |
| In this work we have investigated the QSAR regression to predict toxicity of several compounds based on imidazo[1,2-a]pyrazine derivatives. |
| Comparison of key statistical terms like R or R2 of different models obtained by using different statistical tools and different descriptors has been shown in table 10. |
| The studies of the quality of the MLR, PLS, RNLM and ANN models have shown that: |
| The PLS method gave low coefficients of determination (R2), thus it was had no efficiency in predicting the values of activities. |
| The nonlinear regression and the neural network ANN results have substantially better predictive capability than the other methods. |
| With ANN approach, we have established a relationship between several descriptors and inhibition values (IC50) of Imidazo[1,2-a]pyrazines on human tumor cell lines (Log (MDAMB-231) and Log (SK-N-SH)) in satisfactory manners. |
| Finally, we can conclude that studied descriptors, which are sufficiently rich in chemical, electronic and topological information to encode the structural feature may be used with other descriptors for the development of predictive QSAR models. |
ACKNOWLEDGMENT |
| We are grateful to the “Association Marocaine des Chimistes Théoriciens” (AMCT) for its pertinent help concerning the programs |
References |
|