Research & Reviews: Journal of Chemistry
e-ISSN: 2319-9849
e-ISSN: 2319-9849
1Laboratory of Polymers and Fibers, Department of Chemistry, Ravenshaw University, Cuttack, Odisha, India
2Department of Chemistry, Shailabala Women’s College, Cuttack, Odisha, India
Received date: 03/06/2017 Accepted date: 29/06/2017 Published date: 30/06/2017
Visit for more related articles at Research & Reviews: Journal of Chemistry
Keeping in view the demand of polymeric material a number of highly cross-linked thermally stable IPNs have been synthesized by condensing glycerol modified soybean oil polyurethanes and Cardanol based dye with amino benzoic acids. Thus, the polymer produced is characterised to know the properties, structure, stability and kinetic parameters like activation energy and order of reactions have been calculated by Freeman Anderson Method. Thermal stability of IPNs was determined by TGA, DSC and WAXRD study
Cardanol, IPNs (Inter Penetrating Polymer Network), Polyurethane, Soybean oil
In the 21st Century, bio-based synthetic polymers are a potential substitute for petroleum based polymers. To reduce the consumption of petrochemicals it is essential to synthesize polymers such as polymer networks from natural resources such as cardanol and soybean oil. These plant products are not only cheaper but also easily available in different parts of India. Cardanol is a by-product of cashew industry and soybean is a natural vegetable oil. IPNs synthesis was initiated by Sperling and co-workers who published a number of papers [1-5]. In this article, a comparative study of different IPNs with regard to their thermal behavior from TGA [6-8] and DSC are reported. IPNs have both the characteristics of crystalline and amorphous is known from wide angle x-ray diffraction [9-12] study.
Materials
Refined soybean oil was obtained from market. Cardanol was obtained from fractional distillation of CNSL liquid, a byproduct of Sathya Cashew Chemical PVT. Ltd., Chennai. NaOH, MEK, EGDM, NaNO2, HCl, PbO, etc. Received from M/S BDH. Ltd. (India) TDI, DPMDI, 3-amino benzoic acid and 4-amino benzoic acid from E merk (Germany). All chemicals were used as received.
Spectroscopic analysis: FTIR (Fourier transform infrared): FTIR spectra of the prepared IPNs samples have been recorded on FTIR Spectrometer by Thermo Electric Corporation, USA, and Model: Nicolet 670 FT-IR using KBr pallete in the wavelength range of 500 cm-1 to 4000 cm-1.
Thermal Analysis-DSC and TGA: of all IPNs have been performed by use of a Universal v4.5A.TA instrument (Model SDT Q 600 V20.9 Build 20) at a rate of 10°C/minute.
Morphology study (SEM): Morphology of samples has been studied by JOEL scanning electron microscope (SEM) Model JSM 500. For this the fractured samples have been coated with a thin layer of gold- platinum alloy by sputtering to provide conductive surface.
Element detection: IPNs are heated for 30 seconds in different scale count and the percentage of carbon, Nitrogen and oxygen atoms are given in graph.
Study of Crystallinity- wide angle X-ray diffraction study (WAXRD): X-ray diffraction pattern of polymer samples have been collected using a panalytical x’pert pro Θ/ Θ goniometer with Cu - Kα radiation.
Test for biodegradability: The environmental resistance of the IPNs samples was carried out using soil burial test.
Experimental
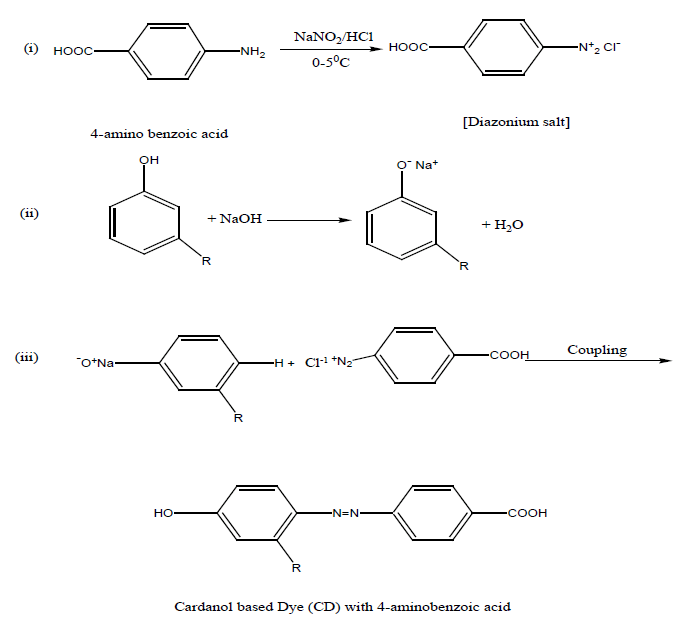
Preparation of dye monomer: 6.85 grm of 4- amino benzoic acid was dissolved in 25 ml of conc. HCl acid and 25 ml of water was added to it. The solution was cooled 0°-5°C, and then a cold solution of sodium nitrite (4gm in 20 ml of water) was added to it slowly with stirring for 3-4 minutes. A cold solution of cardanol (15 g in 45 ml) of 10% NaOH solution was prepared. Then cold diazonium solution was added slowly to the alkaline cardanol solution with stirring. A brown colour semi liquid dye was formed. The dye was separated by a separating funnel.
Preparation of Mixed Ester Polyol (MEP) from Soybean Oil (SO): Refined soybean oil (350 ml) was heated at 250°C in an inert Nitrogen atmosphere taken in three naked flasks fitted with a thermometer reflux condensers and a stirrer. At this temperature litherage (0.168 g) and glycol (80 ml) were added to the reaction mixture with constant stirring. The temperature was maintained at 210°C until one volume of reaction mixture gave a clear solution in same volume methanol. At this stage, the contents were cooled to obtain MEP.
Synthesis of Polyurethane (PU): 1 mole of MEP was added to 1.6 mole of TDI to maintain NCO/OH ratio at 1.6.The reaction was carried out at 75°C with continuous stirring for one hour until a pale yellow colour PU is separated out. The same process was repeated with different NCO/OH ratio (1.2, 1.6, and 2.0) and with other di-isocyanate DPMDI PUs was produced as shown in the feed composition Table 1.
| Sample Code | DI used | Name of the oil used | NCO/OH ratio | CBD (cardanol based dye) | Contents of P.U. | Contents of dye monometer wt% |
|---|---|---|---|---|---|---|
| IPN 14 | TDI | Soybean Oil | 1.6(2.78/3.54) | 4-amino benzoic acid | 0.35 | 0.65 |
| IPN 24 | DPMDI | Soybean Oil | 2.0(3.78/3.54) | 3-amino benzoic acid | 0.50 | 0.50 |
| IPN 27 | DPMDL | Soybean Oil | 2.0(3.48/3.54) | 3-amino benzoic acid | 0.50 | 0.50 |
Table 1. Data on Feed Composition of IPNs.
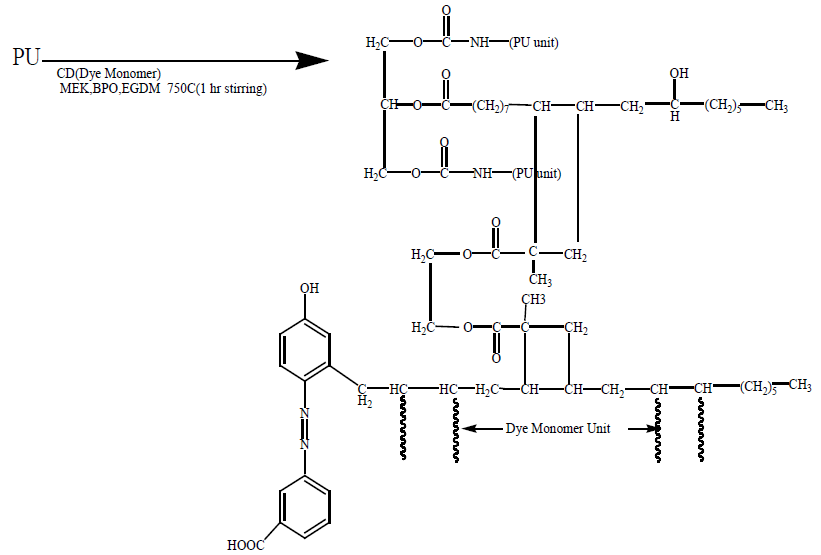
Synthesis of IPNs: The mixture of PU and diazotised cardanol (with different PU/monomer ratio i.e., (75:25, 50:50, 65:35) and solvent (MEK) were taken in small beaker. Then 5 ml of 10% EGDM along with 20 mg of Benzoyl peroxide (BPO) were added to each mixture. The total mixture was stirred for 15 minutes with magnetic stirrer in cold to obtain a homogenous solution. Then, the temperature was raised to 75°C and stirred until a thick solution was formed. Then the viscous mass was poured into a petri dish in hot condition and kept in an oven at 75°C for 24 hour.
The thin film thus obtained was cooled and removed from the petri dish with a sharp blade and sent for characterization to the Central Instrumentation Facility Pondicherry University, Puducherry as shown in schemes 1-4 Soybeanoil (SO):

Scheme-1 Triglyceride of linoleic (53%), oleic acid (18%) and linoleic acid (15%)

Scheme 2 Same procedure was followed for Polyurathane of Toluene-2,4-diisocyanate with Soybean oil and dye with 3-aminobenzoicacid and Cardanol.

Scheme 3. Same procedure was followed for Polyurathane of Toluene-2,4-diisocyanate with Soybean oil and dye with 3-aminobenzoicacid and Cardanol.

Scheme 4. Interpenetrating Polymer Network from Natural Resources.

This reaction was carried out at 45°C with 1 hr constant stirring.
TDI (Toluene-2,4-diisocyanate)
Same procedure was followed for Polyurathane of Toluene-2,4-diisocyanate with Soybean oil and dye with 3-aminobenzoicacid and Cardanol.
Analysis of the Sample
FTIR: The FTIR spectra of the IPNs 14, 24 and 27 are presented in Figure 1a-1c

Figure 1a. FTIR OF IPN-14.

Figure 1b. FTIR OF IPN-24.

Figure 1c. FTIR OF IPN-27.
The presence of component materials in the macromolecules was confirmed by the study of FT-IR spectra if the prepared samples.
FTIR OF IPN 14: The characteristic absorption of IPN-14 corresponding to IPN-14 to N-H stretching of >NH group at 3456.9 cm−1, C-H stretching (ss/as) of >CH2 and > CH3 groups at 2925.4 cm−1 and 2856.5 cm−1,- N≡C stretching of -N=C=O group for the isocyanates at 2354.0 cm−1 and 2546.0 cm−1, C=O stretching of urethane linkage at 1691.5 cm−1 , -N=N stretching of azo group at 1596.3 cm−1, -N=N stretching of aromatic rings at 1542.4 cm−1, C=C stretching at 1393.2 cm−1 , C=C stretching of aromatic rings at 1244.8 cm−1, C-O stretching of ester at 1166.6 cm−1, out of plane C-H bending at 784.4 cm−1 and out of plane C-C bending of p-substituted benzene ring at 695.2 cm−1 and 543.1 cm−1.
FTIR OF IPN 24: The characteristic absorption of IPN-24 corresponding to IPN-24 to -OH stretching of >OH groups shifted to lower value by hydrogen bonding at 3590.8 and 3452.4 cm−1. The characteristic absorption of IPN-12 corresponding to IPN-12 to N-H stretching of >NH group at 3349.2 cm−1, C-H stretching (ss/as) of > CH2 and > CH3 groups at 2921.1 cm−1 and 2861.8 cm−1,- N≡C stretching of -N=C=O group for the isocyanides at 2771.5 cm−1, 2619.9 cm−1, 2365.4 cm−1, C=O stretching of urethane linkage at 1984.0 cm−1 ,-OH bending due to –COOH group at 1306.7 cm−1 , -N=N stretching of azo group at 1605.5 cm−1, C-O bending at 1154.8 cm−1, C-C stretching of aromatic rings at 1399.7 cm−1, C=C stretching of aromatic rings at 1518.6 cm−1, C-O stretching of ester at 1160.7 cm−1, out of plane C-H bending at 811 cm−1 and out of plane C-C bending of p-substituted benzene ring at 634 cm−1 and 481 cm−1.
FTIR of IPN 27: The presence of component materials in the macromolecules was confirmed by the study of FT-IR spectra if the prepared samples. The characteristic absorption of IPN-27 corresponding to IPN-27 to O-H stretching of >OH groups shifted to lower value by hydrogen bonding at 3858.6 cm−1. The characteristic absorption of IPN-27 corresponding to IPN-27 to N-H stretching of >NH group at 3444.5 cm−1, C-H stretching (ss/as) of >CH2 and >CH3 groups at 2861.9 cm−1 and 2747.9 cm−1, N≡C stretching of -N=C=O group for the isocyanate terminating PU unit at 2319.9 cm−1 , C=O stretching of urethane linkage at 1660.3b cm−1 , N=N stretching of azo group at 1547.6 cm−1, C-O bending at 1029.3 cm−1, C-C stretching of aromatic rings at 1398.8 cm−1, out of plane C-H bending at 806.6 cm−1 and out of plane C-C bending at 691.8 cm−1 and 551.6 cm−1.
From the above Figure 1a-1c correlation with the peak of the authentic compound helps to identify the polymer sample. Thus it is concluded that the polymer sample contains azo based compound which contain –COOH, -OH, -CH2 , -CH3 ,C=O,N=N, -C-O-C stretching of –OCH3 group and benzene rings
Thermogravimetric Analysis (TGA): Thermogravimetric analysis of Polymer samples was carried out as a function of weight loss versus temperature as shown in Figures 2a-2c.

Figure 2a. DSC-TGA OF IPN-14.

Figure 2a. i) Freeman-Anderson Plot of IPN 14.

Figure 2a. ii) Freeman-Anderson Plot of IPN 14.

Figure 2b. DSC-TGA OF IPN-24.

Figure 2b. i) Freeman-Anderson Plot of IPN 24.

Figure 2b. ii) Freeman-Anderson Plot of IPN 24.

Figure 2c. DSC-TGA OF IPN-27.

Figure 2c. i) Freeman-Anderson Plot of IPN 27.

Figure 2c. ii) Freeman-Anderson Plot of IPN 27.
Thermal stability of the polymer sample (IPN) was determined at a rate of 10°C /min from room temperature to 700°C again is cooled from 700°C to room temperature. The percentage of mass left with the temperature was recorded.
The degradation occurred in various forms as dehydration, demethylation, decarboxylation, decrosslinking and chain scissors.
Thermo grams of IPNs Figure 2a-2c depicts four to five steps of decomposition, i.e., from 100°C to 700°C. In step-I dehydration at 170°C, then decarboxylation and demethylation occurs. In step II, degradation of side chain attached to the aromatic nucleus occurs then ring stripping found when maximum weight is lost (450°C) is shown in Table 2.
| Sample Code | To | Tmax | Tf | % of CY |
|---|---|---|---|---|
| IPN14 | 49.2 | 250.42 | 453.2 | 9.01 |
| IPN24 | 62.1 | 275.3 | 465.1 | 12.2 |
| IPN27 | 48.2 | 278.12 | 455.1 | 17.8 |
Table 2. DSC parameter.
Kinetics: From TGA the kinetics of the reaction is determined by Freeman Anderson Equation and Activation Energy was calculated in Tables 3-5.
| Sample Codes | Temperature Range | Slope or Order of reaction | Activation Energy | Intercept |
|---|---|---|---|---|
| IPN14 | 180-300°C | 7.7004 | −506.3537 | 0.2649 |
| 300-580°C | −2.9846 | −722.16092 | 0.3778 | |
| IPN 24 | 140-300 | 1.1974 | 4682.3859 | −2.4496 |
| 300-520 | −0.6507 | 132.275108 | −0.0692 | |
| IPN27 | 140-300 | 0.2134 | 191.149 | −0.1 |
| 320-660 | −1.8942 | −691.19478 | 0.3616 |
Table 3. The kinetics of the reaction is determined by Freeman Anderson Equation and Activation Energy.
| Sl No. | Sample Code | 100°C | 200°C | 300°C | 400°C | 500°C | 600°C | 700°C |
|---|---|---|---|---|---|---|---|---|
| 1 | IPN14 | 98.18 | 92.88 | 70.94 | 54.78 | 30.05 | 28.34 | 27.76 |
| 2 | IPN 24 | 98.58 | 94.48 | 82.6 | 63.09 | 11.44 | 9.61 | 9.12 |
| 3 | IPN 27 | 98.4 | 93 | 76.4 | 57.6 | 21.9 | 17.8 | 17.8 |
Table 4. Percentage of Residual Mass Left with Temperature.
| S. No. | Sample Code | Composition | NCO/OH | PU/CD | Tg | Tc | Tm |
|---|---|---|---|---|---|---|---|
| 1 | IPN14 | 4-A.B.A+TDI | 1.6 | 35:65 | 172.1 | 231.85 | 446.25 |
| 414.89 | |||||||
| 2 | IPN24 | 3-A.B.A+TDI | 1.6 | 50:50 | 195.02 | 310.05 | 472.25 |
| 437.03 | |||||||
| 3 | IPN27 | 3-A.B.A+DPMDI | 2.0 | 50:50 | 175.5 | 307.02 | 472.3 |
Table 5. Sample-wise Tg, Tc and Tm
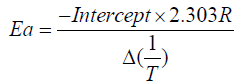
The thermal degradation of polymers is a complex process. Activation Energy and order of the reaction at different temperature range is determined by Freeman- Anderson Method.
Freeman- Anderson Method:
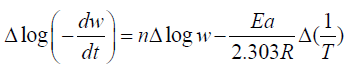
Where n= order of reaction
Ea= Activation Energy
These values are determined from the plot of 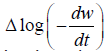 vs. The slope gives us order of reaction n and intercept is related
to activation energy (Ea) which is given by Ea which is given by
vs. The slope gives us order of reaction n and intercept is related
to activation energy (Ea) which is given by Ea which is given by
Higher the order of activation energy the polymer is relatively more stable and more cross-linked that is IPN 24 is more stable than 14 and 27. IPN 24 and 27 are more stable than IPN 14 from DSC parameter that is in Table 2.
D.Sc. (Differential scanning calorimetry)
In this instrument heat capacity of a sample is measured as the function of differential heat flow rate between the sample and reference material. The instrument directly gives a recording of heat flow rate against temperature.
Wide angle X-ray diffraction (WAXRD)
This is a very good technique to analyses a polymer sample to know the percentage of crystallinity. It is a non-destructive method of characterization of solid polymers. The samples have been scanned in a wide angle X ray goniometer and the scattering intensity is plotted as a function of 2Θ angle (2θ is larger than 5°) as shown in Figure 3 and Table 6.

Figure 3. Kinetic parameters of different IPNs.
| Line Element Line | Net Counts | Net Counts Error | Weight % | Atom % | Formula |
|---|---|---|---|---|---|
| C K | 549 | +/- 40 | 81.82 | 85.70 | C |
| N K | 0 | +/- 11 | 0.00 | 0.00 | N |
| O K | 74 | +/- 15 | 18.18 | 14.30 | O |
| Total | 100.00 | 100.00 |
Table 6. Kinetic parameters of different IPNs (Figures 3 and 4).
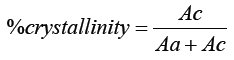
Ac= Area under the crystalline region
Aa= Area under the amorphous region
Element detection:
IPNs are heated for 30 seconds in different scale count and the percentages of Carbon, Nitrogen and Oxygen atoms are given in graphs named Figures 4a, 4b,4c and Table 7a,7b, 7c respectively.
| Element Line | Net Counts | Net Counts Error | Weight % | Atom % | Formula |
|---|---|---|---|---|---|
| C K | 549 | ± 40 | 81.82 | 85.70 | C |
| N K | 0 | ± 11 | 0.00 | 0.00 | N |
| O K | 74 | ± 15 | 18.18 | 14.30 | O |
| Total | 100.00 | 100.00 |
Quantitative Results Base
Table 7a. for Element Detection of IPN 27.
| Element Line | Net Counts | Net Counts Error | Weight % | Atom % | Formula | |
|---|---|---|---|---|---|---|
| C K | 681 | ± | 45 | 77.61 | 82.19 | C |
| N K | 0 | ± | 14 | 0.00 | 0.00 | N |
| O K | 133 | ± | 16 | 22.39 | 17.81 | O |
| Total | 100.00 | 100.00 | ||||
Quantitative Results Base(2)
Table 7b. for Element Detection of IPN 27.
| Element Line | Net Counts | Net Counts Error | Weight % | Atom % | Formula |
|---|---|---|---|---|---|
| C K | 649 | ±45 | 81.52 | 85.46 | C |
| N K | 0 | ±15 | 0.00 | 0.00 | N |
| O K | 91 | ±17 | 18.48 | 14.54 | O |
| TOTAL | 100.00 | 100.00 |
Quantitative Results Base(3)
Table 7c. for Element Detection of IPN 27.

Figure 4a. Element Detection of IPN 27.

Figure 4b. Element Detection of IPN 27.

Figure 4c. Element Detection of IPN 27.
SEM Studies :
The morphology of the sample of IPN 27 shown in Figures 5a, 5b, 5c and 5d which gives the percentage of crystallinity and amorphous nature of IPN 27. It helps to know the extent of interpenetration, phase mixing and morphology of the IPN 27.

Figure 5a. SEM Morphology OF IPN 27.

Figure 5b. SEM Morphology of IPN 27.

Figure 5c. SEM Morphology OF IPN 27

Figure 5d. SEM Morphology OF IPN 27
IPN 27 is a mixture of amorphous and crystalline substances and has a unique pattern of despacing which is the fingerprint of that sample. It is more crystalline as that PU content is more and it contains 3 elements C, N and O.
From this article author concluded that the Synthetic Polymer so produced is an agricultural product which can be used in place of petroleum based polymer. As the IPNs highly stable at high temperature and mechanically stronger it can be used as adhesives, paints, brake lining, varnishes, Laminations, antioxidants etc.