ISSN ONLINE(2319-8753)PRINT(2347-6710)
ISSN ONLINE(2319-8753)PRINT(2347-6710)
| Veera Amudhan R Assistant Professor, Department of Mechatronics, Bharath University, Chennai – 600073, India |
| Related article at Pubmed, Scholar Google |
Visit for more related articles at International Journal of Innovative Research in Science, Engineering and Technology
Tracking the movement of people in indoor environments is useful for a variety of applications including elderly care, study of shopper behavior in shopping centers, security etc. There have been several previous efforts at solving this problem but with limited success. Our approach uses inexpensive pressure sensors, placed in a specific manner that allows us to identify multiple people. Given this information, our algorithm can track multiple people across the floor even in the presence of large sensor error. The algorithm we develop is evaluated for a variety of different movement patterns that include turning and path crossing. The error in correct path detection is shown to be very small even in the most complex movement scenario. We note that our algorithm does not use any a priori information such as weight, RFID tags, knowledge of number of people, etc.
INTRODUCTION |
| The problem of tracking people in indoor spaces is an important component for a variety of applications including inhome care for disabled or seniors, etc. Traditional approaches to this problem include using multiple cameras, sound/vibration sensors, and RFID tags or other radio devices planted somewhere on the clothing. The problem with the latter solutions is that they lack generality while the camera solution tends to be expensive both in computation as well as cost. The solutions that have been implemented using sound/vibration require special raised floors for implementation and even with that requirement, they often display a significant lack of accuracy as well as inability to track multiple people. In this research we develop an algorithm for tracking multiple people simultaneously using simple pressure sensors that can be embedded in carpets or floor tiles. The algorithm can track people even when they are shoulder to shoulder and in the presence of arbitrary turns and path crossings. |
| The remainder of the paper is organized as follows. We discuss the sensor used as well as its sensing capability in section 2. We also characterize the error in locationing as measured for this sensor. In section 3 we examine the problem of sensor placement with the goal of low cost and high accuracy. Section 4 then presents our tracking algorithm. The tracking algorithm is studied in section 5. Related work is discussed in section 6 and conclusions are in section 7. |
II.SENSOR DESCRIPTION |
| The sensors we use are inexpensive Flexiforce pressure sensors. They are as thin as a piece of paper (0.127mm) so that people cannot feel the existence of the sensor when they walk on the tile. The maximum sensing range is 454kg. Other specifications are [10]: length 203mm, width 14mm, sensing area 9.53mm, connector 3-pin Male. In use, we place these sensors directly underneath flooring tiles. The readings from multiple sensors (up to 8) are simultaneously fed into a standard serial port. |
 |
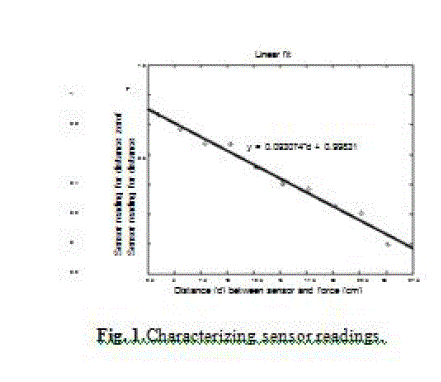
| To understand how the sensors react to force applied to the tile as well as the locationing error which comes about due to absorption by the tile (by flexing) and we characterize how sensor readings relate to the distance between the point on the tile where the force is applied and the location of the sensor underneath the tile. We place a sensor under a corner of a 20cmïÿýïÿýïÿýïÿý 20cm tile and applied force at various points on the tile. We obtain the sensor readings si for distance di. We also apply the same force on the tile directly on top of the sensor giving us reading s0. Figure 1 plots s0/si as a function of di. As we can see, there is a good linear fit between these quantities and the linear equation gives us the needed expression for interpreting the sensor readings. |
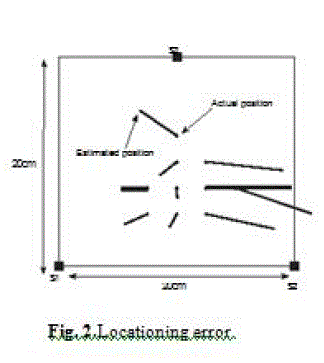
| We next place three sensors underneath the tile as shown in Figure 2. The goal here is to determine the position of an applied force without prior knowledge of the s0 value. The unknowns therefore are s0 and dj (j = 1, 2, 3 for the three sensors). The measured values are sj and we know the relative location of the three sensors. We can thus solve for the dj values to determine where on the tile the force is applied. In the figure, we indicate by a 'o' the actual location of the force for each of the ten values shown and by a straight line the error between the actual position and the estimated position (the other endpoint of each line gives us the estimated position using sensor readings). The average error is 3.8cm though in some cases it is significantly more. Given that the tile is 20cmïÿýïÿýïÿýïÿý 20cm, we can estimate the error asïÃÂð1.52/64 or approximately 12%. |
III.SENSOR PLACEMENT |
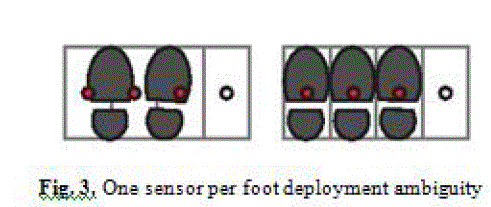
| Consider a high enough density of sensor deployment such that mïÿýïÿýïÃâó 1 sensors will be stepped upon by each foot. This gives us an accurate estimate of the foot's location but is very expensive. Let us consider an alternative technique which loses some accuracy but has a significantly reduced cost. We cover the floor with tiles of the size equal to an average foot step and place one sensor under each tile. Thus, when a foot is placed fully on or even partially on a tile, all the sensors under the tile sense some pressure. However, if there are two feet on the same tile, we have an ambiguous result as shown in Figure 3 since the data can be interpreted to mean that there are either three feet on three diferent tiles or two meet each of which overlaps two tiles. This ambiguity causes tracking error. Our goal is to be able to locate the foot step of each person while minimizing the total cost. There are a very large number of possible sensor/tile placements. However, these placements need to satisfy two requirements: first, the placements should ensure that at least one sensor senses each foot step otherwise we may fail to identify all foot steps of a person; and second, no more than one foot should step on each tile at any given time in order to ensure that we can distinguish between diferent foot steps. |
 |
| set of possible sensor/tile placements can be divided into two - tiling that covers the floor completely or tiling that leaves gaps. We observed that the latter placements typically gave us far lower cost. In addition, these types of placements tend to reduce ambiguity where one foot can step on multiple tiles simultaneously. However, we need to be careful about how the tiles and sensors are placed so that we meet the two requirements mentioned previously. |
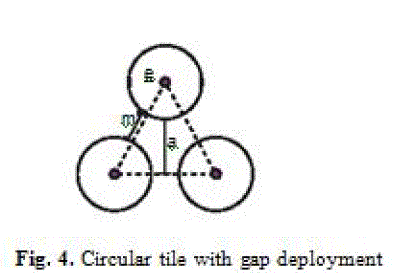
| Based on an evaluation of several placements, we came up with the deployment shown |
| in Figure 4 with 3 sensors per tile. Assume that there is a minimum distance between two people. Thus, if is greater than the foot size, the possibility of two people stepping on three consecutive tiles as in Figure 3 will not happen. Let us assume that the foot step size is lïÿýïÿýïÿýïÿý m, where l is the length and m is the width of an average foot. We choose the diameter of the circular tile to equal because it can ensure that no two or more steps on the same tile belong to diferent people. Tiles are placed distance m apart which ensures that we will not miss any foot step. To ensure that at least one sensor senses every step, we require aïÿýïÿýïÃâã l as shown in Figure 4. Let mïÿýïÿýïÃâû 0.5l and a = .5ïÿýïÿýïÃâ¬Ã (sin 60ïÿýïÿýïÿýïÿý( + m)). Therefore,< 1.5l.This means that has to be less than one and a half foot length, which is reasonable. |
IV.TRACKING ALGORITHM: SLIDING WINDOW LMS |
| Assume that the locationing algorithms discussed previously give us foot locations for one or more people, with some error. The problem then is to track people as they move around the sensed area. We make no assumptions about how the people move except that physically impossible cases (such as one person walking through another) do not occur. We initially considered a simple algorithm which finds a straight line fit using a least mean square error metric. Unfortunately, in many cases, this algorithm has an unacceptably high error where it combines foot locations belonging to diferent people. Therefore, we enhanced the algorithm by using more information such as step length to distinguish between diferent people. It performs much better but it fails when we have crossing paths and turns. This led to the sliding window algorithm that explicitly finds turns in paths. |
| The algorithm is based on the assumption that a person's path consists of straight line paths and turns alternating with each other. Therefore, finding where the turns occur and fitting multiple straight lines to the provided foot locations gives us a good estimate of the paths. The algorithm is divided into two parts: an initialization stage and then an iterative stage. |
| The initialization stage considers the first three step locations of n people. Let p1, p2 and p3 be the first three consecutive points andïÃÂú be the default average step length. |
| Let e(pi, pj) be a function of the distance from pi to pj and d(pi, pj, pk) be a function of the shortest distance from point pj to straight line pi and pk. The error of each three points is d(p1, p2, p3) +ïÿýïÿýïÿýïÿýïÃÂúïÿýïÿýïÃâ¬Ã e(p1, p2)ïÿýïÿý +ïÿýïÿýïÿýïÿýïÃÂúïÿýïÿýïÃâ¬Ã e(p2, p3)ïÿýïÿý. |
| Consider all the possible three tuples consisting of the first, second, third steps. For each collection of n such tuples, we compute the sum of the least mean square error. Then the combination with the smallest error represents the first three steps of n people. |
| In the iterative stage, there are two important parts. The first part is to distinguish each point in the new set of points belonging to each path. The second part is to determine if the new point is a turning point for each path. To achieve the first part, we extend the straight line formed from the initial stage by adding one more point (i.e., the fourth point). This is because people mostly walk in one direction (i.e., turns are infrequent). There are n points and n lines. For each person, the average step length is stored and updated in every iteration. It's initial value isïÃÂú and it's value is re-calculated using d(p1,p2)+d(p2,p3) , which gives us an increasingly accurate estimate 2 of step length as more data is collected. We take the combination of one line and one point and compute the error of fitting all the points to the line and the error of the average step length. Then, we calculate the sum of the mean square for all n people and we pick the combination that yields the lowest error. |
| In the second part of the iterative stage, we create a window per person (path) and only consider points that lie within a variable window. The window expands whenever a new point is added. However, it will slide and reduce in size when the tracking algorithm determines that the person has turned. To understand the workings of this algorithm, it is useful to model a person's path as either being one where the person is walking in a straight line or the person is making a turn. The initial state for the algorithm starts with the assumption that the person is walking in a straight line. When in this state, the window expands by adding new points and adapting the paths. However, when a turn is detected, the window shrinks to 3 points only and then starts to grow again by adding additional points if the person is detected to be walking in a straight line otherwise it keeps sliding while maintaining a size 3. |
| Detecting turns works as follows. When people walk, their left and right feet hit the floor alternatively. This information is used by the algorithm to determine when a person turns. The key idea here is illustrated in Figure 5 where we see seven points corresponding to the path followed by one person (the points correspond to the left foot then the right then the left and so on). Let us look at points 1, 2, 3 first. Point 4 lies within the angle formed by the line segments connecting points 1-2 and 1-3. Therefore, point 4 does not represent a turn. Likewise, to determine whether point 5 represents a turn, we look at the angle formed between segments 2-3 and 2-4. Again, we see that point 5 lies well within this angular region. Consider point 6 now. We see that point 6 lies outside the angle formed by 3-4 and 4-5 and thus it represents a turning point. Until this point our window contained all the points from 1 to 5. However, after the turn is detected, we shrink it to points 4, 5, 6 only. Next we look at point 7. Since it lies within the angular region formed by segments 4-5 and 4-6, we conclude that the person is walking in a straight line again and the window grows to include points 4,5,6,7. |
 |
V.SIMULATION RESULTS |
| In order to evaluate the tracking algorithm, we developed a test case generator which gen- erates diferent topological test cases corresponding to varying numbers of people, location errors, etc. The output files contain a set of points in continuous time. In order to generate realistic test cases, we rely on a study of the walking behavior of people. [9] provides us the relationship between height and stride length Heightïÿýïÿýïÿýïÿý x = stridelength where xïÿýïÿýïÃâû 0.4. If we assume that the average height is 168cm, we get a stride length of 67cm. |
5. 1 Experimental Design |
| In order to evaluate delete our tracking algorithm, we designed an extensive set of exper- iments that gave us a total of 180 distinct test cases and each test case was repeated ten times. The variable parameters we use are |
| - Number of people: this number is varied from 2 to 5. |
| - Location error: this corresponds to error in determining the exact foot position and takes values 0%, 10%, 20%, 30% and 40%. Recall that we measured the locationing error to be approximately 12% (section 2). The erroneous location is generated as follows. The test case generator first generates the actual foot position. We then generate a uniform random angle between 0 and 2ïÃÂð and a random length equal to the error percentage times the average foot length. This position is the location fed to the tracking algorithm. |
| - Phase: people are either all in phase or out-of-phase (in-phase means they start with the same foot). For three or more people, each individual is out of phase with respect to the two on either side when we consider out-of-phase experiments. |
| - Direction: for two people, there are two cases (same direction or opposite direction). For three or more, we consider the cases when either all the people are going in the same direction or when the directions alternate. |
| - Path shape: We consider straight line with zero or one turn per person. For two people we consider all the cases (i.e., turns with the same or diferent direction). However, for three or more people, we consider only a subset of cases because more complicated cases can be reduced to a union of cases with two people. |
| - Crossings: We consider cases when straight line paths cross or turning paths cross. For two people we consider straight lines crossing at diferent crossing points as well as crossing with turns, again at diferent crossing points. We also consider a case when the two people turn but do not cross each other. |
| Tables 2,3 list some of the various test cases we study. In the case of two people, we consider all the possible combinations of turning, crossing, direction, and phase. In (a) the two individuals are in-phase but they are out-ofphase in (b). (d) and (e) correspond to crossings at two diferent times. (h) is interesting because it includes turning and crossing at the same time. Finally, cases (i) and (j) are challenging because it is easy for the tracking algorithms to think that the two paths cross each other. |
| For three people (Table 3) there are lot more combinations possible. However, many of them are simple extensions of the two person cases, which we ignore. Cases (i), (j), (k), (n) correspond to crossings involving all three paths. Cases (g), (h) , (m) have two people turning without crossing paths. These cases are interesting when there is high error in location which can cause all three paths to be mis-interpreted. The case with five people (Table 3) (o) (p) contains even more complicated crossings and turns that enable us to better understand the performance of our algorithms. |
| In Tables 2,3 we indicate the performance of the algorithms using an accuracy metric defined as follows. For a given test case, we count the total number of points. We then find the number of points that are assigned to incorrect paths by the algorithm. The ratio of this value expressed as a percentage gives us a measure of the accuracy of the algorithm. Thus a value of 0 in the tables means a 100% accuracy whereas a value of 9 in the table means that 91% of the points were correctly assigned. In the tables, we have five values that correspond to the five error values of 0%,10%,20%,30% and 40% in locationing respectively. |
5. 2 Two person case |
| Let us first consider the three cases when two people walk in a straight line. The first case is when the two people walk in the same direction in phase (i.e., start with the same leg). The second case is same as the first one but the two people are out of phase, i.e., two people start walking with diferent legs. The last case is when the two people walk in opposite directions. As Table 2 shows, the out-of-phase case has a lower accuracy as compared with the in-phase case. The accuracy is afected somewhat by the error in foot position but the efect is quite small. As we would expect, accuracy is higher when the two people walk towards each other since there is little possibility of confusing the foot positions. |
| Let us now consider the case when paths cross. If two paths cross at diferent times for the two individuals, then the problem of identifying the paths correctly is trivial. This case is illustrated in Figure 6 where A and B's paths cross but at very diferent times. On the other hand, consider the situation shown in Figure 7 where we see two people crossing each other almost simultaneously. In the figure, A crosses B's path at time unitstA : 3, 4 while B crosses at time unitstB : 1, 2. We define this case as a crossing occurring at (3, 1) where we pick the earliest times for A and B when their paths cross. In order to study how the algorithms performed, we varied tB over a range of times. For each topology design, we also applied location estimation error ranging from 0% to 40%. |
| Figure 7 shows the result of crossing attA : 3, 4 and from tB : 1, 2 to tB : 6, 7 with error between 0%ïÿýïÿý∼ 40%. For our algorithm, if the crossing points tA and tB difer by at least three then the algorithm will track the people correctly. In other words, A crosses attA : j, k, |
 |
 |
5. 3 More than two people |
| Looking at Table 3 (d), (e), (i), (j), (n) we have diferent crossing scenarios. In general, our algorithm has very high accuracy. The only interesting case where it has some inaccuracy is (n). The reason for this is that the angle of incidence in the paths of the the bottom two people is very acute and thus the algorithm sometimes (for high location error) confuses the paths. We see similar results for Table 3 (q), (r), (s), (p). However, we note that cases (k) for three people and (e) for five people are similar in that we have people coming in diferent directions. In all these cases our algorithm still performs very well even for 40% location er r o r . |
VI.RELATED WORK |
| Tracking multiple people in a room is a challenging problem. Traditional approaches have included using cameras/ pattern matching and sound but are typically very expensive and inaccurate. In the past few years, many researchers have employed diferent new technologies to track, locate and identify multiple people. In paper [1], they track multiple people using acoustic energy sensors. Their approach is to use sound signatures to locate people. However, we don't know how well the algorithm performs as the number of people increase and with path crossings etc. Indeed, identifying path crossings and turns is the hardest path of tracking and it is unclear how their approach would work. |
| An alternative which many people pursue is using sensor networks such as [3] and [4]. These papers use sensors equipped with sound recognition and show a 95% accuracy. However, the research study is only limited to straight line walking and with up-to four people in the sensing area. In addition, since it is based on acoustic signatures, microphoneequipped sensors are used. The problem is that noise in the environment will afect the accuracy. |
| [6] and [8] both use similar techniques to recognize the motion of foot steps. The al- gorithm is based on foot signature recognition. Unfortunately this approach will not scale when presented with an unknown person. Furthermore, they use a special pressure sensor that provides direction of motion as well. These sensors require the tiles to be elevated which further reduces the utility. [2] and [5] also use similar pressure sensors under tiles to locate people. In addition, they both use RFIDs so that they can identify the number of people when there is confusion. [5] uses cameras with knowledge of the number of people for tracking. |
VIII.CONCLUSIONS |
| We examine the problem of tracking people in indoor environments. Using inexpensive pres- sure sensors, we develop good placement strategies that allow us to locate foot positions accurately. Given these positions, our tracking algorithm can track multiple people with high accuracy even if they turn and their paths cross. |
References |
|