ISSN ONLINE(2319-8753)PRINT(2347-6710)
ISSN ONLINE(2319-8753)PRINT(2347-6710)
T.R.Raghavan1, Mr. T. Prateep M.E. 2, Mr. M. Suresh MSc. M.Phil. PGDCA. 3
|
| Related article at Pubmed, Scholar Google |
Visit for more related articles at International Journal of Innovative Research in Science, Engineering and Technology
An accurate forecasting of prospective building demand in a developing city with high growing population is always a useful task for the socio-economic improvements all along the city. As it also involves in the welfare and improvement of the peoples of all categories. Despite that, a realistic forecasting of all types of buildings (incl. residential, commercial, and governmental) is never an easy task, as it governed by a number of social and economic factors. In this project a leading indicator model is developed especially for the demand forecasting of a all type of buildings in Erode city, District headquarters of Erode District, Tamilnadu. This study comprises factors and statistics required for the Linear Regression Analysis (LRA) model. The search through past history expresses that LRA model provides that most accurate forecasting for a long time horizon. In providing a random of possible forecasts, the LRA model also paves way for an opportunity of selecting mere possible and accurate forecasting for the decision-makers. This study provides exhaustic empirical research and detailed study (both macro and micro level) of past statistics and current statistics by combining with the future prediction of building growth in the city. This will give an alarming indication to the government authorities about the rapid demand in all type of building in the city.
Keywords |
| Forecasting, Building Demand, Regression models, LRA. |
INTRODUCTION |
| The effects of population growth are varied and vast. While population growth, of any species, may be beneficial to a certain extent, there may come a time when the number in the population exceeds the natural resources available to sustain it. This is referred to as overpopulation. The consequences of such an event are severe and major. As the population grows the opportunities for quality, available housing may become an issue. More people crowded into less space is not a good combination in any locality. As space is taken up, it becomes more valuable. Eventually, it begins to affect to poorest in the area. In the long run the effect of population growth may be substandard housing or homelessness. Cost of living is Higher- when land is limited in a country and population grows rapidly the cost of housing becomes expensive. Sometimes it is very difficult for people earning upper middle income to buy a decent home. |
URBANISATION |
| According to the 2001 Census, Tamil Nadu has the highest level of urbanisation (43.86%) in India, which accounts for 6% of India's total population and 9.6% of the urban population. It has 10 corporations, namely Chennai, Madurai, Coimbatore, Trichy, Salem, Tirunelveli, Erode, Tirupur, Vellore and Thoothukudi. Due to the development of the globalization, peoples are eager and wish to settle in cities. So most of the people after been graduated, moves into the cities and settled down. |
OBJECTIVE OF THE STUDY |
| A Study on the building demand forecasting for a Satellite Town through Artificial Neural Network (ANN) by developing a Linear Regression Analysis (LRA) model in it. |
NEED FOR THE STUDY |
| According to the 2011 land survey, 83.25% of the ERODE municipal area has been developed along the road side in all major road . |
| According to the 2011 census, ERODE city population is increasing by 11% annually and it seems mear impossible to provide a shelter for both the residents and commercial peoples of the city. |
| This building demand forecasting will overview and predict the year, in which population of the city exceeds beyond the building capacity. |
STUDY AREA DESCRIPTION |
| Erode District lies on the extreme north of Tamil Nadu. It is bounded mostly by Karnataka State and also River Palar covers pretty long distance. To the East lies Namakkal and Karur Districts. Dindigal District is its immediate neighbour to the South and on the West, it has Coimbatore and Nilgiri Districts, as its boundaries. Thus Erode District is essentially a land-locked area having no sea-cost of its own. Erode District situated at between 10 36” and 11 58” North Latitude and between 76 49” and 77 58” East Longitude. Erode district had a population of 22,59,608 as of 2011. It is 46.25% urbanized as per census 2001. The district has a literacy rate of 72.96% and is on the rise. Erode is the largest city in the district followed by Gopichettipalayam which is another major center. |
 |
 |
 |
AREA OF THE ERODE DISTRICT |
| Area - 2198sq.miles (5692 sq.kms) (whole district) |
| AREA OF THE ERODE CITY |
| Rural Area - 287sq.miles (MILES2) (743 sq.kms) |
| Urban Area - 3.22sq.miles (MILES2) (8.34 sq.kms) |
FACTORS IDENTIFICATION |
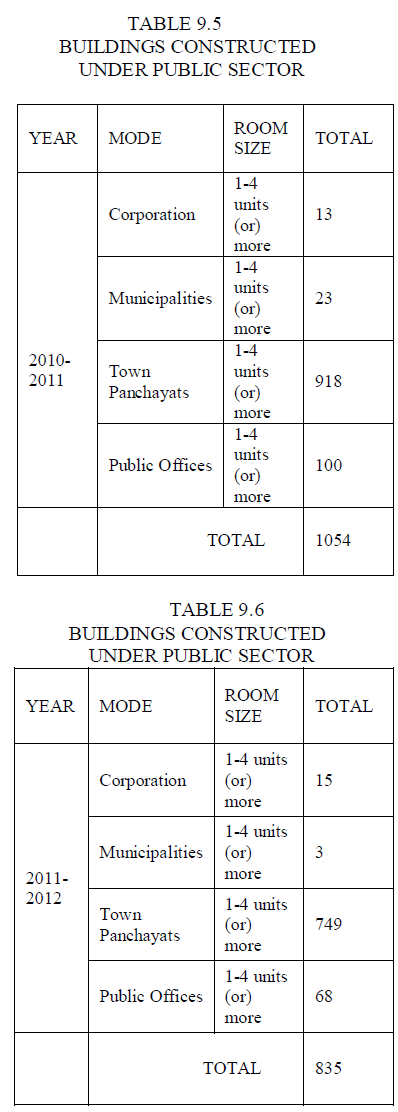
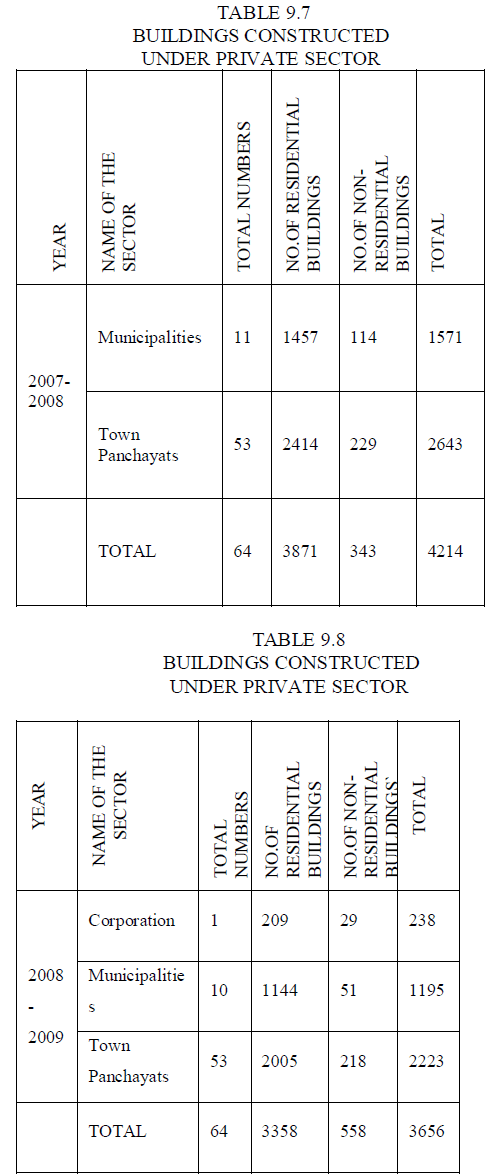
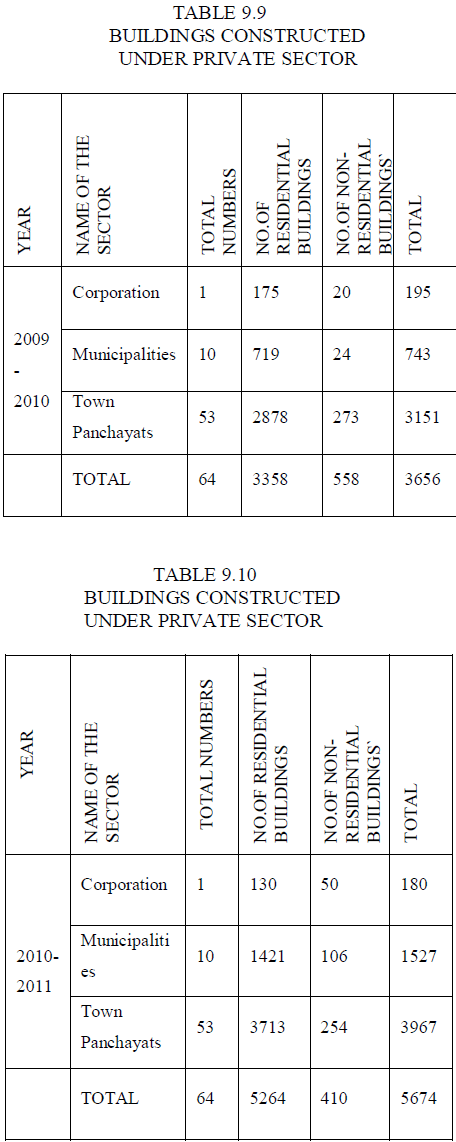
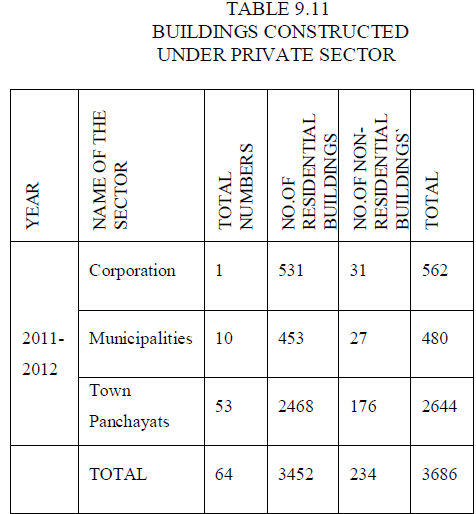
| There is a close relationship between the increase in population and building demand of a particular region. The building demand forecasting of a particular region will be based on may criteria and data, which includes the past history and statistics about the building demand relation with population. The increase in population paves way for the construction and emerging of Residential, Industrial, Commercial and Public Offices. |
| Some of the factors considered as necessary data for finding the building demand forecasting are as follows: |
| Free space available inside the city (private & public) |
| Population of the city |
| Percentage of population of the city Increased/Decreased yearly Population of the whole city |
| Percentage of Area of the city Increased/Decreased yearly |
| Number of Residential buildings in the city |
| Number of Governmental buildings in the city |
| Number of commercial buildings in the city |
| Capacity of the buildings as per the codal provision & raw data |
METHODOLOGY |
| Literature collection |
| Review of literature |
| Selection of parameters |
| Data collection |
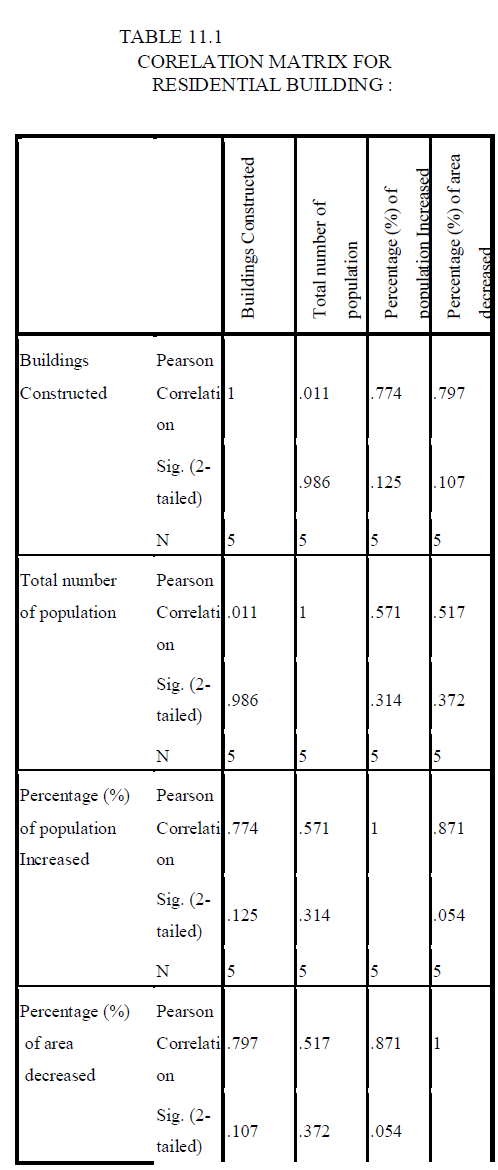
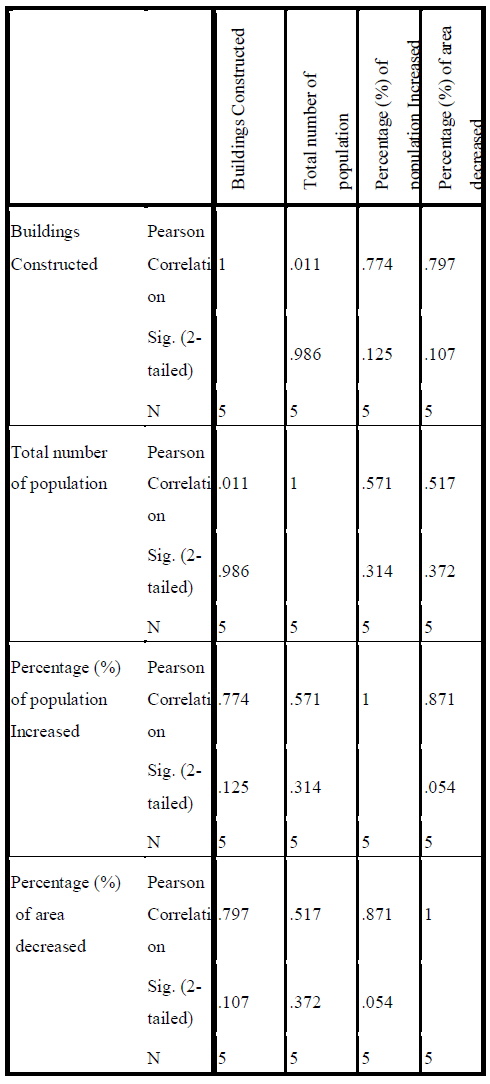
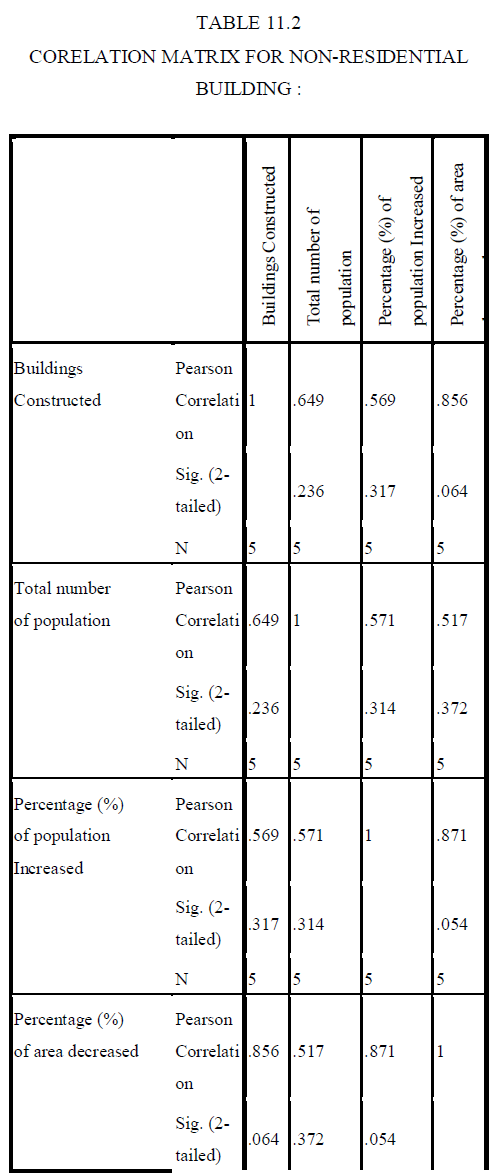
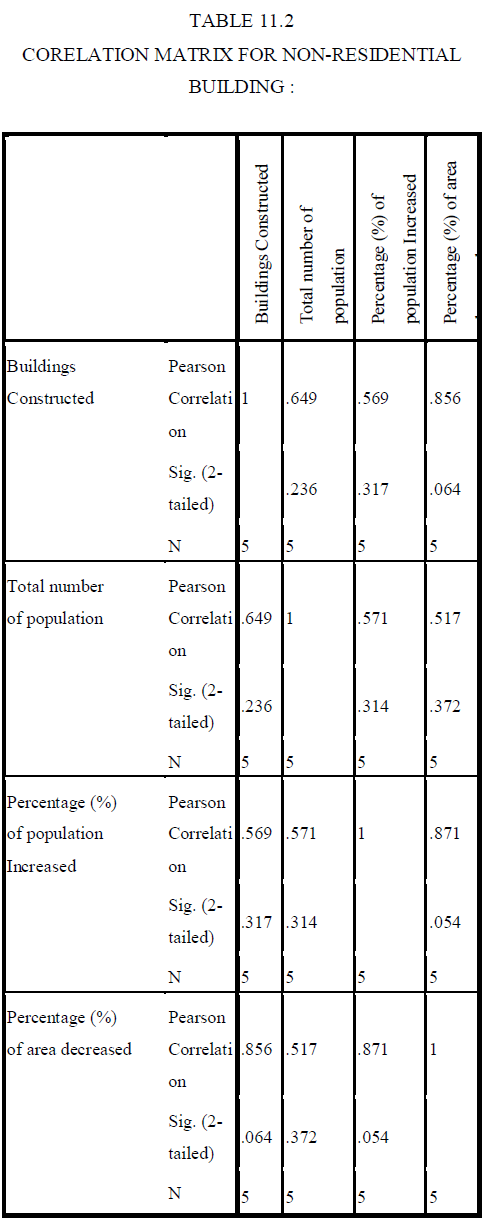
| Data analysis using spss |
| Developing lra model |
| Results and discussions |
DATA COLLECTION AND ANALYSIS |
| 9.1 POPULATION OF THE ERODE CITY |
| • 2011 - 5,21,776 peoples |
| • Male - 2,61,470 peoples (82.2%) |
| • Female - 2,60,306 peoples (72.42%) |
| • Ratio - 996 Females : 1000 Males |
 |
 |
 |
 |
 |
 |
DEMAND FORECASTING TOOLS |
| 10.1 LINEAR REGRESSION ANALYSIS |
| In statistics, linear regression is an approach to model the relationship between a scalar dependent variable y and one or more explanatory variables denoted X. The case of one explanatory variable is called simple linear regression. For more than one explanatory variable, it is called multiple linear regression. (This term should be distinguished from multivariate linear regression, where multiple correlated dependent variables are predicted,[citation needed] rather than a single scalar variable.) In linear regression, data are modeled using linear predictor functions, and unknown model parameters are estimated from the data. Such models are called linear models. Most commonly, linear regression refers to a model in which the conditional mean of y given the value of X is an affine function of X. Less commonly, linear regression could refer to a model in which the median, or some other quantile of the conditional distribution of y given X is expressed as a linear function of X. Like all forms of regression analysis, linear regression focuses on the conditional probability distribution of y given X, rather than on the joint probability distribution of y and X, which is the domain of multivariate analysis. |
SPSS |
| SPSS Statistics is a software package used for statistical analysis. Statistics included in the base software: |
| Descriptive statistics: Cross tabulation, Frequencies, Descriptives, Explore, Descriptive Ratio Statistics |
| ïÃÆü Bivariate statistics: Means, ttest, ANOVA, Correlation (bivariate, partial, distances), Nonparametric tests |
| ïÃÆü Prediction for numerical outcomes: Linear regression |
| ïÃÆü Prediction for identifying groups: Factor analysis, cluster analysis (two-step, K-means, hierarchical), Discriminant |
| SPSS Statistics places constraints on internal file structure, data types, data processing, and matching files, which together considerably simplify programming. SPSS datasets have a two-dimensional table structure, where the rows typically represent cases (such as individuals or households) and the columns represent measurements (such as age, sex, or household income). Only two data types are defined: numeric and text (or "string"). All data processing occurs sequentially caseby- case through the file. Files can be matched one-toone and one-to-many, but not many-to-many. |
| Statistical output is to a proprietary file format (*.spv file, supporting pivot tables) for which, in addition to the in-package viewer, a stand-alone reader can be downloaded. The proprietary output can be exported to text or Microsoft Word, PDF, Excel, and other formats. Alternatively, output can be captured as data (using the OMS command), as text, tab-delimited text, PDF, XLS, HTML,XML, SPSS dataset or a variety of graphic image formats (JPEG, PNG, BMP and EMF). |
 |
 |
 |
 |
 |
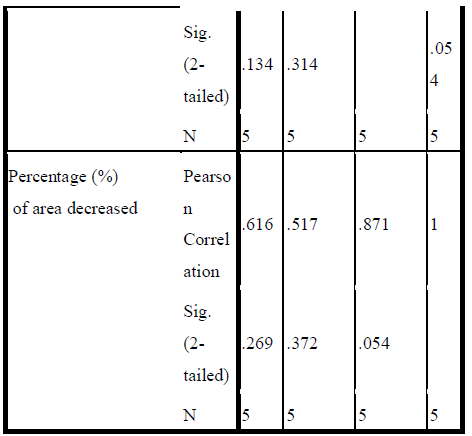 |
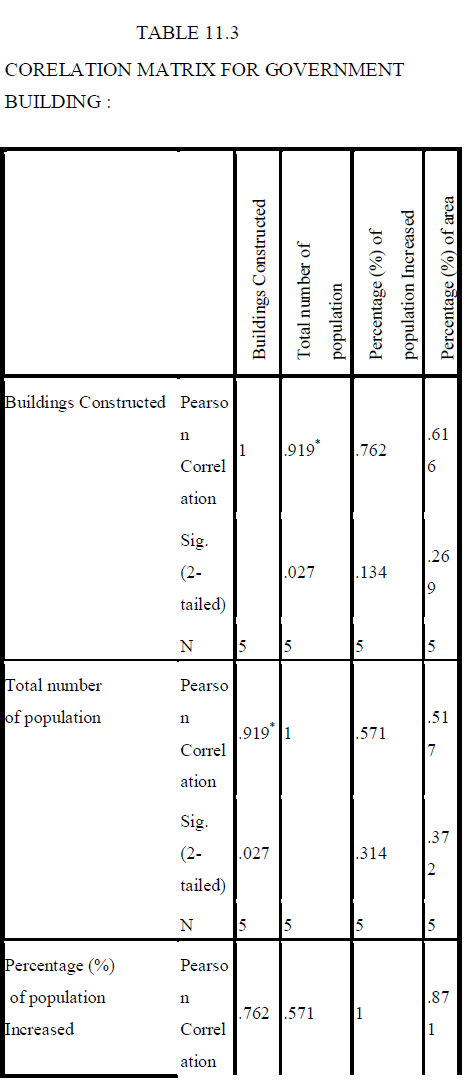
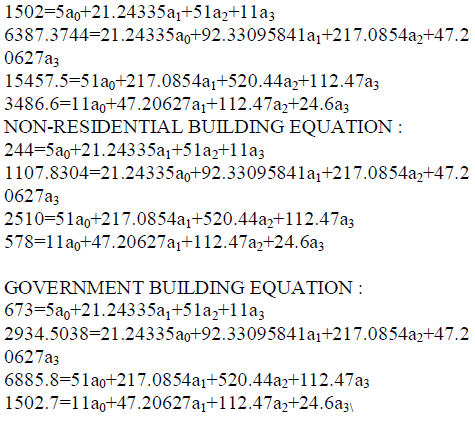
| The following equations for all the three types of buildings have been formed from the collected data. |
| SIMULTANEOUS LINEAR EQUATION FORMAT |
| Y = a0 + a1x1 + a2x2 + a3x3 |
| £y = a0 + a1£x 1+ a2£x2 + a3£x3 |
| £x1y = a0£x1 + a1£x1 2 + a2£x2x1 + a3£x1x3 |
| £x2y = a0£x2 + a1£x1x2 + a2£x2 2 + a3£x2x3 |
| £x3y = a0£x3 + a1£x1x3 + a2£x2x3 + a3£x3 |
| RESIDENTIAL BUILDING EQUATION : |
 |
RESULTS AND DISCUSSIONS THE TOTAL EQUATION OBTAINED FROM LRA MODEL |
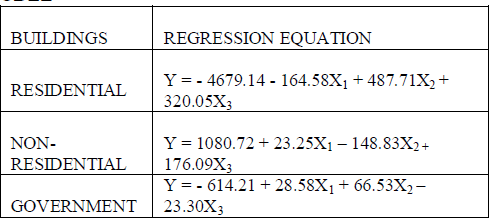 |
| Thus. Total equation for each area is developed using SPSS software. |
| `Here, |
| Y is the dependent variable that represents buildings in demand |
| X1 = Population in that area |
| X2 = Percentage (%) of Population increased/decreased than previous year |
| X3 = Percentage (%) of Area increased/decreased than previous year |
| Methods of linear regression model have been developed for evaluating subsets of independent variables wholly (“best subset” regression ), by adding variable one at a time (“forward” selection), deleting one at a time (“backward” elimination) or a combination of these latter two (“stepwise” regression). The stepwise regression was selected. The Linear Regression analysis method is easier to operate and the amount of time required to build a model is shorter. Thus the results have been obtained by using linear regression analysis. From this analysis we can easily predict the future building demands of Erode city for the year 2013-2018. |
CONCLUSIONS |
| Building demand of the erode city increasing rapidly day by day due to the over population (or) increase in population. The increase in floating population are also one of the main reason for the increase in building demand. Thus, the above results (Linear Regression Equation) which shows the building demand forecasting of the city will be very handy in predicting the demand of the city and take the necessary steps to meet the demand. |
References |
|