ISSN ONLINE(2319-8753)PRINT(2347-6710)
ISSN ONLINE(2319-8753)PRINT(2347-6710)
Nikunj Ashiyani1, Dr. Falguni Parekh2, Dr. T.M.V. Suryanarayana3
|
| Related article at Pubmed, Scholar Google |
Visit for more related articles at International Journal of Innovative Research in Science, Engineering and Technology
Ground water samples were collected Matar taluka of kheda district was assessed in pre monsoon season from 1997 to 2001. Water quality assessment was carried out for the parameters like pH, electrical conductivity (EC), total dissolved solids (TDS), chloride, sulphate, Total Anion & Cation, Sodium Absorption ratio (SAR), magnesium, sodium, potassium,. Correlation coefficients were determined to identify the highly correlated and interrelated water quality parameters. Regression equations relating these identified and correlated parameters were formulated for highly correlated WQPs. Comparison of observed and estimated values of the different water quality parameters reveals that the regression equations developed in the study is very useful for making water quality monitoring by observing the above said parameters alone. This provides an easy and rapid method of monitoring of water quality of the water system studied.
Keywords |
| Physico-Chemical Parameters, Regression equation, Correlation coefficient. |
INTRODUCTION |
| Water is our most valuable natural resource. This fact though recognized by man has not stopped him from polluting the rivers, lakes and oceans. The cause of water pollution could be municipal, agricultural and industrial. All these major causes have rampantly deteriorated the quality of water the world over. This has resulted in the decrease in the quality of drinking water available, and has also caused the decline of resources from our marine sources as the runoff water from the land is ultimately destined for the seas. Now a days, the ground water potential and its quality level in major cities and urban centre’s is getting deteriorated due to the population explosion, urbanization, industrialization and also the failure of monsoon and improper management of rain water. The ground water quality is normally characterized by different physic chemical characteristics. These parameters change widely due to the type of pollution, seasonal fluctuation, ground water extraction, etc. Monitoring of water quality levels is thus important to assess the levels of pollution and also to assess the potential risk to the environment [5]. |
| The developed regression equations for the parameters having significant correlation coefficients can be successfully used to estimate the concentration of other constituents. A systematic study of correlation and regression coefficients of the water quality parameters not only helps to assess the overall water quality but also to quantify relative concentration of various pollutants in water and provide necessary cue for implementation of rapid water quality management programmes [6]. |
II. STUDY AREA |
| Gujarat state is located in the western part of India. In this study, Matar taluka of Kheda district area is selected. The Kheda district is located (between 72o 32’ to 73o 37’ East longitude and between 22o30’ to 23o 18’ North latitude) in Gujarat. The Study was conducted in a pre-monsoon season of five years from 1997 to 2001. Total 185 samples from different localities of Matar taluka were collected. A multifactorial correlation analysis of the data was made to study the inter-relationship of 12 parameters. |
III. METHODOLOGY |
Linear Regression Model |
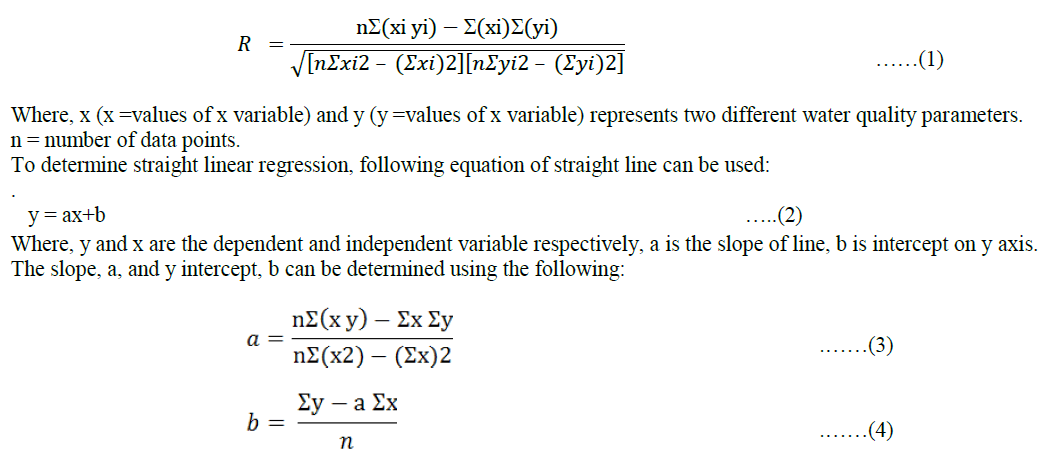
| The mathematical models used to estimate water quality require two parameters to describe realistic groundwater situations. Correlation analysis measures the closeness of the relationship between chosen independent and dependent variables. If the correlation coefficient is nearer to +1 or –1, it shows the probability of linear relationship between the variables x and y. This analysis attempts to establish the nature of the relationship between the variables and thereby provides a mechanism for prediction or forecasting6. In this study, the relationship of water quality parameters on each other in data of water analysed was determined by calculating correlation coefficients, R, by using the formula as given. |
 |
| In statistics, correlation is a broad class of statistical relationship between two or more variables. The correlation study is useful to find a predictable relationship which can be exploited in practice. It is used for the measurement of the strength and statistical significance of the relation between two or more water quality parameters. |
IV. RESULT & DISCUSSION |
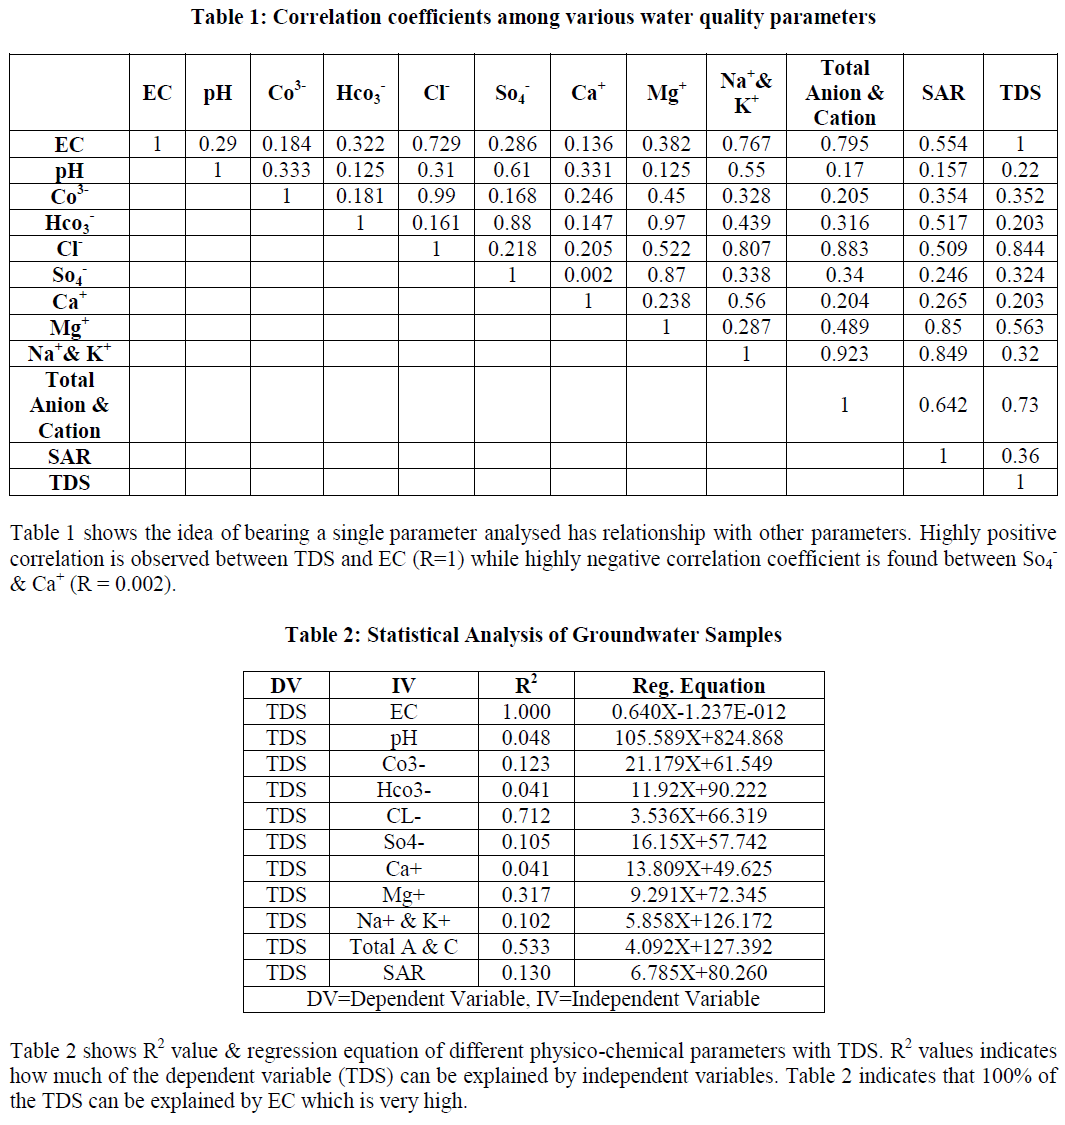
| The correlation coefficient measures the degree of association that exists between two variables, one taken as dependent variable. The greater the value of regression coefficient, the better is the fit and more useful the regression variables. Correlation is the mutual relationship between two variables. Direct correlation exists when increase or decrease in the value of one parameter is associated with a corresponding increase or decrease in the value of other parameter. In this study, the numerical values of correlation coefficient, R for the twelve water quality parameters are tabulated in Table 1. |
 |
 |
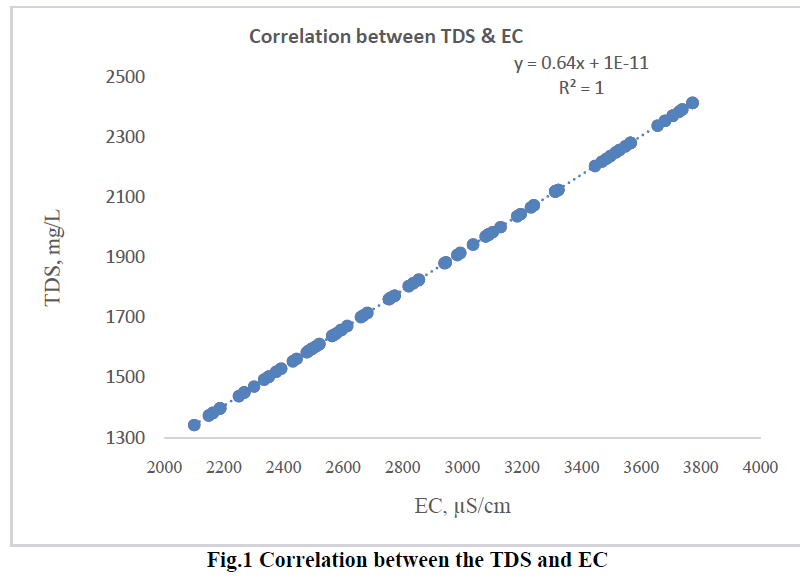
| TDS & EC are two important groundwater quality parameters. So it’s very important to know that they are interrelated or not. Fig. 1 shows the correlation between the TDS and EC, which is Linear (R=1), so from the graph we can conclude that TDS is largely depends on EC. |
 |
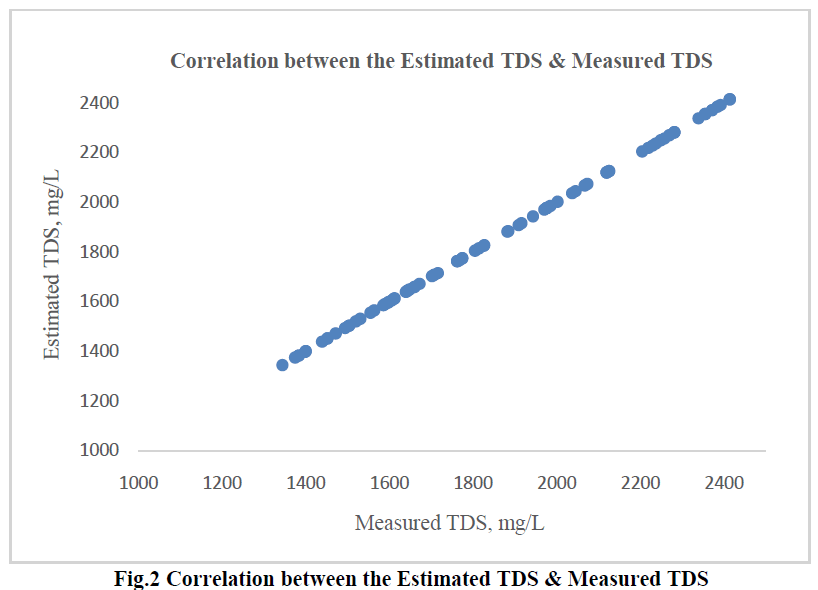
| Fig. 2 Shows the Graph between Estimated TDS & Measured TDS. From the graph we can conclude that the Value of Estimated TDS & Measured TDS is same. |
| Analysis of groundwater samples gave pH values (7.2-8.8). TDS value vary between 1344 to 2414 mg/L. A high value of TDS reduces water utility for drinking, irrigation and agriculture purposes. The EC Values are vary from 2100 μS/cm to 3772 μS/cm and this values is much higher than the prescribed indian standard limits (600 μS/cm) recommended by Indian Standards. Domestic sewagw & Industrial waste are significant sources of chloride. Chloride values are varies between 9 to 34.5 mg/L. In his area sodium varied from 10.2 to 52 mg/L. |
| In Table 1 correlation analysis of different groundwater quality variablesreveals that highly positive correlation is observed between TDS & EC (1.00) i.e. EC increases as the concentration of all constituents/ions increases. EC (μS/cm) is correlated with Total Anion & Cation, Na+& K+, Cl-& SAR (ranges from 0.795 to 0.554) & EC is poorly correlated with Ca+, Co3 -, So4 -, pH, HCo3-& Mg+ (ranges from 0.136 to 0.382). pH is correlated with Na+& K+& So4 - (ranges from 0.88 to 0.61) & poorly correlated with rest of parameters. Cl- is correlated with Total Anion & Cation, & Na+& K+& SAR (ranges from 0.883 to .509) & poorly correlated with rest of parameters. Ca+ is correlated with Na+& K+& poorly correlated with rest of parameters. |
V. CONCLUSION |
| In the present study, the correlation and regression of 12 Physico - chemical parameters of groundwater revealed that all the parameters were more or less correlated with one another. A linear regression analysis technique has been proven to be a very useful tool for monitoring groundwater and has a good accuracy. In the light of correlation regression study, we can conclude that all the parameters are more or less correlated with each other, especially strong correlations observed between TDS and EC (R=1.000). The linear correlation is very useful to get fairly accurate idea of the quality of the groundwater by determining just a few examples experimentally and then predicting the remaining from correlation equation. |
References |
|