ISSN ONLINE(2319-8753)PRINT(2347-6710)
ISSN ONLINE(2319-8753)PRINT(2347-6710)
| MSc. A. Zyfi1, Prof. S. Grazhdani1, Dr. A. Ahmeti1 Lecturers, Dept. of Wood Production, Faculty of Forestry Sciences, Agricultural University of Tirana, Tirana, Albania |
| Related article at Pubmed, Scholar Google |
Visit for more related articles at International Journal of Innovative Research in Science, Engineering and Technology
Prespa Lakes region is a good case study, as it is a wetland area of high biodiversity and long human history. The main features of this region are two lakes, which also give the name to the area: Macro Prespa and Micro Prespa, which lap the shores of the three countries (Albania, Macedonia and Greece) and connect them in this way symbolically. This region hosts unique habitats that are important from both regional and global conservation perspective, and populations of numerous rare, relict, endemic, endangered or threatened species. It is also remarkable for its cultural values, including Byzantine monuments and examples of traditional architecture. In Prespa, the coabidance between Man and Nature over the centuries has shaped and preserved a wealth of natural and cultural values that account for the area’s international importance. However, current resource management practices including water and land-use planning, agriculture, forestry and fisheries are failing to maintain and restore the health of ecosystems. The main goal of this study was to use a calibrated water quality model capable of predicting future water quality conditions resulting from potential changes in lakes operations and/or environmental conditions in Prespa Park region. In this study, CE-QUAL-W2, the two dimensional hydrodynamic and water quality model, was used to simulate water quality in Prespa Lakes, for the years 2010 through 2013. The simulation of main water quality constituents: dissolved oxygen, total phosphorous and orthophosphate, ammonia and nitrate, algal biomass and chlorophyll a, and organic carbon cycle, was performed. The sample data for each water quality parameter was statistically analyzed. The CEQUAL- W2 model was able to accurately simulate water quality, with relative error of the mean less than 10%. Model results revealed that model calculated concentrations of key water quality indexes matched well with the measured values. The modeling results presented here provide a starting point for simulating the water quality in the Praspa Lakes. The results and conclusions from this study are not intended for use on Prespa Lakes alone. The concepts of model development can potentially be applied and also broaden its usefulness to other systems.
Keywords |
| Prespa Lakes, CE-QUAL-W2 model, hydrodynamics data, water quality simulation, water quality parameters. |
LITERATURE SURVEY |
| With improved understanding of the eutrophication processes and hydrodynamics as well as more advanced computing capability of multidimensional lake hydrodynamic and water quality, models have been developed and applied to study water quality. One of them is the CE-QUAL-W2 model, which is a longitudinal-vertical hydrodynamic and transport model designed for long-term, time-varying water quality simulations of networks of rivers, lakes, reservoirs, and estuaries. There are many application examples to water systems of CE-QUAL-W2 model ([2], [8], [10], [13], [17] [18]). The capability of the model to predict changes in water quality in two dimensions (longitudinally and vertically) were among the characteristics which made CE-QUAL-W2 particularly suited to simulation of water quality in Prespa Lakes region. |
INTRODUCTION |
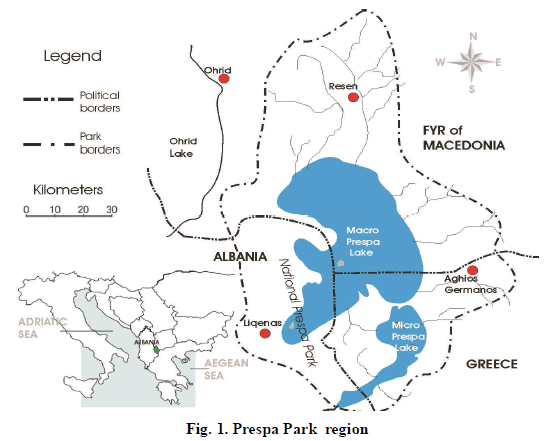
| Prespa Lakes region (Fig. 1) is an area internationality known for its ecological importance. Meanwhile, Prespa area abounds in rare animal and plant species, and contains some extraordinary examples of Byzantine heritage. Livestock, farming and fishing are the most important sources of income in the Prespa lowland. The basin of the Prespa Lakes is endowed with an exceptional biodiversity. The region has been recognized as a European and Global Hotspot of Biodiversity, not only because of the sheer number of species and habitats present, but also due to their quality, such as rarity and conservation significance. The unique values of this ecosystem are being eroded and threatened by increasing exploitation of natural resources, inappropriate land use practices, and uncoordinated sectoral policies and development activities leading to soil and water contamination and degradation. Productive sectors are failing to incorporate ecosystem health objectives into their daily management practices and protected area are under threat and can barely serve as biodiversity refuges. During the past decades the Prespa Lakes basin has also experienced significant pollution of its water bodies and the surrounding area, causing losses in aquatic biodiversity; a threat to fisheries, public health and tourism. Most important are industrial pollution and untreated wastewater discharges from the cities and towns. The concentrations of pollutants show seasonal variation, depending upon the weather and the flow in the tributary rivers. |
 |
| Considering the above, a study for obtaining the information about water quality was conducted from 2010 to 2013. It relates to the ecological state of Prespa Lakes. The purpose of this study was to develop a model of Prespa Lakes that can: (1) simulate the water quality in the lake, and (2) aid in developing a more in-depth understanding of lake quality and the processes affecting it. |
MATERIALS AND METHODS |
| A. GENERAL DATA ON CASE STUDY PRESPA LAKES |
| The Prespa region (~410 N latitude, ~230 E longitude) is located in the Balkan Peninsula, in south-eastern Europe. It is the first trans-border protected area in the Balkans established February 2nd 2000. It is a high-altitude basin which includes two inter-linked lakes, Macro Prespa and Micro Prespa and the surrounding mountain. The Macro Prespa Lake has a surface area of 253.6 km2, Micro Prespa is 47.4 km2 and the total area of the combined drainage basins and lakes is 2519 km2. The climate of the Prespa region is subject to Mediterranean and continental influences and may be characterised as continental-central European. It is characterised by winters with long periods of high rainfall, snow and low temperatures and warm but moderate summers. Mean monthly temperatures in the Prespa region average 9-100 C. The average annual rainfall is approximately 647 mm. Large parts of the ecosystems of the Prespa Lakes region have been converted or transformed into agricultural systems of various kinds, or have been replaced by towns, villages and other man-made infrastructures. More specifically, water abstraction from the lakes for irrigation purposes, use of fertiliser and pesticides, disposal of urban wastewater, and of solid household wastes increase eutrophication, enhance vegetation growth at the littoral zone, and increase growth of organic substances in shallow waters, leading to a reduction of the spawning grounds of endemic fish species and feeding grounds of rare water birds. In areas such as Prespa, as in many other non-wetland mountain areas in Europe, natural conditions have for hundreds of years been disturbed through human interventions; despite these changes, the natural character of the landscape is retained, but is far from being pristine. On the other hand, it should be noted that extensive land use practices have often created conditions favouring a high level of biodiversity. Examples of biodiversity-enhancing practices in Prespa basin have been: grazing, mowing and collection/use of reedbeds each year, cultivation of small woodland openings, cultivation practices with inter-cropping, crop rotations, small and intermingling fields with a variety of crops, maintaining natural hedges and trees, the non-use of chemicals, and the combination of arable farming and livestock rearing in a system of high spatial and temporal entropy. |
| B. MODEL DESCRIPTION |
| The CE-QUAL-W2 model, version 3.7 [6] was applied in this study to simulate water quality in Prespa Lakes. CEQUAL- W2 is a water quality and hydrodynamic model in 2D (longitudinal-vertical), supported by the USACE Waterways Experiments Station [3], for rivers, estuaries, lakes, reservoirs and river basin systems. The algorithms defining CE-QUAL-W2 model can be found in Cole and Wells ([5], [6]). The water quality algorithms incorporate 21 constituents in addition to temperature including nutrient / phytoplankton /dissolved oxygen interactions during anoxic conditions. Any combination of constituents can be simulated. The water quality algorithm is modular allowing constituents to be easily added as additional subroutines. The CE-QUAL-W2 model is a data intensive application. The data required for an application include bathymetric data, meteorological data (air temperature, dew point temperature, wind speed, wind direction, cloud cover, solar radiation, and precipitation), inflow and outflow volumes, inflow temperatures, evaporation, water quality constituent concentrations, and hydraulic and kinetic parameters. The availability and quality of these data directly affect model accuracy and limit usefulness. The capability of the model to predict changes in water quality in two dimensions (longitudinally and vertically) were among the characteristics which made CE-QUAL-W2 particularly suited to simulation of Prespa Lakes. The model was calibrated for orthophosphate, total phosphorus, ammonia, nitrate, total nitrogen, chlorophyll a, algal biomass, organic carbon and dissolved oxygen with available measured data [16]. Calibration consisted of setting model parameters to literature values or to values used by other models ([4], [5], [6], [7]) and refining them in a logical and organized fashion until modeled and measured concentrations matched reasonably well. |
| C. DATA COLLECTION |
| For the purpose of model simulation, in this study was used water quality data collected at five sites within Prespa Lakes basin. The data being collected at the monitoring sites includes meteorological, hydrological and water quality data. Hourly of global solar radiation, air temperature, rainfall, wind speed, wind direction, and relative humidity were measured at nearest meteorological station with monitoring site. Dew point temperature was calculated from air temperature and relative humidity. At each lake monitoring site, water temperature and dissolved oxygen profile measurements were taken at one-meter increments from the surface through the water column. Organic and inorganic nutrients and total suspended solids concentrations were determined for surface, mid-depth and bottom samples collected at each site. A Secchi depth measurement was also made at each site. Water quality samples were taken at monitoring sites approximately monthly from November to April and twice a month from May to October. Vertical profiles of temperature, dissolved oxygen, pH, specific conductance, and turbidity were measured in the field by personnel with a multiparameter probe (Hydrolab or YSI), and samples for the analysis of total suspended solids, total phosphorus, orthophosphate, nitrate plus nitrite, total Kjeldahl nitrogen, ammonia, and also total organic carbon, and dissolved organic carbon, were taken at specific depths in the lake with a Van Dorn sampler. Two nutrient samples were taken from each depth, and one was acidified with sulphuric acid. In addition, a chlorophyll a sample was taken from 1 m depth, and a sample for phytoplankton identification and enumeration was taken at the lake surface. Zooplankton samples were vertical integrations from 1 m off the bottom to the surface and were collected using conical, 20-cm diameter plankton net. Phytoplankton species were identified and enumerated in each sample, and biovolumes and densities were computed. Likewise, for zooplankton samples, species were identified, and species density and biovolumes were calculated. The distribution of zooplankton lengths was also determined. Chlorophyll-α samples representing depth composites of three samples taken between the surface and secchi depths were used to estimate algal biomass. Unacidified samples were filtered in the laboratory with a 0.45 μm (micrometer) filter. Total phosphorus and orthophosphate were analyzed by U.S. Environmental Protection Agency (USEPA) method 365.1 [15]). Ammonia was analyzed by USEPA method 350.3, and TKN by USEPA method 351.2 [14]. Chlorophyll a was analyzed by Standard Methods 10200H [1]. |
| D. DATA AND STATISTICAL ANALYSIS |
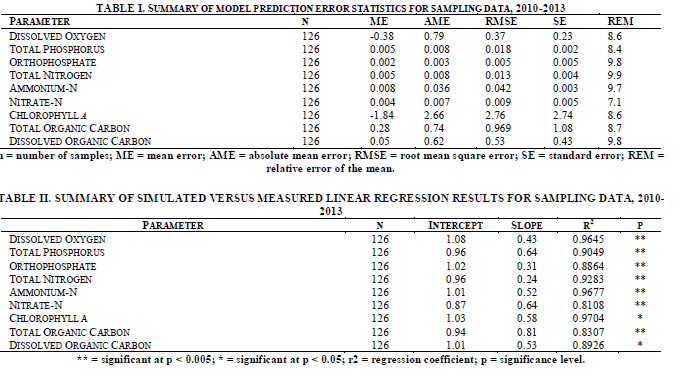
| An often overlooked step in model applications is plotting and analyzing observed data for all stations and times for which data are available. Another important task in data development and analysis is to analyze the data for reasonableness. So, all time-varying input data were plotted and screened for errors. A number of model error statistics were computed and aggregated by parameter, season, and location to evaluate the spatial and temporal prediction capability of the model. The goodness-of-fit statistics for the comparison of modeled and measured values include annual mean errors (ME), mean absolute errors (MAE), root mean square errors (RMSE), and relative error of the mean in percentage (REM). Linear regression analysis was also made with measured data as dependent variable and the modeled data as independent variable. The coefficient of determination, slope, and intercept of the linear regressions between for sampling data for each water quality consistent were calculated. |
RESULTS AND DISCUSSION |
| Water quality constituents used in the development of the model include dissolved oxygen, total phosphorus, orthophosphate, total nitrogen, nitrate-N, ammonium-N, chlorophyll a, total organic carbon, and dissolved organic carbon. A summary of the current model’s performance along with summary statistics in tabular form follows. A summary of model-prediction error statistics based on sampling data collected between 2010 and 2013 is provided in Table I. Linear regression statistics results of measured versus modeled are provided in Table II. |
 |
| A. DISSOLVED OXYGEN |
| Levels of dissolved oxygen in Prespa Lakes were high and homogeneous in winter when the water in the lake was wellmixed and cold. As the lake’s surface warmed, oxygen solubility decreased and surface concentrations decreased via losses to the atmosphere. Later, as the hypolimnion became isolated due to lake stratification, the oxygen there was gradually consumed, primarily by sediment oxygen demand. Eventually, the hypolimnion became completely anoxic. This anoxia occurred in late September or early October in most years of this study. With colder temperatures and lake overturn in November, dissolved oxygen concentrations in Prespa Lakes returned to high levels. Comparing measured and modeled dissolved oxygen profiles at the same location, date, and time produced annual MEs between -0.51 and 0.13 mg/L, MAEs between 0.16 and 0.78 mg/L, and RMSEs between 0.13 and 0.88 mg/L for 2010 through 2013. The overall goodness-of-fit statistics for dissolved oxygen were relatively low (usually < 1.0 mg/L), indicating a good fit and suggesting that the model was capturing the most important spatial and temporal patterns in the dissolved oxygen data. The model accurately represented the seasonal effects of temperature on oxygen solubility, the importance of sediment oxygen demand, the development and timing of anoxia in the hypolimnion, and the relatively less important effects of algal photosynthesis and respiration. Dissolved oxygen is affected by such a wide range of limnological processes and reactions that it is perhaps the best single gauge of a model’s ability to simulate water quality. In this case, the model does a good job with dissolved oxygen and, therefore, should be a useful tool for examining and evaluating water quality in Prespa Lakes. |
| B. TOTAL PHOSPHOROUS AND ORTHOPHOSPHATE |
| Phosphorus levels in the lake were low overall (total phosphorus typically < 0.03 mg/L, orthophosphate typically < 0.01 mg/L as P). The greatest deviation between modeled and measured phosphorus concentrations in Prespa Lakes typically occurred in the fall, when the model predicted higher total phosphorus than was measured. Modeled and measured total phosphorus temporal profile at the Pusteci monitoring site, for the representative year 2013 is shown in figure 2. The temporal pattern in figure 2 illustrates several important processes affecting phosphorus concentrations in Prespa Lakes. First, the overall phosphorus concentrations were fairly low and typical of an oligotrophic system; the low phosphorus concentrations could be limiting algal growth and primary productivity. Second, when algal blooms occurred (late spring through summer), orthophosphate concentrations (the bioavailable phosphorus) decreased to levels below detection near the surface of the lake where the algae were growing. Lastly, when the lake’s hypolimnion was anoxic from late August or September through mid-November, phosphorus concentrations increased near the lake bottom - a typical result of the dissolution of iron oxides in the lake sediments. Ammonia should also be released from the sediments under anoxic conditions, and this was in fact observed in the ammonia data each year. |
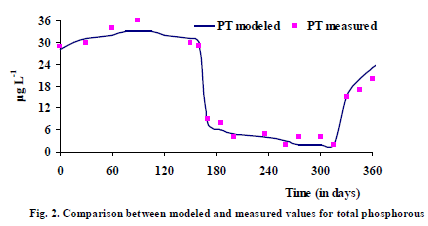 |
| Calculating goodness-of-fit statistics between measured and modeled total orthophosphate produced annual MEs between 0.001 and 0.004 mg/L, MAEs between 0.002 to 0.004 mg/L, and RMSEs between 0.003 and 0.007 mg/L for 2010 through 2013 (table I). For total phosphorus, annual MEs ranged from 0.007 to 0.003 mg/L, MAEs ranged between 0.007 and 0.011 mg/L, and RMSEs were between 0.011 and 0.016 mg/L. The fact that the ME is near zero and the MAE and RMSE show errors of less than 0.011 mg/L indicates that the model accurately captured the phosphorous budget of Prespa Lakes. The comparison of measured and modeled phosphorus concentrations in figure 2, table I and table II is reasonable. The model kept track of the phosphorus relatively well, and with sufficient accuracy to meet the needs of this investigation. |
| C. AMMONIA AND NITRATE |
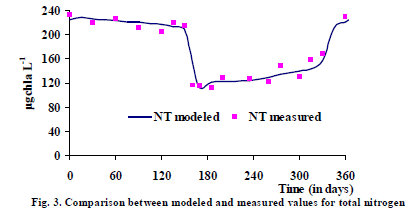
| Ammonia was below or close to its analytical detection limit (0.01 mg/L as N) throughout Prespa Lakes for most of the years in this study, but measurable concentrations of ammonia were found to accumulate in the hypolimnion at concentrations up to 0.54 mg/L as N once that layer became anoxic in late September. Ammonia can accumulate in the anoxic hypolimnion because no oxygen is present to support nitrification. Sources of ammonia to the hypolimnion include ground-water discharge and the deamination of organic material in the lake sediments. Nitrate can be reduced by bacterial communities to N2 under anoxic conditions, but further reduction to ammonia is not favored. When the lake turned over in the fall, the accumulated ammonia was mixed and diluted into the larger volume of the lake, and the entire lake became oxygenated, diminishing the production and stopping the accumulation of ammonia, and increasing the production of nitrate. While nitrate was included in the Prespa Lakes model. It appeared that concentrations of nitrate in summer were depleted near the surface and were highest in the hypolimnion. This is consistent with the trend observed by Zyfi [17]. That study found the highest concentrations of nitrate in Prespa Lakes during winter (0.458 mg/L as N), and depletion in surface waters during the summer (less than 0.023 mg/L as N). Concentrations of nitrate in the hypolimnion remained relatively high (greater than 0.134 mg/L as N) except for the period of hypolimnetic anoxia in the fall. These trends were not always mimicked by the Prespa Lakes model, possibly due to inaccurate boundary conditions, inaccurate capture of one or more limnological processes, or both. This is an area where additional data collection, research and additional model refinement may be required for the future. Nitrate is not a critical parameter in characterizing this lake’s water quality (recall that blue-green algae can fix atmospheric nitrogen), however, so some error in its representation is acceptable for the purposes of this investigation. Comparing measured and modeled ammonia profiles at the same location, date, and time produced annual MEs between 0 and 0.01 mg/L as N, MAEs between 0.01 and 0.02 mg/L as N and RMSEs between 0.03 and 0.05 mg/L as N for 2010 through 2013 (table I). Concentrations of ammonia typically were low (< 0.05 mg/L as N), with the exception of samples collected from an anoxic hypolimnion; therefore, it is not surprising that the goodness-of-fit statistics report a relatively small overall error. The model’s overall ability to predict the lake’s ammonia concentrations, in addition to the correct timing and general magnitude of ammonia accumulation in the lake’s hypolimnion, suggests that the most important influences on ammonia were captured by the model with sufficient accuracy. Measured and modeled total nitrogen (TN) profile at the Pusteci monitoring site, for the representative year 2013 is shown in figure 3. |
 |
| D. ALGAL BIOMASS AND CHLOROPHYLL A |
| In Prespa Lakes, over 80 different species of algae were identified in the samples taken from 2010 through 2013, and the composition and concentration of algal species in each sampling instance varied greatly. An examination of the algal data collected in Prespa Lakes, however, showed that at least two algal groups had to be simulated to capture the basic dynamics of the algal community: a blue-green algae group and a general algae group that included all other types, including diatoms, golden-brown algae, and cryptophytes. Results comparing modeled and measured total algal bio-volume (total of both algal groups) and chlorophyll a near the lake surface at the Pusteci monitoring site, for the representative year 2013 are shown in figure 4. Algal biomass was simulated by the model; biovolume was calculated directly from biomass using simple density relationships. Surface samples are not always the best indicator of algal activity, but those were the only algae samples taken in the lake. In general, the spring peaks in chlorophyll a and algal populations were composed of algae in the model’s general algae group. These peaks do not always represent algal growth. |
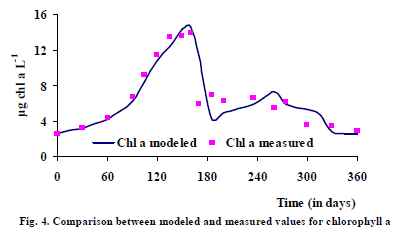 |
| The diatom Melosira italica is one species commonly found in Prespa Lakes during these spring algae peaks. This species has the ability to survive in anoxic sediment for up to 2 years [9]. Its population appears in the water column in winter and spring and is thought to be due, in part, to scouring from tributary streambeds and resuspension of cells in the lake sediment during storms. The second observed and modeled algal peaks in August-September were mainly due to blue-green algae blooms, the species Anabaena planctonica in particular. During these blooms, orthophosphate became depleted in the water column. A lack of orthophosphate is known to control the size of these blooms ([11], [12]), and in the model, this directly contributed to the cessation of blue-green algal growth. This suggests that depletion of phosphorus may control the end of the blue-green algae bloom in the lake; however, it is possible that other, unknown factors contribute as well. Elevated water temperature, for example, appeared to be one of the factors that helped to initiate the blue-green algae bloom. Comparing measured chlorophyll a concentrations to modeled values at the same date, time, and location produced annual MEs between -2.5 and -0.4 μg/L, MAEs between 2.1 and 3.4 μg/L and RMSEs between 2.7 and 3.8 μg/L for 2010 through 2013 (table I). Algae and chlorophyll a were only sampled at one depth near the surface of the lake. While the model did not simulate the complex dynamics of all algal species in the lake, it was able to predict the general size and timing of certain algal population changes, including blooms of blue-green algae, which are the algae that most influence Prespa Lakes’s water quality. |
| E. ORGANIC CARBON CYCLE |
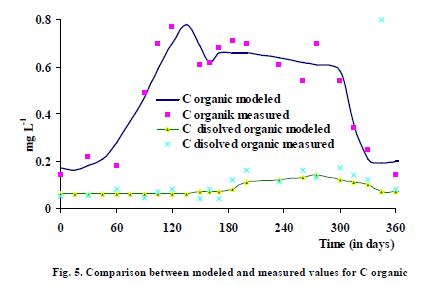
| The organic carbon cycle at the Pusteci monitoring site, for the representative year 2013 is shown in figure 5. This plot indicates a clear difference between the productive summer months and the rest of the year. High organic carbon generation during the stratified period has several implications. First, it eventual decomposition can have an impact on oxygen content of bottom waters. This would be particularly important for water bodies with smaller hypolimnion (and, hence smaller oxygen reserves) than for Prespa Lakes. Second, the transport and fate of toxic substances can be strongly associated with organic matter. |
CONCLUSIONS |
| In this paper, we have tried to answer only a few of the issues raised on water quality in Prespa Lakes. The following conclusion can be inferred from the obtained data. |
| In general, the quality of the lake water appears to be within the acceptable limits. The limited number of pollution sources in combination with the high refresh rate of the lake water and the inflow of clean karstic groundwater are the main reasons that the water quality remains good. |
 |
| The model captured the dominant processes affecting water quality (dissolved oxygen, nutrients, and algae) in Prespa Lakes and simulated the lake’s water quality dynamics with sufficient accuracy for the planned purposes of the model. The calibrated model was capable of simulating the important spatial and temporal dynamics of various constituents in the lake, and successful application of the calibrated model to 2005 and 2006 data confirmed this. Goodness-of-fit statistics for all 5 years varied from acceptable to good. Comparing measured and modeled dissolved oxygen profiles in the 5 years having reliable data (2005 - 2009), the model errors typically were less than 1 mg/L. Ammonia concentrations generally were low throughout Prespa Lakes. However, in all years studied, accumulation of ammonia in the hypolimnion occurred once dissolved oxygen was depleted. Ammonia concentrations as high as 0.43 mg/L (milligrams per liter) as N were measured in November of 2009. Algae were separated into two groups in the model: blue-green algae and all other algae. The general algae group had its highest abundance in the spring, due in part to inputs of algae from tributaries and possible resuspension of algal cells during storms. The blue-green algae group tended to bloom in late summer (in August, typically). Orthophosphate concentrations, as well as zooplankton grazing, water temperature, and light, controlled the levels and timing of algal blooms in the model. Concentrations of bioavailable phosphorus appeared to limit the size of the annual blue-green algae bloom. The model provides predictions of features like peak chlorophyll levels and, hence, produces information that is extremely useful to water-quality managers. This is because the public is often most concerned with extreme events in water body, rather than in seasonal or long-term average conditions. Because of its daily time step, the nutrient/food chain model is capable of generating both types of information. According to the calculation, the lake is overwhelmingly phosphorus limited during the summer stratified period. The fact that there is excess nitrogen and phosphorus in the water indicates that lake’s production is light limited during the remained of the year. By providing predictions of organic carbon levels, model framework provides a means to assess both oxygen and toxic substances in lakes. Further improvements in the model’s capabilities will only come with additional data collection and further model testing and development. |
References |
|