ISSN ONLINE(2319-8753)PRINT(2347-6710)
ISSN ONLINE(2319-8753)PRINT(2347-6710)
| Esaiselvan Kanthasamy1, Allen Gnana Raj2 Deputy Officer, Indian Rare Earths Limited, Manavalakurichi,Tamil Nadu, India1 Associate Professor, Department of Chemistry, Scott Christian College, Nagercoil, Tamil Nadu, India2 |
| Related article at Pubmed, Scholar Google |
Visit for more related articles at International Journal of Innovative Research in Science, Engineering and Technology
Radiation exposure and effective dose received by villagers residing at twenty villages belonging to Natural High Background Radiation Areas of coastal regions of Tamil Nadu were studied; five houses in each village were selected. The NHBRA villages were of similar construction pattern (brick wall-tiled roof, cement flooring). Measurements of radon (220Ra), thoron (222Ra) and their progeny, produced by the decay of naturally occurring radiosotopes uranium and thorium in dwellings is the largest contributor to the average internal effective dose received by human beings. Internal doses due to radon/ thron and their progeny were estimated using, Solid State Nuclear Track Dectors (SSNTD), LR-115, as the detector. External doses were estimated by gamma measurement using scintillometer and Thermo Luminescent Dosimeter (TLD); TLDs were exposed for one year, on a quarterly basis, inside the house at a height of 3 meters and about 1 meter away from the walls. The SSNTD cups were exposed adjacent to the TLDS, and the exposure as for a period of three months each. Inhalation dose due to Th and Th (B) in mWL were estimated by collecting air samples from each house, for one hour each, during the replacement time of TLD and SSNTD Cups. For inhalation dose estimation the occupancy factor was assumed to be 0.8. The soil samples were also collected from each sampling point. Effective radiation dose received by the villagers residing at Natural High background Radiation area is ranging from 4.47 to 8.38 mSvy-1.
Keywords |
| Natural High Background Radiation Area, Thermo Luminescent Dosimeter, millisivert, Radon, Thoron, Radiation exposure. |
INTRODUCTION |
| However, recent studies have shown that the contribution of Rn and its progeny is not trivial but forms a good percentage of the indoor inhalation dose rates (Ramachandran et al., 2003). Indoor 222Ra and 220Ra results primarily Rn and Tn in soil with a small fraction arising from the building materials. Emanation rate of Rn gases and the ventilation rates govern the Rn and Tn levels in dwellings. Indoor radiation exposures in buildings are mainly due to the external gamma radiation from the primary radionuclide present in the construction materials and due to the inhalation of Rn , Tn and their progenies. Materials used for construction and design of the houses will therefore determine the total indoor exposure. Annual gamma radiation dose rates in India ranges from 0.28 mSvy-1 in western India to about 1.06 mSvy-1 in eastern parts of the country (Nambi et al.). Of the terrestrial component 48.7% of the contribution is from K and the rest is from Th (33.65%) and U (17.7%) series. An old database on U, Th and K content of rocks is also exists for the country. It is estimated that nearly 50% of the total background radiation dose rate to the population is received by the contribution from inhalation dose due to Rn, Tn and their progenies. The doses received by human population from these gases and their daughter products are more than half of the total effective dose and it has been realized all over the world that residential radon and thoron is a possible public issue (UNSCEAR, 2000). |
II. MEASUREMENT PROCEDURE |
| Passive dosimeters were used for the simultaneous measurements of Rn and Tn and its progenies in dwellings around NHBRA of coastal regions of Tamil Nadu. The dosimeter system used consists of a twin chamber dosimeter standardized at HPU of IREL Manavalakurichi. A number of hundred houses were monitored during the survey. Houses selected for the survey were at random from the entire NHBRAS of Kanyakumari district. Details of twin chamber dosimeters and methodology have been discussed elsewhere (Mayya et al., 1998). The dosimeters were installed in different dwellings at a height of 2.5 meters from the ground level. After a stipulated period of time (preferably 90 days) of exposure the films were retrieved and etched chemically in 2.5 N NaOH solutions at a constant temperature of 600C for 90 minutes. The etched films were peeled off from the base and then dried using UV lamp. Tracks recorded on peeled L.R.115 film were counted using microprocessor controlled spark counter (Poll Tech India Ltd, Mumbai). Measured tracks were converted in to radon/thoron concentration using calibration constants and the inhalation doses were computed for the concentration using the dose concentration factors (UNSCEAR, 2000). Earlier calibrations of the SSNTDS were carried out in bare mode and cup mode. In bare mode exposure the SSNTDS were clipped in plastic clips and tied on a thread and inserted in the calibration facility through the openings provided at the top of the chamber. They were exposed for various time intervals ranging from 5 to 30 minutes, while the concentrations of the thoron progeny were kept at the uniform level of 0.5 WL and 1 WL. The SSNTDS were then removed and counted in the alpha counter for a period of 100 seconds to assess, the plated or deposited activity on it. Subsequently the Rn/Tn cup is exposed to Thorium sources and the thoron daughter attains equilibrium states inside the calibration facility. The exposure period varies from 5 to 30 minutes. The natural background gamma radiation levels were measured using Thermo luminescence dosimeters (TLDs) and G.M.tube based micro R.Survey meter (Nucleonix Systems Privatge Limited, Hyderabad, India make) in the same dwellings, preparation, installation and retrieval procedure of TLDs were discussed elsewhere (Sreenivasa Reddy et al 2002). The calibrations of TLDs were made at the Nuclear Fuel Complex, Department of Atomic Energy, Hyderabad, India. |
III. RESULTS AND DISCUSSION |
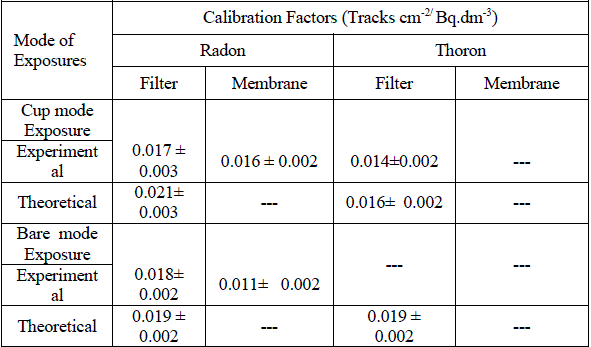
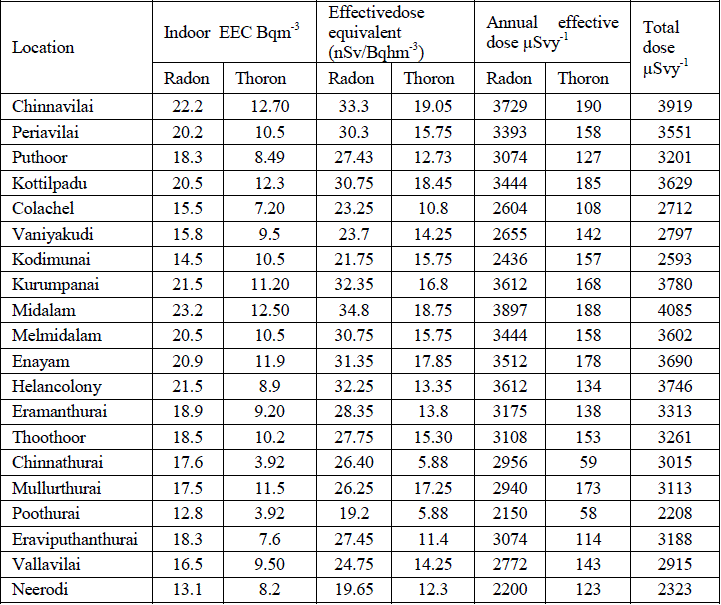
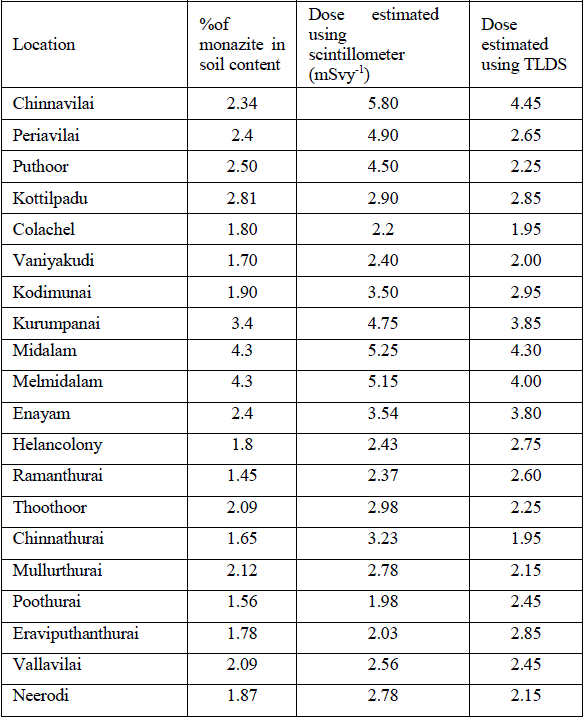
| Table (I) shows the calibration factors for the SSNTDS (cup mode), for radon, were worked out to be 0.017ïÃâñ0.003 and 0.016ïÃâñ0.002 Tracks cm2/Bq.m-3 in filter and membrane compartment respectively. For thoron the factor was 0.014 in the filter part. In the bare mode, radon factors were 0.018ïÃâñ0.002 and for thoron it was 0.011ïÃâñ0.002. The EEC (Equilibrium Equivalent Concentration) in Bq m-3 as calculated from the holes developed is the SSNTD films. The conversion of the holes developed to the concentration was carried out using the calibrtion factors provided in the calibration table. Table (II) provides the indoor EEC concentration of radon was ranging from 13.1 Bqm-3 to 23.2 Bqm-3. Similarly the indoor EEC concentration of thoron ranging from 3.92 to 12.7 and effective dose equivalent of radon and thoron was ranging from 19.2to 33.8 nSv/Bqhm-3 and 5.8 to 19.0. nSv/Bqhm-3 and total effective dose due to radon and thoron works out to be 2208 ïÃÂÃÂSv/y to 4085 ïÃÂÃÂSv/y (2.20- 4.08 mSvy-1). The effective dose due to thoron is lesser than those results from radon. This is because the thoron emanation from the thorium bearing mineral (monazite) is very less (less than 0.04%), whereas for radon it is more than 90%. Table (III) presents the percentage of monazite in the soil and the dose estimated using scintillation survey meter and TLDs. It gives annual gamma dose levels in mSv/yr with standard deviation for all the twenty locations currently being monitored. It is clearly seen from the results that the external gamma radiation levels particularly at Chinnavilai, Kurumpanai, Midalam, Melmidalam and Enayam areas show higher levels (3.80– 4.45 mSv/yr) due to proximity of these areas to beach sand. The lower radiation levels were observed in villages away from the sea beach (1.95 – 2.95 mSv/yr. There is a good agreement between the percentage of monazite and the dose estimated by scintillation survey meter and TLDs.The TLDs were exposed for 90 days and replaced with new one in the same place for every quarter for one year. As the TLDs were exposed for 90 days, they represent integrated and more reliable estimation than that estimated by scintillation survey meter. Hence doses reported from TLDs were used for the calculation of the effective dose. The variation seen in the natural high background gamma exposure in the different villages is due to the variation in the monazite concentration and radon/thoron emanation from soil to air. |
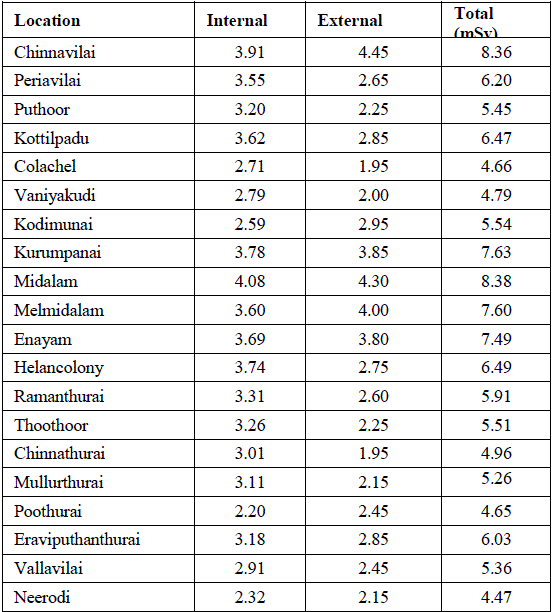
| Table( IV) provides the total dose received by the residents of NHBRA villages. The total dose is the sum of the factors, the internal and external. It was estimated that for the villagers residing in the NHBRAS, it is range from 4.47mSv to 8.38mSv. The maximum is being found out at Midalam (8.38 mSvy-1). |
 |
| Table: I Calibration Factors (CFs) for the Cup mode and Bare mode Exposure |
 |
| Table: II Inhalation Exposure due to Radon and Thoron at NHBRA Villages |
 |
| Table III: Comparison of Estimated Dose by Scintillation Survey Meter and TLD Exposure |
 |
| Table: IV Total (External +Internal) Dose Received by Residents at NHBRA |
IV.CONCLUSION |
| It was found that soil activity varied from 1600 to 12000 Bq/K.g. The exposure rate measured by scintillometer showed radiation field ranging from 0.40 to 19.00 ïÃÂÃÂGy/h. It was observed that the exposure dose estimated on the basis of the scintillometer reading was higher by a factor of 2.0, than that determined by TLDs. But the doses registered by TLDs were considered as more genuine and were used for estimation. It was observed by air samples collected from studied area that the short lived activity ranged from 0.3 to 2mWL and long lived activity ranged from 0.002 to 0.0058 Bqm/m3. It was estimated that effective dose received by the villagers residing in the NHBRAs, it is ranging from 5.42 to 8.38 mSvy-1. The maximum is being at Midalam (8.38 mSv). It is made sure by the regulatory bodies that common public get a additional dose of not more than 1 mSv per year due to all technological activities put together, this is fraction of the natural radiation dose of about 2.4 mSv per year, which could be as high as 8.38 mSvy-1 (reported value) in the coastal region of Tamil Nadu, southern of part of India, which is any way unavoidable. |
ACKNOWLEDGEMENT |
| The authors are grateful to Shri.A.K.Mohapatra, Head, Indian Rare Earths Limited, Manavalakurichi for his encouragement and support. The facilities for sampling and analysis offered by Bhabha Atomic Research Centre and Indian Rare Earths Limited through their Health Physics Unit have been invaluable. |
References |
|