ISSN ONLINE(2319-8753)PRINT(2347-6710)
ISSN ONLINE(2319-8753)PRINT(2347-6710)
Akhil P Sivan, Jisha Johns, Prof. Jayasurya Venugopal
|
| Related article at Pubmed, Scholar Google |
Visit for more related articles at International Journal of Innovative Research in Science, Engineering and Technology
The logistics industry is competing in a changing and continuously challenging world. As our economy is moving into this new information age, logistics industries are facing a lot of challenges as well as opportunities. The advancement of E-commerce and evolution of new data sources like sensors, GPS, smartphones etc exploded the business with large amount of real-time and near real-time data. However, to deal with such a large amount of data and to gain business insights, logistics firms requires faster and comprehensive data collection and analytics technologies. This paved the way for Big data analytics on the logistic information. In this paper, we discuss the opportunities and analysis capability of technologies like Big Data and Hadoop for supporting the current ways of doing business and future innovation. Thus this paper presents a modern approach to information management and analytics in order to achieve operational efficiency for logistic firms.
Keywords |
| Big Data analytics, Hadoop Data Platform, Apache Hive, MapReduce. |
INTRODUCTION |
| Today Information Technology is playing vital role in bringing success to organizations. The increasing use of Information Technology (IT) is the result of a growing internet organization culture in which the business partners and customers have to be connected all the time. We can also see that the traditional business models have been changed to more decentralized and flexible business models that increase the use of IT. Also globalization is a main factor that influences the increased use of IT. The area of IT is always changing and at the same time challenging also. One of the latest developments in this area is the use of IT to enable business organizations to make more intelligent business decisions by providing more information to the managers or to help them in making better business decisions. This development started after the introduction of Business Intelligence with help of technological advancements in all the fields. It is now grown to a platform in which technology and the business merged together which is called Business Information Management Systems. And the Big Data is a latest development in this area. Though it has similarities with the Business Intelligence, in some aspects it is different. Since Big Data is a new development, it is a subject in which the organizations are currently interested to hands-on. However, it should be profitable for an organization to invest in such a technology. This research works determines how investing in BigData technologies can add business values to logistics and transportation industries. |
| Big Data has quickly transformed from the confined realm of a technology to become a business priority, that can provide solutions to the long-standing business challenges. It is powerful to transform the process, organization and even the entire industry itself. It helps to unlocks new insights which are inherent with the data. In fact, new technologies and data management frameworks are required to capture, store and analyze both structured and unstructured data from new data sources[11]. Big Data is characterized by the 3 V’s: Volume, Velocity and Variety, which the legacy systems based on related data bases cannot handle without sacrificing any ACID properties. Volume denotes the huge amount of data that Big Data denotes, whose starting point is from Terra Bytes(TB) and is varying depends on the scenario. Velocity denotes the rate at data gets generated from different sources like streaming of data from sensors and video cameras. Variety denotes the different data and file types that are available to process. So Big Data can efficiently deal with the sensor data from logistic vehicles in a way to gain business values by performance monitoring and improvement and advanced analytic capabilities[5]. |
| Big Data can broadly classified into two categories: Human generated digital foot prints (like data through social networking sites etc ) and machine data ( like log files saved by routers, switches, firewalls etc). A large part of these are unstructured data that Big Data can efficiently handle. Open source Hadoop has the biggest recognition in Big Data world which includes the components for solving issues of distributed data management and analysis[1]. |
| The various sensors, GPS system etc attached to logistic vehicles capture data and send it on timely manner to Data management servers. The clustered servers can extract various information with the help of distributed and fault tolerant computing environment provided by Hadoop[2]. A logistic firm can have thousands of vehicles sending Geographical information and sensor data. Streamlining the maintenance operations, decrease field cost are the targets of Big Data intelligence on Logistics. |
II. BIG DATA & ANALYTICS |
| The logistic industry is undergoing a fundamental shift from the product-related services to information related services. The demands and requirements are literally changing on a daily basis with the innovations in technologies with smart computing. Though these industries are into the area of real time tracking of vehicles, a large amount of data that is real time and near real time are literally bombarding the industry which demands more comprehensive technologies for data collection and analysis. Big Data comes into picture on such a kind of batch analysis to gain better insights that can benefit these firms to improve their daily operations and the future innovations. The logistic firms require more technical and technological supports to handle the three V’s of Big Data & analytics, that is Volume, Variety and Velocity. These firms are said to be having a logical change from providing product related services to information related services. The customers are empowered with always connected and intelligent information world, which changes the demands and communication requirements with technologies available[8]. So companies has to adapt and adopt to the changing customer demands and at the same time recognize the availability of new data sources and management frameworks. It can generate new sources of revenue for the company. |
| ïÃâ÷ Volume: In logistic industry, due to widespread digitization (like taking user signatures through smartphones and electronic billing information etc ), the data volume is growing in a great pace. |
| ïÃâ÷ Velocity: The amount of data getting accumulated at the servers is at higher rate taking the case of all vehicles of the company. |
| ïÃâ÷ Variety: Big data deals with both structured and unstructured data that involves different kinds of data have to be incorporated for analysis and getting insights. |
III. SYSTEM FRAMEWORK |
A. System architecture and components |
| The system architecture is created on the open source Apache Hadoop framework. Hadoop solutions are offered by companies such as Cloudera and Hortonworks. They offer open source implementations with commercial add-ons mainly focused on cluster management. Here we are using the Hortonworks Data Platform for the distributed data storage and processing. |
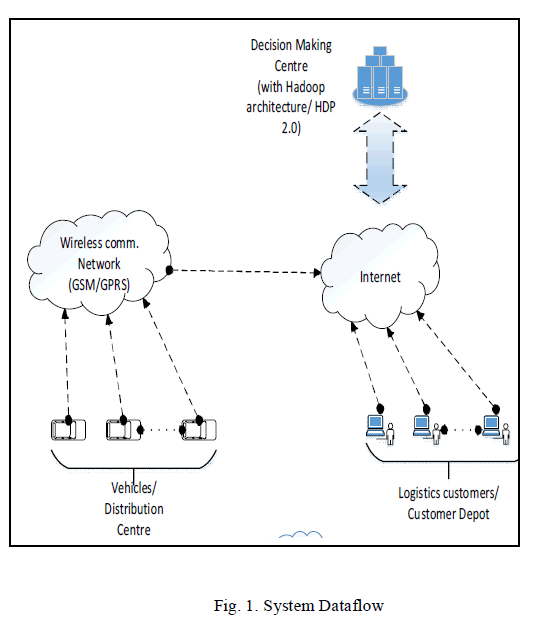 |
| The figure above shows the data flow in the proposed system. The data from vehicles will passing over wireless communication (GPRS) to the clustered servers at the data processing center. The major device attached to the vehicles will be a GPS device with a SIM facility, it will send different packets at time intervals with information about fuel, speed, hard acceleration etc[3]. On the out of coverage areas these packets will be queued by the device and send when comes in coverage. Special fields are there in packets indicating normal packets or queued packets. This unstructured data can be combined with structured data about vehicle details and driver information in the clustered server to gain insights to answer the different metrics designed for analysis. The analysis is done with the help of two basic functionalities provided by the Hadoop framework. Hadoop, in a nutshell, provides a reliable shared storage (HDFS) and an analysis system (MapReduce): |
| ïÃâ÷ MapReduce: A programming model for executing the tasks in parallel, which consists of two steps Map and Reduce[1]. In Map step, a problem is broken down into many small ones and then sent to servers for processing. In Reduce step, the results of the Map step are combined to create the final results of original problem. |
| ïÃâ÷ HDFS: A distributed file system that not only stores the data but also ensures fault tolerance through replication. |
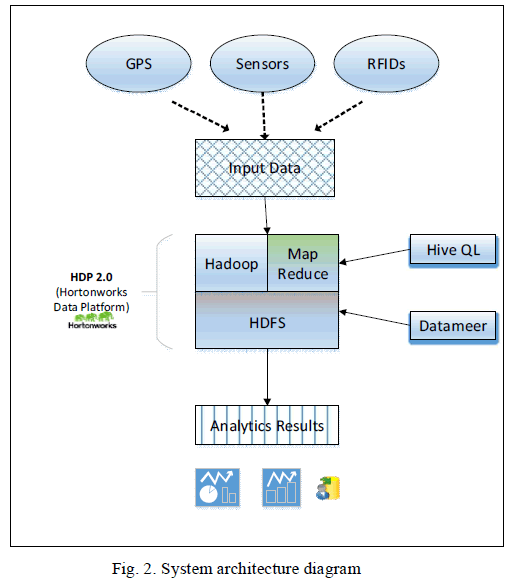 |
| The results of analysis can visualized with the help of data visualization tools like Excel PowerView, Tableau, Datameer etc through which the metrics used to perform analysis can be answered. The analysis may be performed on a weekly or monthly basis, which will be dealing with Terabytes of data. The insights which otherwise difficult to get can help the companies in optimizing the operational performance and reducing field operation cost. |
IV. OPERATION MECHANISMS |
| A sound decision making with the support of information from available geospatial and sensor data requires answering complex queries. And the amount of available data is being rapidly growing with the increasing dissemination of smart phones, digital sensors, social media etc. So analytics using Big Data and hadoop framework is of greater importance[8]. This paper demonstrates some of the opportunities. |
| Some of the metrics that can be applied on logistic information is given below: |
| ïÃâ÷ Which trucks are idling and wasting fuels |
| ïÃâ÷ Drivers with highest risk factor |
| ïÃâ÷ Trucks with worst gas mileage and where they are idling |
| ïÃâ÷ Monitor the driving behaviors to improve productivity. |
| ïÃâ÷ Negative driving patterns under control of drivers |
| Like this several metrics can be formulated to become the basis of our analytics. |
A. Tools and strategies |
| The customized hadoop ecosystem by hortonworks includes several tools for managing, controlling and processing the data stored in HDFS[1]. Other than MapReduce and HDFS, the major tools in the Apache hadoop ecosystem which are useful for our analytics are: |
| ïÃâ÷ Hive: It is a higher level abstraction of hadoop functionalities and a data warehouse system in which the user can specify instructions using the SQL-92 queries and will get converted to MapReduce tasks. |
| ïÃâ÷ Pig: Pig is another high-level abstraction of Hadoop which is similar to the functionality of Hive. But it uses a programming language called Pig Latin, and it is more oriented to data flows. |
| ïÃâ÷ HBase: HBase provides a secure, reliable and integrated tool for fault-tolerant columnar storage and also provides quick access to large quantities of sparse data. |
| ïÃâ÷ Zookeeper: It provides operational services for the hadoop cluster including the synchronization and configuration. Distributed applications use Zookeeper inorder to store and mediate updates to important configuration information. |
| ïÃâ÷ Sqoop: This is a tool designed for the efficient transfer of bulk data between Apache Hadoop and the relational databases. |
V. EXPERIMENTAL SETUP & RESULTS |
A. Getting the data |
| The input data samples are collected from a company providing real-time vehicle tracking services for logistics firms and other transportation companies. The current position of the vehicle was acquired by GPS device which is integrated in the target vehicle[3]. The various information from different sensors on the vehicle are also attached to these device. The location coordinates and other information are sent through GPRS service provided by the GSM network with different packets with identifiers. The different packets are identified as fuel packets, tracking packets, device info packets, door sensor packets etc containing corresponding information. These data are then sent using Get method of HTTP protocol, the data at server side are stored in a database tables and can be retrieved mainly for real-time tracking purposes. Different packets are sent at an interval of 2-3 seconds, and these data are getting collected at the server in a rapid pace. Each vehicle may sent around 2- 3 Mega Bytes per day on an average. A logistic firm having 100 trucks can get 300 MB per day and within a week it will get into GBs and in months will become TBs which gets into the realm of Big Data[12]. |
| Other than real-time tracking services these logistics firms are not focused on batch analysis of this large amount of raw data, which can unlock valuable insights beneficial for the company. Since it will require more time and efforts using traditional systems for such kind of batch analysis. And also traditional systems mainly dealt with more structured kind of data. So the purpose of this work is to explore the opportunities of Big Data analytics using Hadoop and MapReduce technology in the Logistics industry. |
| The data set used for the analysis purpose containing a sample data of tracking packet log files containing around 12 lakh records. The tracking packets have fields with different informations, though for the analysis purpose here we extract the vehicle/driver’s ID, latitude, longitude, speed, date, time etc. These information can lead us to the analysis of metrics discussed above. |
B. Loading the data |
| The input data containing a large number of small files are put together into a single large file. Since Hadoop is best suited for analyzing large data files. The data is then loaded into a Hortonworks sandbox which is single node hadoop cluster distribution package in pseudo-distributed mode. This hadoop distribution contains all the major tool under Apache Hadoop ecosystem like Hive, Pig, Sqoop, Hbase, Zookeeper etc. The data is then manipulated using Hive queries and the Pig Latin, based on our metrics chosen for analysis[10]. |
| To verify the results with Java MapReduce API, a separate single node Hadoop cluster is configured as pseudo-distributed mode in Ubuntu, which is the common hadoop package containing only HDFS and MapReduce. And separate MapReduce Jobs have been created for each of the metrics using Java. Eclipse IDE can be configured using plugin to integrate with Hadoop for creating Map Reduce jobs. Consider the following pseudo-code for calculating the risk factor of vehicle drivers. |
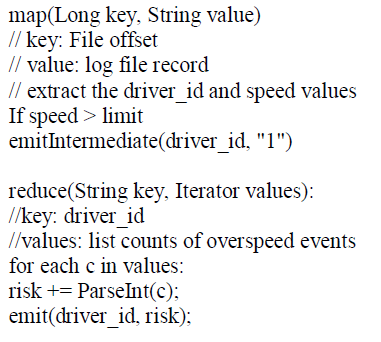 |
| The above pseudo-code is for calculating the risk factor of each driver based on counting the number of times overspeed recorded for the same driver_id. The map function[1] takes the file offset as key and each record on the log file as value. The record can be splitted to extract various fields, here the driver_id and speed value. For each speed value above a limit, the driver_id and count of 1 is emitted as map output. The map outputs then shuffled and sorted to make inputs for the reducer. The reduce function will take driver_id as key and list of value “1”. These values are then accumulated to determine the risk of each drivers. |
| Both the configurations have given the same input dataset for analysis and comparison of results. |
C. Visualization |
| The best way to express the results of Big Data analytics is through graphs and charts, to have a better understanding of the analysis. The major steps involved in Big Data Analytics are Loading the data, Refining the data and Visualizing the data. Here for visualizing the results we have used Microsoft Excel 2013 PowerView which is having a Hive ODBC connector for connecting to the sandbox and importing the results[5]. |
| Traditionally, the results of analysis were kept in spreadsheets or like tabular reports. But that makes it very challenging to find the trends, patterns and correlations exists in large set structured or unstructured data. Also the traditional spreadsheets alone are no longer adequate for processing and analyzing multiple sources of data which the enterprises want to deal with. This is where the data visualization comes into the picture. Visualization using tools like Excel PowerView, Tableau etc helps to communicate complex ideas or patterns with more clarity and precision. |
| The results from sandbox are visualized with the help of Microsoft Excel PowerView and compared with the results obtained from the MapReduce API for the same dataset. As mentioned above, each truck is assigned a sim number, which can also be used as a truck_id. |
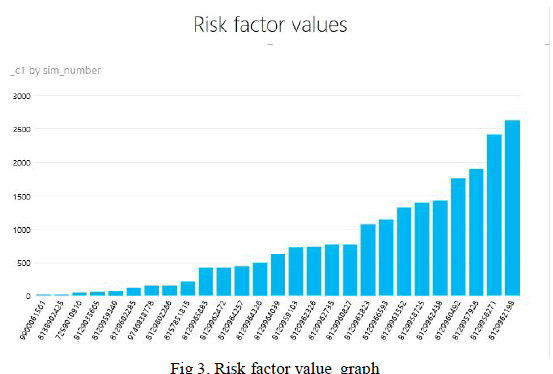 |
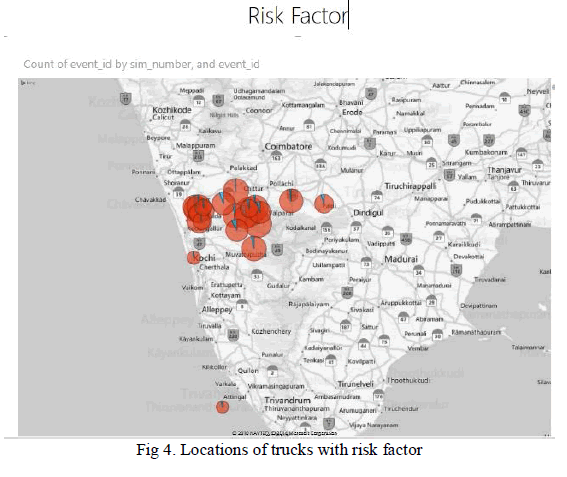
| The figure 3 above shows the risk factor values of each driver identifying the truck he drives by the sim number. So the company can better monitor the driver behavior pattern and performance. In the graph below shows where these trucks are running. |
| The figure 4 shows the risk factor calculation with the places through which the trucks are running. The blue color indicates the risk factor of each truck identified with sim number. So based on the risk factor calculation the company can keep track of the driver efficiency and improve the productivity. The company can monitor the performance of their truck drivers. |
 |
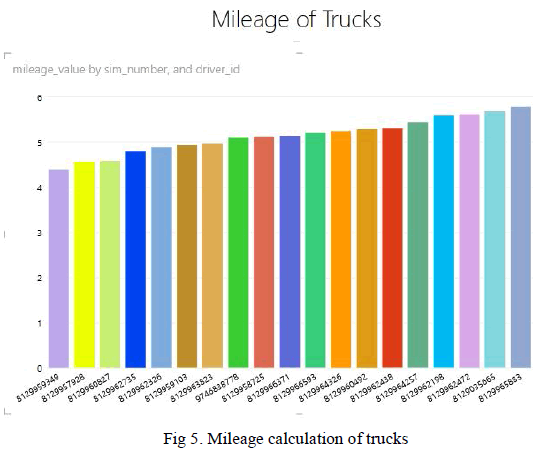
| The figure 5 shows the mileage of each trucks identified by the sim number. The calculation is based on the miles driven and fuel consumed for the period taken into analysis. This graph helps the logistic firm to identify the trucks wasting fuel or giving worst fuel efficiency for the company. For example, the company can identify the trucks gicing mileage below 5kms/ltr. And it is also possible to determine which route these trucks are usually running. |
 s s |
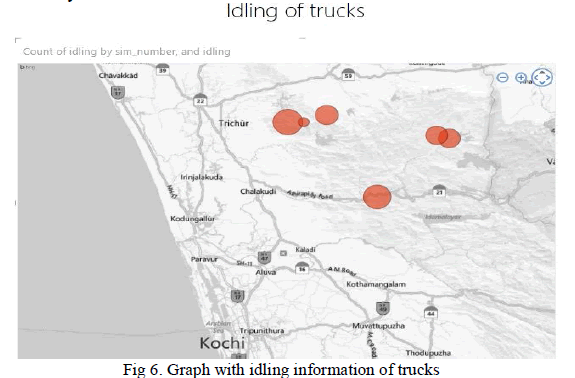
| The figure 6 shows the idling of trucks. By this graph we can see where those fuel wasting trucks are idling. The size of circle denotes the amount of idling done by the identified truck. So these kinds of visualization created from the large amount of unstructured data helps the logistic firms to reduce the operational cost. They can improve the driver efficiency, identify idling and wasting of fuels etc. This shows the opportunities of Big Data analytics in travel and transportation industry. |
 |
| Apart from these, separate MapReduce jobs are created using Java API as mentioned earlier to compare with the visualization results. A chain of four MapReduce jobs have been created for analyzing the same metrics on the same dataset. The results have been discussed below. |
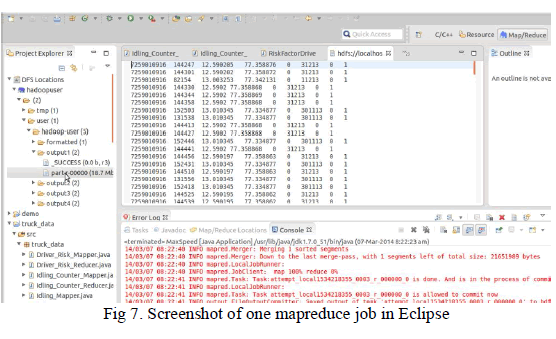 |
| The figure 7 shows the output of one MapReduce job that extracts the fields such as truck_id, time, latitude, longitude, speed, date etc and the last two fields having 0’s and 1’s indicates whether trucks overspeeded or idling based on the speed values. |
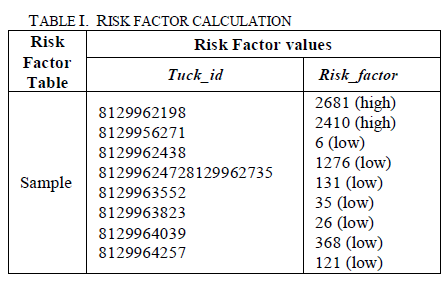 |
| The above table shows the output of the MapReduce job written in java for risk factor. This is a sample of output containing the truck with highest risk (truck_id: 8129962198) as shown in the visualization graph. The trucks with values more than 2000 is considered of high risks. The idling can also be obtained in the similar way with the latitude and longitude information. |
D. Comparing the results |
| Though sandbox could provide a hadoop distribution with tools configured to improve the flexibility in using Hadoop, direct coding using java MapReduce API seems like taking less execution time and provides us more flexibility in extracting the information we want for analysis. Chaining the MapReduce jobs can reduce the complexity. In sandbox, Hive and Pig Latin, are the tools used for interacting with Hadoop that provides the data access. So we can more focus on what we want to analyze rather than worrying about MapReduce jobs and key/value pairs. It also has other tools to ease working with Hadoop technology for Big Data analytics. But direct coding the MapReduce jobs provides better control over the data for analysis and gives better execution time on our environment. |
VI. CONCLUSION |
| The legacy systems cannot provide the visibility, insights, control and mobility required to succeed in today’s transportation and logistics industry. The logistic firms has to focus on enhancing good quality services by satisfying customer needs and at the same time adapting and adopting the required technological advances like Big Data analytics, which can have a lot of positive impacts for the company and also the economy. Through this work, we could study the feasibility of integrating Big Data analytics and hadoop framework for building up the intelligence in logistics industry. With the open source tools readily available, any Enterprise can adopt the secure and stable hadoop distribution. The insights based on the metrics can be found in more efficient way than legacy systems. So Big Data analytics is a fast growing area that spreads a wide variety of fields and in this paper we explored the opportunities in logistics industry. |
ACKNOWLEDGMENT |
| This study is done as a part of Master’s Degree dissertation work in Christ University, Bangalore, India. I would like to thank my guide for the support. |
References |
|