Research & Reviews: Journal of Chemistry
e-ISSN: 2319-9849
e-ISSN: 2319-9849
Nworie FS*, Nwabue FI, Akpa SO and Igidi OJ
Department of Industrial Chemistry, Ebonyi State University, Abakaliki, Ebonyi State, Nigeria
Received date: 05/03/2016; Accepted date: 23/05/2016; Published date: 27/05/2016
Visit for more related articles at Research & Reviews: Journal of Chemistry
A new method on solvent extraction combined with response surface methodology (RSM) modeling and optimization has been developed for the preparation and extraction of Fe(II) metal chelate based on the complexation of Fe(II) with bis(salicylidene)ethylenediamine(Salen). The RSM method based on a three level and five variable Box-behnken design (BBD) was employed to obtain the optimal combination of extraction conditions. Summarily, Fe(II)metal chelate was optimally prepared and extracted with 0.42% Salen concentration, 20 μg metal ion concentration, a temperature of 20°C, extraction time of 8.19 minutes, acid concentration of 10-4 M and one cycle extraction. The 3D response surface plot and the contour plot derived from the mathematical models were applied to determine the optimal conditions. Under the optimized conditions, the experimental value of 81% complex extracted was in close agreement with the value predicted (81.75%) by the model. Dynamic adsorption data were applied to pseudo-first–order and pseudo–second order rate equations. The time series data fitted well to pseudo-second order kinetic model. According to the correlation coefficients, the complexation adsorption of Fe(II) and Salen correlated well with Langmuir and Freundlich models. GC-MS, FT-IR and UV-vis data of the ligand and the complex were recorded and the data showed complexation between the ligand and the Fe(II) ion.
Solvent extraction, Adsorption-kinetic studies, Fe(II)metal-salen complex, Optimization, Spectroscopic methods.
The extraction of metal chelate is influenced by several factors that interact with each other such as concentration of metal ions, pH, time, concentration of chelating agent and temperature [1]. The conventional method of optimizing these parameters changes one independent variable while all other variables remain fixed or unchanged at the level in consideration. It has been noted [2] that the conventional method of single factor optimization does not show the combined effect of all the factors involved. In this regard, it is important to employ an experimental technique capable of evaluating the combined effects of the main parameters and their singular effects with minimal or reduced number of experiments [3]. Response surface methodology available as a software is a statistical tool used in modeling the relationship between one or two responses in the presence of number of quantitative factors which interact to give the optimum response expected. Studies [4] noted that response surface methodology (RSM is a collection of statistical and mathematical techniques important in the design, development and formulation of new products and in the improvement of product designs through optimization.
Box-behnken design approach a revolving and spherical design has been applied in optimization of media, and extraction of natural active substances [5-7], separation and extraction [8], derivatization reactions [9] and in chromatographic methods [10-12]. The application of multivariate techniques for optimization and simulation of analytical methods have increased in recent times and allows more efficient and easier arrangement and interpretation of experiment compared to conventional methods [13]. The preliminary assessment of experimental factors in analytical processes and determination of maximum and minimum values of the factors/critical conditions has been the main thrust of the multivariate techniques [14,15]. Box-behnken design which shows the relationship between one or more dependent variables and a number of input factors requires less number of experiments, forecasts response, shows interaction between multiple variable, searches relativity between multiple variables, less laborious, flexible and solves real response problems [7].
In Box-behnken design, the number of experiment (N) required is represented as N=K2+K+Cp, where Cp is the replicate number of the central point and K is a factor number. In general, the construction of mathematical and statistical models for prediction of target compound extraction and separation is a valuable tool in the field of chemistry [16,17]. Construction of models and modeling occupies significant role in optimization and simulation of extraction processes that is efficient and can lead to economical operation design [18,19]. Chemometric tools that have been applied for the determination and evaluation of equilibrium information such as stability constant through spectroscopic data analysis and kinetic processes include the factor or evolving factor analysis (EFA) [18].
Similarly, dynamic processes monitored spectrophotometrically has been analyzed using multivariate curve resolution alternating least squares (MCR–Als), an iterative soft modeling resolution method in processes such as chromatography, biomolecular reactions, voltammetric and environmental data treatment and in complex formation [19-22].
Solvent extraction has long been in use by chemists but only in recent time (years) has recognition been given to it as a powerful separation technique [23,24]. It is most widely used and studied for preconcentration, separation of elements, elimination of matrixes and differentiation of species. In recent time, it has become more useful because of the development of selective chelating agents for trace metal analysis [25]. If Chelate is formed as the case of bis(salicylidene) ethylenediamine with transition metals which is the case under study, spectrophotometric method can be employed in the analysis of the extracted species [1]. The advantage of this method in complex formation and extraction is that it is simple, convenient, cheap, rapid and co-precipitation precluded routinely encountered in precipitation separations [25].
Bis(Salicylidene) ethylenediamine and metal complexes has long been studied due to their important applications as efficient electrolyte in dye sensitized solar cells [26], as catalyst for liquid amine systems [27], in cell apoptotic and antitumor activities [28,29], in the preconcentration and determination of metal ions [30], in electrocatalytric reduction of CO2 [31], in Polymeric membrane electrode [32], in handling array of disease states emanating from reactive oxygen species and augmenting immune defense systems [33,34], in red phosphorescent light emitting diodes [35], as metallomesogens [36], in catalytic reactions [37] and other miscellaneous applications [38-40].
To understand vividly the dynamics of the preparation and extraction of metal chelate using Salen as ligand from aqueous acid solution, the major parameters influencing the complexation and extent of extraction and optimum conditions needed for the complex extraction by varying experimental conditions or variables were modeled.
Till date from accessed literature, there has not been established data on the modeling of metal chelate extraction using Box Behnken design a response surface methodology approach. This study therefore is aimed at applying Box Behnken design a response surface methodology approach to model and optimize Fe(II)metal chelate extraction. The important variables such as time for extraction, acid concentration, metal concentration, ligand concentration and temperature were systematically analyzed using Box Behnken design.

Scheme 1: Structure of Bis(salicylidene)ethylenediamine.
Reagents and equipment
All reagents were of analytical grade (Merc, Germany) and used without further purification unless otherwise mentioned. All aqueous solutions were prepared in distilled demineralized water. Working solutions were prepared by dilution as required. Electronic spectra in DMF was done with Genesis 10S UV-vis Spectrophotometer while FT-IR was done with Perkin-Elmer FTIR- 8400S Fourier transform infrared spectrophotometer (Shimadzu, Japan) in the range of 4000-400 cm-1 in KBr using nujol mull as the mulling agent while mass spectra analysis was executed using mass spectrophotometer (GC-MSQ2010 Plus Shimadzu, Japan) coupled with gas chromatograph by electron ionization at injection temperature of 250°C, solvent cut time of 2.50 minutes and ionization energy of 70 eV. The melting point of the ligand and complex was effected using Gallenkamp electrothermal melting point apparatus. The standard stock solution of Fe(II) (100 mg/L) was prepared by dissolving appropriate amount of Ammonium ferrous sulphate hexahydrate in distilled deionized water. 2M solutions of HCl was prepared by dissolving requisite amount in distilled deionized water, volume made up to 1 dm3 and standardized using sodium trioxocarbonate(IV).
Synthesis of bis(salicylidene) ethylenediamine
Ethylenediamine (22.475 g) was gradually added with stirring to 91.336 g of salicyladehyde in a 500 mL beaker. Initially, a yellow hot mixture resulted and stirring continued until crystallization started leading to formation of golden yellow cake [1]. The product was recrystallized twice from carbon tetrachloride to give the golden yellow crystals [64.45% yield, M.P 121 ± 1°C]. The reagent is used as a freshly prepared 0.5% Salen- ethanol solution.
Experimental procedures (Chemometric studies)
Batch equilibration method was used for the optimization process according to the Box-Behnken design matrix illustrated in Table 1. For this, an aliquot of a sample solution containing 100 μg of metal (Fe (II)) was transferred into a series of 20 mL calibrated extraction bottle, 1 mL of acid solution of concentration range 0.0001-2 M was added followed with addition of 0.2 mL of ligand solution (Salen). Volume was made up to 5 mL with acid solution and maximum time for color development as determined from kinetic studies allowed and 5 mL chloroform added. The phase was agitated at 500 rpm (such that further increase in speed has no effect on mass flow) and then allowed to settle, centrifuged and separated and the amount of metal complexed determined spectrophotometrically.
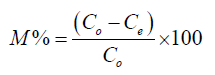
The amount of metal complexed with the ligand qe (μg) was determined using the equation
 (1)
(1)
Where Co is initial metal concentration, Ce is the equilibrium metal concentration, V is the volume of metal solution and M is the mass of ligand. The percentage of metal complexed was calculated as the ratio of difference in initial and final metal concentrations.
 (2)
(2)
Preparation of metal complex
An aliquot of a sample solution containing 100 μg of Fe (II) was transferred into a 20 mL calibrated extraction bottle, 1 mL of acid solution of concentration 0.0001 M was added followed with addition of 0.2 mL of ligand solution, volume was made up to 5 mL with acid solution, 5 minutes for colour development allowed and 5 mL chloroform added. The phases were centrifuged, separated and the red coloured metal chelate allowed to dry, recrystallized using carbon tetrachloride and kept for further analysis (yield 45%; M.P>300°C).
Box-behnken experimental design
After preliminary determination of the range of extraction variables through single factor text, the optimization of extraction efficiency experiment was done according to the experimental design obtained from Box-Behnken design with five variables at three levels each using Design Expert software version 8.0.7.1 (Stat-ease Inc., USA, 2011). The effect of extraction time (A), Acid concentration (B), Temperature (C), Metal concentration (D) and ligand concentration (E) on the amount of complex extracted were investigated at the ranges presented in Table 1 in the form of original values of each factor(uncoded) and their corresponding coded levels. The experimental plan in coded and uncoded form of the response variables is shown in Table 2. A total of 46 experiments with various combinations of metal ions aqueous solution, Salen ligand in ethanol, acid concentrations in aqueous phase, temperature and extraction time were conducted randomly to minimize the effect of extraneous variables. All the experiments were in duplicate and average values of the amount of chelate extracted tabulated as represented in Table 2.
| Coded values | -1.000 | 0.000 | +1.000 |
|---|---|---|---|
| A (Seconds) | 1.00 | 8.00 | 15.00 |
| B (M) | 0.50 | 0.25 | 0.0001 |
| C (°C) | 20.00 | 30.00 | 40.00 |
| D (µg) | 5.00 | 12.50 | 20.00 |
| E (%) | 0.05 | 0.525 | 1.00 |
Table 1: Range of different variables for metal chelate extraction using Response surface methodology (RSM) in coded and uncoded form.
| Expt. | Factor 1 | Factor2 | Factor3 | Factor4 | Factor5 | Amount extr |
|---|---|---|---|---|---|---|
| A:Time | B:Acid | C:Temp | D:Metal | E:Ligand | ||
| 1 | 1 | 0.0001 | 30 | 12.5 | 0.525 | 43.39 |
| 2 | 15 | 0.0001 | 30 | 12.5 | 0.525 | 40.95 |
| 3 | 1 | 0.5 | 30 | 12.5 | 0.525 | 6.23 |
| 4 | 15 | 0.5 | 30 | 12.5 | 0.525 | 8.63 |
| 5 | 8 | 0.25 | 20 | 5 | 0.525 | 9.49 |
| 6 | 8 | 0.25 | 40 | 5 | 0.525 | 6.38 |
| 7 | 8 | 0.25 | 20 | 20 | 0.525 | 19.87 |
| 8 | 8 | 0.25 | 40 | 20 | 0.525 | 6.55 |
| 9 | 8 | 0.0001 | 30 | 12.5 | 0.05 | 44.07 |
| 10 | 8 | 0.5 | 30 | 12.5 | 0.05 | 2.59 |
| 11 | 8 | 0.0001 | 30 | 12.5 | 1 | 37.86 |
| 12 | 8 | 0.5 | 30 | 12.5 | 1 | 9.11 |
| 13 | 1 | 0.25 | 20 | 12.5 | 0.525 | 9.93 |
| 14 | 15 | 0.25 | 20 | 12.5 | 0.525 | 10.86 |
| 15 | 1 | 0.25 | 40 | 12.5 | 0.525 | 2.39 |
| 16 | 15 | 0.25 | 40 | 12.5 | 0.525 | 1.938 |
| 17 | 8 | 0.25 | 30 | 5 | 0.05 | 1.75 |
| 18 | 8 | 0.25 | 30 | 20 | 0.05 | 7.49 |
| 19 | 8 | 0.25 | 30 | 5 | 1 | 2.45 |
| 20 | 8 | 0.25 | 30 | 20 | 1 | 6.58 |
| 21 | 8 | 0.0001 | 20 | 12.5 | 0.525 | 67.27 |
| 22 | 8 | 0.5 | 20 | 12.5 | 0.525 | 0.58 |
| 23 | 8 | 0.0001 | 40 | 12.5 | 0.525 | 26.5 |
| 24 | 8 | 0.5 | 40 | 12.5 | 0.525 | 24.01 |
| 25 | 1 | 0.25 | 30 | 5 | 0.525 | 4.66 |
| 26 | 15 | 0.25 | 30 | 5 | 0.525 | 3.76 |
| 27 | 1 | 0.25 | 30 | 20 | 0.525 | 7.82 |
| 28 | 15 | 0.25 | 30 | 20 | 0.525 | 9.53 |
| 29 | 8 | 0.25 | 20 | 12.5 | 0.05 | 9.61 |
| 30 | 8 | 0.25 | 40 | 12.5 | 0.05 | 0.04 |
| 31 | 8 | 0.25 | 20 | 12.5 | 1 | 8.5 |
| 32 | 8 | 0.25 | 40 | 12.5 | 1 | 1.41 |
| 33 | 1 | 0.25 | 30 | 12.5 | 0.05 | 0.88 |
| 34 | 15 | 0.25 | 30 | 12.5 | 0.05 | 0.27 |
| 35 | 1 | 0.25 | 30 | 12.5 | 1 | 0.73 |
| 36 | 15 | 0.25 | 30 | 12.5 | 1 | 0.44 |
| 37 | 8 | 0.0001 | 30 | 5 | 0.525 | 30.57 |
| 38 | 8 | 0.5 | 30 | 5 | 0.525 | 22.78 |
| 39 | 8 | 0.0001 | 30 | 20 | 0.525 | 62.83 |
| 40 | 8 | 0.5 | 30 | 20 | 0.525 | 0.59 |
| 41 | 8 | 0.25 | 30 | 12.5 | 0.525 | 19.09 |
| 42 | 8 | 0.25 | 30 | 12.5 | 0.525 | 19 |
| 43 | 8 | 0.25 | 30 | 12.5 | 0.525 | 19.5 |
| 44 | 8 | 0.25 | 30 | 12.5 | 0.525 | 19.08 |
| 45 | 8 | 0.25 | 30 | 12.5 | 0.525 | 19.1 |
| 46 | 8 | 0.25 | 30 | 12.5 | 0.525 | 19.1 |
Table 2: Amount of chelate extracted at different factor combinations for coded and uncoded values.
Statistical analysis and optimization
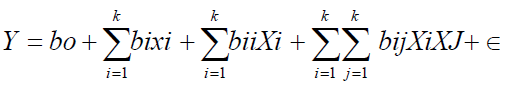
While holding the values of other response variables constant, response surface and contour plots were generated for different interactions of any two independent variables. Three dimensional surfaces like that of response surface and contour plots could give useful and accurate geometrical representation and yield valid information about the behavior of a given system in consideration under the experimental design [2]. The data were fitted to a quadratic polynomial model to generate regression coefficients, standard errors and significance. The non linear computer generated quadratic model which explained the behavior of the system is as
 (3)
(3)
Where y is the predicted/estimated response (amount extracted), bo is the offset term (regression coefficient for intercept), bi the linear effect (regression coefficient for linearity), bii the squared effect (regression coefficient for square)and bij the interaction effect (regression coefficient for interaction. Xi, Xj is the ith independent variable (independent coded variables) and Σ the random error which is the allowable uncertainties, discrepancies or defects between predicted and measured values. The fitness of the polynomial model was evaluated by the coefficient of regression R2 while F-test and P-value checks the significance of the regression coefficient. The data obtained were expressed as means of three replicate determinations.
Analysis of variance (ANOVA) was used to evaluate the model and interactions of the five factors on the extraction of metal chelate through identification of the coefficients of each term in equation (1). The fitting of the models were determined and optimum level of response variables for maximum extraction determined. Model terms were accepted or rejected based on the probability value with 95% confidence level [2].
Predicted model and statistical analysis
The predicted response Y for the quantity(%) of metal chelate extracted explained the role of each response variable and their quadratic interaction on the quantity of metal chelate extracted. The following second order polynomial equation in term of the coded values was developed through multiple regression analysis on the experimental data.
Amount extracted=19.15+0.022A–17.43B–4.18C+2.46D+0.024E+1.21AB–0.33AC+0.65AD+0.080AE+16.05BC– 13.61BD+3.18BE–2.55CD+0.62CE–O.040DE–8.57A2+14.40B2-4.16C2-4.34D2–10.12E2 (4)
Where A, B, C, D, and E are coded variables for extraction time, acid concentration, temperature, metal concentration and ligand concentration respectively.
The significance of each coefficient was determined by F-value and P-value from the statistical testing of the model performed in the form of analysis of variance (ANOVA) and results are presented in Table 3. The term having P>F values less than 0.05 are significant, P value greater than 0.1 indicates an insignificant model term but generally the smaller the magnitude of p values, the more significant the correlation with the corresponding coefficient [41].
| Model Term | Sum of Squares | df |
Mean Square | FValue | p-value Prob>F |
|---|---|---|---|---|---|
Model |
11861.29 |
20 |
593.06 |
7589.93 |
<0.0001 |
A |
7.57E-03 |
1 |
7.57E-03 |
0.097 |
0.7582 |
B |
4862.27 |
1 |
4862.27 |
62226.46 |
<0.0001 |
C |
279.66 |
1 |
279.66 |
3579.02 |
<0.0001 |
D |
97.12 |
1 |
97.12 |
1242.94 |
<0.0001 |
E |
9.03E-03 |
1 |
9.03E-03 |
0.12 |
0.7368 |
AB |
5.86 |
1 |
5.86 |
74.95 |
<0.0001 |
AC |
0.48 |
1 |
0.48 |
6.11 |
0.0206 |
AD |
1.7 |
1 |
1.7 |
21.79 |
<0.0001 |
AE |
0.026 |
1 |
0.026 |
0.33 |
0.5722 |
BC |
1030.41 |
1 |
1030.41 |
13187 |
<0.0001 |
BD |
741.2 |
1 |
741.2 |
9485.75 |
<0.0001 |
BE |
40.51 |
1 |
40.51 |
518.48 |
<0.0001 |
CD |
26.06 |
1 |
26.06 |
333.52 |
<0.0001 |
CE |
1.54 |
1 |
1.54 |
19.68 |
0.0002 |
DE |
0.65 |
1 |
0.65 |
8.29 |
0.008 |
A2 |
640.28 |
1 |
640.28 |
8194.13 |
<0.0001 |
B2 |
1809.02 |
1 |
1809.02 |
23151.46 |
<0.0001 |
C2 |
150.69 |
1 |
150.69 |
1928.53 |
<0.0001 |
D2 |
164.46 |
1 |
164.46 |
2104.72 |
<0.0001 |
E 2 |
893.39 |
1 |
893.39 |
11433.39 |
<0.0001 |
Residual |
1.95 |
25 |
0.078 |
|
|
Lack of Fit |
1.8 |
20 |
0.09 |
2.83 |
0.1257 |
Pure Error |
0.16 |
5 |
0.032 |
|
|
Cor Total |
11863.25 |
45 |
|
|
|
Std. Dev. |
|
|
0.28 |
R2 |
0.9998 |
Mean |
|
|
14.7 |
Adj R2 |
0.9997 |
C.V. % |
|
|
1.9 |
Pred R2 |
0.9994 |
Table 3: ANOVA for Response Surface Quadratic Model.
The quadratic regression model indicate the value of coefficient of determination (R2) of 0.9998 for the response (P ≤ 0.05) showing a good agreement between predicted values and experimental results. The R2 value indicated that the calculated model was able to explain 99.98% of the results. The result showed that the model for response variable was significant (P<0.0001) and adequate to represent the relationship between the response and the process variables (independent variables) [42,43]. The difference between adjusted R2 and predicted R2 is 0.003 which implies that the values of the models are in good agreement. The lack of fit F-value of 2.83 for the metal chelate extraction implies that it is not significant relative to the pure error and authenticates the significance of the calculated model towards best fit as shown by R2 value. Thus, at P>0.05, there is no significant lack of fit.
The F-test also a measure of significance indicated that the model has a very high model F–value (F=7589.93). R2 adj (adjusted coefficient of determination) a correlation measure for testing of goodness of fit of a regression equation [43,44] has a value of 0.9997 obtained from the model and indicated that only 0.03% of the total variations were not explained by model. A relatively lower value of the coefficient of variable (CV=1.90%) indicated a better precision and reliability of the experiments carried out [2,43]. The significance of each coefficient was determined using F-value and P-value and the results are presented in Table 3. From the result, it could be seen that the amount of complex extracted was affected significantly by all the five extraction parameters with the exception of time for extraction and ligand concentration (P<0.0001). This was also observed in the laboratory work as the extraction was rapid without significant change in quantity extracted over equilibration time and also the ligand solution added within the range of concentration studied.
From Table 3, it is also evident that all the quadratic parameters except AE (time of extraction and ligand concentration (P<0.0001) were significant whereas the interaction parameters were all significant (P<0.0001). This means that all the factors must combine for effective formation and extraction.
Optimization of extraction parameters/amount extracted
The relationship between dependent and independent variables which illustrated change in levels of two factors with the other three factors maintained at zero are graphically represented by 3D response surface and 2D contour plots generated by the model (Figures 1-6).

Figure 1: Response surface plot and contour plot of extraction time and temperature.

Figure 2: Response surface plot and contour plot of extraction time and metal concentration.

Figure 3: Response surface plot and contour plot of extraction time temperature.

Figure 4: Response surface plot and contour plot of temperature and metal concentration.

Figure 5:Response surface plot and contour plot of temperature and ligand concentration.
-5-2-13-g006.png "Journal-of-Chemistry-ligand-concentration(2)")
Figure 6: Response surface plot and contour plot of metal concentration and ligand concentration.
The shape of the contour determines the types of interaction between the corresponding variables. Elliptical contour indicate that the interactions between the corresponding variable is significant whereas circular contour plots indicated that the interaction is negligible [7,43].
Figure 1 described the effect of time of extraction and temperature (C) on the amount of complex extracted. Increase of time from 1-10 minutes improves the amount of chelate extracted but above 10 minutes of shaking, there is no observed change in the quantity extracted. The effect of temperature from the graph shows that as temperature is varied from 20-30°C quantity extracted increased but above 30°C there is a decrease in the quantity extracted possibly because of complex degradation at high temperature seen in Salen compounds [45]. Figure 2 showed the effect of time of extraction and metal concentration on the quantity of chelate extracted. Increase in metal concentration from 5 μg to 15 μg increased the amount of chelate extracted. However, above 15 μg of the metal, there is no significant increase in the chelate extracted. This could be attributed to the fact that at high concentration of the metal with the same quantity of ligand the complexation is hindered as there is unavailability of ligand for complexation. Figure 3 illustrated the effect of time of extraction and ligand concentration (E) on the amount of chelate extracted. The efficiency of analyte extraction was dependent on Salen concentration. The extraction efficiency increases with an increase in ligand concentration and leveled off at concentration greater than 2.2 × 10⁻⁴ mol/L (0.3%). A concentration of 4.73 × 10⁻⁴ mol/L (0.5%) Salen solution was used in the experiment. This is so because the concentration of chelating agent greatly affects extraction efficiency in solvent extraction since excess chelate can form a stable and stoichiometric metal chelate.
Therefore, if the amount of chelate is not enough to form complex with metal ion, error should occur [46]. Increase in the ligand concentration from 0.05–0.439%, improves the amount of chelate extracted. However, when the ligand concentration is above 0.62%, there is no further increase in the amount of chelate extracted. This could be that the metal has reached its co-ordination number and as such, no more binding sites for the ligand to ligate to the metal ions in solution.
Figure 4 illustrated the effect of temperature and metal concentration on the amount of chelate extracted. The temperature was varied from 15 to 40°C, the absorbance is at a maximum and constant between 27 and 34°C. All determination was done at room temperature (27 ± 1°C). There is observed increase in the amount of chelate extracted as temperature increased from 20°C to 30°C and decreased as temperature moved from 30°C to 40°C. At low metal concentration of 15-20 μg there is observed decrease in the amount of complex extracted as complex formation is hindered. Figure 5 showed the effect of temperature and ligand concentration on the amount of complex extracted. Amount of chelate increased as temperature was varied from 20 to 30°C and decreased afterwards.
Figure 6 illustrated the effect of metal concentration and ligand concentration on the amount of chelate formed. The amount of complex extracted increased as metal concentration increase from 5-15 μg. Above 15 μg, the amount extracted decreased whereas the amount extracted increased with increase in the ligand concentration (chelation) until about 0.43% when a decreased amount of chelate extracted was observed (Table 4).
| Factor | Name | Optimum level |
|---|---|---|
| A | Time | 8.19 |
| B | Acid Conc. | 0.0001 |
| C | Temperature | 20 |
| D | Metal Conc. | 20 |
| E | Ligand Conc. | 0.42 |
| Amount Extracted | 81.7572 ± 0.28 |
Table 4: Optimum conditions for the extraction of metal chelate.
Verification of predicted model
To determine conditions that gave the maximum extracted complex is the aim of optimization. The software generated the optimum time of extraction, acid concentration, temperature, metal concentration and ligand concentration was 8.19 minutes, 10-4 M, 20°C, 20 μg and 0.42% respectively. The software predicted amount of chelate was 81.75 ± 0.28%. Table 4 shows the optimum conditions for the extraction of the metal chelate where three parallel experiments were carried out. Comparing with the value predicted by design expert 7.1.6, the results showed that the actual value of 81% chelate extracted was very close to the predicted results. As illustrated in Figure 7 and the experimental (actual) values was compared with the predicted values calculated from the model. There is no significant difference between the experimental values and the predicted values and as such the optimization achieved in this study is reliable. Also, the absolute value of the relative error was found to be lower than 2% for the amount of chelate extracted. This is an indication that the system modeling is appropriate, adequate and fulfils the aim of the optimization.

Figure 7: Comparison between predicted values and experimental/actual values.
Effect of temperature
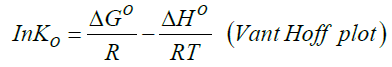
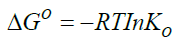
Figure 8 shows the effect of temperature on the complexation adsorption of metal ions on ligand salen. The figure clearly indicated that the complexation process increase with temperature increase. The increased adsorption/complexation of the metal ions to the ligand at increasing temperature shows that the adsorption process may be endothermic [47]. The thermodynamic parameters of adsorption and complexation such as enthalpy (ΔH0), entropy (ΔS0), Gibb’s free energy (ΔG0) and stability constant (βn) are listed in Table 5. The parameters are calculated from the variation of the thermodynamic equilibrium constant, K0 at different temperatures. Consequently,

Figure 8: Vant Hoff plot of the temperature dependence of complexation.
| Metal complexed | T(K) | InK0 | βn | ∆G0(K,Mol-1) | ∆H0(Kj Mol-1) | ∆S(KjMol-1K-1) |
|---|---|---|---|---|---|---|
| Fe(II) | 288 293 293 303 308 313 |
4.18 4.056 3.94 3.17 3.112 2.94 |
1.814 1.76 1.71 1.38 1.35 1.27 |
-10.00 -9.88 -9.76 -7.98 -7.96 -7.65 |
4988.2 | -13.036 |
Table 5: Thermodynamic parameters.
 (5)
(5)
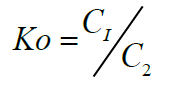
Where C1 is the amount of metal ion adsorbed /complexed per unit mass of ligand and C2 is the concentration of metal ion in the aqueous phase [48].
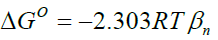
Standard enthalpy change of adsorption or complexation (ΔH0) and the standard entropy change of adsorption or complexation (ΔS0) were calculated as shown in equation 5 and graph presented in Figure 9. The standard free energy changes (Gibb’s free energy) of adsorption or complexation (ΔG0)and stability constant for complexation formation (βn) were determined according to equations 6, 7 and 8.

Figure 9: Langmuir isotherm model.
 (6)
(6)
 (7)
(7)
 (8)
(8)
T represents the temperature in K while R is the universal gas constant (KJ Mol-1k-1). The thermodynamic values determined for 20 μg of initial metal ion concentration and ligand dose/concentration of 0.5% at HCl concentration of 10-4 M were given in Table 5.
From Table 5, Gibb’s free energy change values were found to be negative indicating the feasibility and spontaneity of the adsorption or complexation. The positive sign of enthalpy change confirmed that the adsorption or complexation process is endothermic. The negative value of entropy change shows that the adsorption process or complexation involves a solvation process [48]. Similarly the values of stability constants indicated that Fe(II) complex is stable [49].
Adsorption isotherms
Designing adsorption or complexation processes requires adsorption isotherms as the adsorption capacity of the adsorbent or ligand is provided under the conditions studied. Notwithstanding the varieties of adsorption isotherm models, this study employed the most frequently used models for expressing non linear relationship between the metal ion adsorbed or complexed on the ligand or adsorbent and the metal ion left in solution, Langmuir and Freundlich adsorption isotherms. The choice of the two parameter models lies on the fact that they are simple and provide explicit description of experimental behaviour in a large range of conditions under operation [47,50].
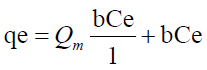
Langmuir model is expressed by the equation
 (9)
(9)
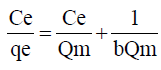
Ce (μg) is the equilibrium concentration of the adsorbate metal ion Qe (μg) is the amount of adsorbate (metal ion) per unit mass of ligand (adsorbent) Qm and b are Langmuir constant which denotes sorption capacity /complexation capacity and rate of sorption /rate of complexation respectively. The values of Qm and b are graphically determined from the linear form of Langmuir model as illustrated in equation 9 graphically shown in Figure 9 and the values shown in Table 6.
| Langmuir parameter | Freundlich parameter | ||
|---|---|---|---|
| Qm | 0.0031 | KF | 0.0542 |
| B | 0.985 | N | 0.9669 |
| R2 | 0.9653 | R2 | 0.9999 |
Table 6: Langmuir and Freundlich isotherm model constants for metal adsorption or complexation.
 (10)
(10)
The complexation ability or affinity between the metal ions and the ligand (salen) can be predicted using the Langmuir parameter b in deriving the dimensionless separation factor RL [48] as expressed in equation 11
 (11)
(11)
Co is the initial metal ion concentration and b the Langmuir isotherm model constant. Studies (47) have shown that the value of RL indicates the types of isotherm to either be favoruable (O<RL<1), unfavourable (R1>1) and irreversible (R1=0).
The RL values for the metal ion adsorption or complexation on Salen Ligand as shown in Table 7 indicated that the adsorption or complexation process is favourable as it lies between 0 and I.
| Pesudo first order | Pseudo second order model | |
|---|---|---|
| K1 | -0.1793 | 0.0472 |
| R2 | 0.6634 | 0.9984 |
Table 7: Lagergren pseudo first order and pseudo second order model for adsorption of metal ion to ligand.
Freundlich Isotherm model is expressed by the equation
 (12)
(12)
where n is the adsorption intensity and KF the adsorption capacity. KF and n are constants obtained as the intercept and slope of the linear plot of Inqe against InCe of Freundlich model.
 (13)
(13)
The linear Freundlich adsorption isotherm model parameters are evaluated from the plots in Figures 9 and 10 and are presented in Table 8. The adsorption of metal ions on the ligand salen correlated well with both Langmuir (R2=0.9653) and Freundlich (R2=0.9999) adsorption isotherm according to correlation coefficient as presented in Table 8.

Figure 10: Freundlich isotherm model.
| Metal concentrations | Fe(II) |
|---|---|
| 5 | 0.20 |
| 10 | 0.10 |
| 15 | 0.06 |
| 20 | 0.05 |
Table 8: Dimensionless separation factor (RL) values for metal adsorption/complexation by ligand.
Adsorption kinetics
The kinetics experiment for the adsorption of metal ions to the ligand(salen) were carried out for different contact time (1, 3, 5, 10 and 15 minutes) with constant adsorbent or ligand concentration (0.5%) and acid concentration of 10-4M solution of HCl. From the graphs as shown in Figure 11 it could be seen that a contact time of 5 min was sufficient to achieve equilibrium of Fe(II), metal ion complexation onto Salen ligand and this time was fixed for further studies.

Figure 11: FTIR Spectra of salen ligand.
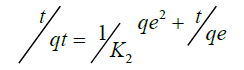
To analyze the kinetic models, two commonly used kinetic models were applied on the adsorption or complexation data; Lagergren Pseuo-first–order model and Pseudo-second–order represented as Equation 13 and 14 respectively.
 (14)
(14)
 (15)
(15)
qe is the amount of metal ion adsorbed or complexed with salen ligand at equilibrium (μg) and qt is the amount (μg) of metal adsorbed at time t (min) whereas K1 and K2 are rate constants of Pseudo-first order and second–order models respectively. A linear plot of In(qe-qt) versus t for Pseudo-first–order model (Figure 12) and t/qt versus t for second–order–model (Figure 13) clearly described the pertinence of the models with the slopes as K1 and K2 respectively. Based on the high regression coefficient of the metal ions complexation or adsorption on salen ligand as observed from the Pseudo-second–order kinetic model (R2=0.9984) for Fe(II) as against Pseudo-first–order kinetic model (R2=0.6634) for Fe (II), the adsorption or complexation is best described by the Pseudo–second–order kinetic model.

Figure 12: Pseudo–first order kinetic model.

Figure 13: Pseudo-second order kinetic model.
FT-IR, UV-Vis and GC-MS studies
FT-IR of Salen ligand (KBr, cm-1): v(0H)3402, v(C-H)3042, v(C=C)1494, v(C-N)1416, v(C=N)1615, v(C-O)1285.
FT-IR of Fe(II) salen complex (KBr, cm-1): v(0H)3404, v(C=C)1540, v(C-N)1451, v(C=N)1623, v(C-O)1302, v(Fe-N)410, v(Fe-O)599.
UV-Vis spectra of salen (in ethanol, nm): 265, 285, 335/355, 400.
Fe(II) Salen (in ethanol, nm): 265, 285 and 300.
The FT-IR spectra of the ligand showed broad band at 3401 cm-1 due to the stretching vibrations of phenolic hydroxyl group a consequence of intermolecular hydrogen bonding between the azomethine group and the phenolic group and which is also present in the metal complex at 3404 cm-1 as only one phenolic group from the Salen moiety was deprotonated at acid concentration of 10-4M [51,52]. The bands at 3042 cm-1 in the ligand is assigned to vibrational motions of the aromatic C-H. The strong band observed at 1615 cm-1 is assigned to the stretching vibrations of the C=N azomethine group which shifted to higher frequencies v(1623 cm-1) on chelation suggesting co-ordination of the ligand with the metal ion through the N2O2 donor atom set of the tetradentate Schiff base [52,53]. The weak peak band at 1285 cm-1 region is assigned to C-O stretching frequency which on complexation shifted to higher frequency of 1302 cm-1 an indication of complexation to metal ion through the phenolic oxygen atoms. The bands at 1416 cm-1 region assigned to C-N stretching frequency shifted to higher frequency of 1451 cm-1 a positive inductive effect on the C-N bands and an indication of metal bonding to nitro atom [54]. The appearance of new bands at 410 cm-1 and 599 cm-1 are due to Fe-N and Fe-O vibrations and are absent in the ligand an indication of co-ordination of the metal to N and O atoms of the phenolic group. The FTIR spectrum of the ligand and the complex is shown in Figures 11 and 14.
salen-complex-5-2-13-g014.png "Journal-of-Chemistry-Fe(II)salen-complex")
Figure 14: FTIR spectra of Fe(II)salen complex.
The absorption spectra of Salen shows four bands at 265, 285, 355 and 400 nm assigned to the intraligand electronic Π-Π* and n-Π* transitions respectively [29]. In the complex, the absorption peaks appeared at 265, 285 and 300 nm assigned to n-Π* transitions and ligand to metal charge transfer (LM-CT) respectively [50]. There is observed shift in the wavelength to lower frequency a consequence of ligation of Fe(II) to the ligand (Salen) [29]. The absorption spectra of salen and its Fe(II) complex is shown in Figures 15 and 16.

Figure 15: Absorption spectra of salen ligand in 10-3 M DMF.

Figure 16: Absorption spectra of Fe (II) salen complex in 10-3 M DMF.
Mass Spectra of the ligand and the complex is shown in Figures 17 and 18. The mass spectrometer indicated mass to charge ratio of 268 and 359 for the ligand and complex respectively. Since the complex was prepared in HCl solution, there is attachment of chloride ion on the Fe(II) co-ordinated to the ligand. The complex has the formula FeC16H15N2O2Cl and the attachment of the chloride ion confirmed by dissolving the complex in concentrated HNO3, boiled to remove the acid, redissoved in distilled water and tested with silver nitrate solution which gave white precipitate.

Figure 17: GC-MS spectra of salen ligand.
-salen-5-2-13-g018.png "Journal-of-Chemistry-GC-MS-Fe(II)-salen")
Figure 18: GC-MS spectra of Fe(II) salen complex.
Preparation and extraction of Fe(II) metal–Salen chelate by solvent extraction method has been successfully optimized using response surface methodology. The experimental design, regression analysis and quadratic models developed using Box Behnken design, a response surface methodology approach for the optimization of the amount of chelate extracted was applied to ensure accuracy and effectiveness in the predicted values. The optimal extraction conditions for Fe(II) metal-salen chelate were as follows 0.42% Salen concentration,20 μg metal ion concentration, a temperature of 20°C, extraction time of 8.19 minutes, acid concentration of 10-4 M and one cycle extraction. The adsorption process of metal ions to Salen has been shown to be spontaneous, endothermic, involves solvation processes and obeys pseudo-second order kinetic model. In brief, the present study provided a new and efficient method for the preparation and extraction of Fe(II) metal-salen chelate.
The authors declare no conflict of interest in the work.