ISSN ONLINE(2319-8753)PRINT(2347-6710)
ISSN ONLINE(2319-8753)PRINT(2347-6710)
T.Poongodi1, Dr. (Mrs.) S.Muthulakshmi2
|
| Related article at Pubmed, Scholar Google |
Visit for more related articles at International Journal of Innovative Research in Science, Engineering and Technology
Queueing models characterized by bulk arrival or bulk service of either fixed or variable sizes are commonly found in modelling of traffic and transportation systems, complex computer and telecommunication systems, inventory replenishment system and other real-life applications. Control chart technique enables to monitor the performance of these queues. Average queue length and average waiting time are the main observable performance characteristics of any queueing system. In this paper control limits are established for M[X] /M /1 queueing model when the batch size follows geometric distribution. Numerical results are added to highlight its applications.
Keywords |
| bulk arrival, queue length, geometric distribution, Poisson arrival, exponential service, control limits. |
INTRODUCTION |
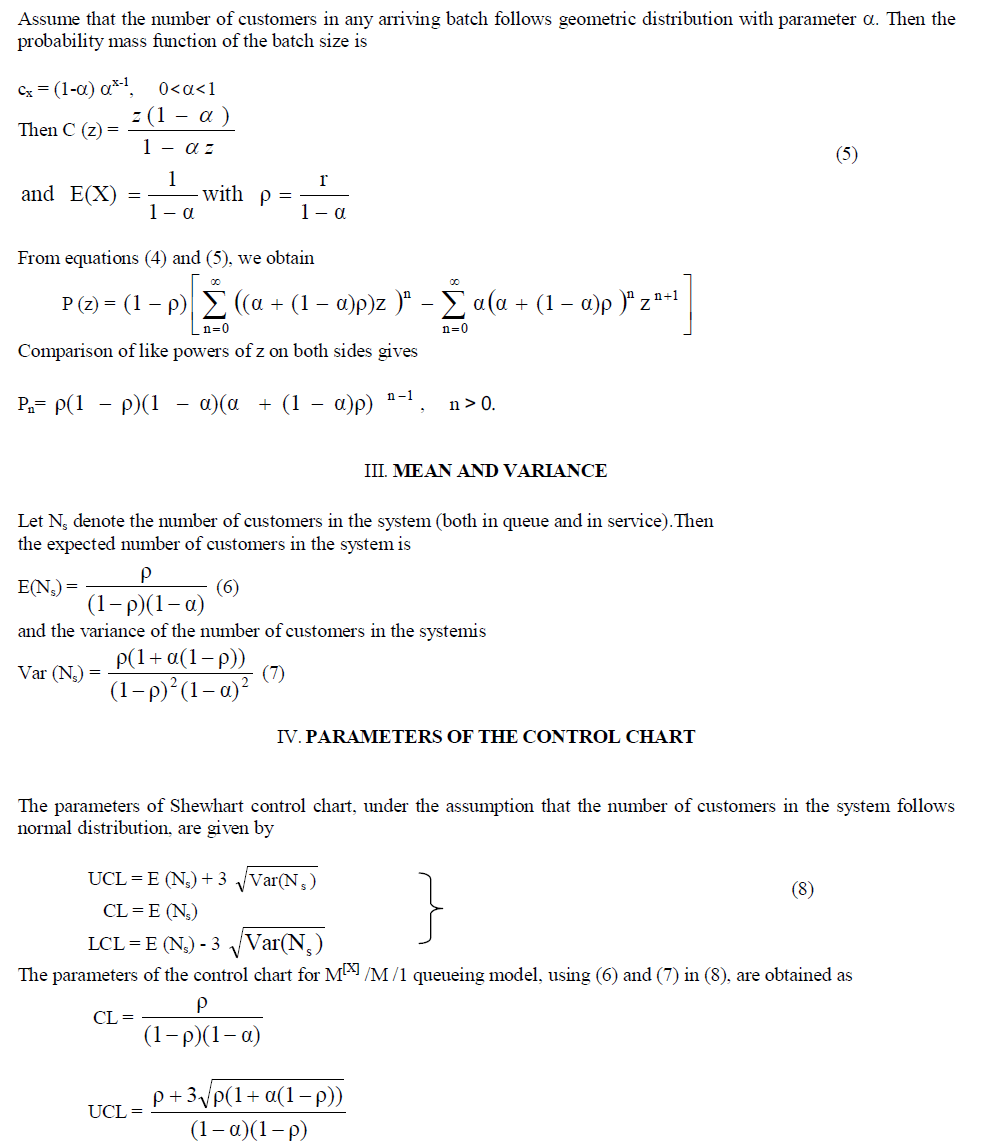
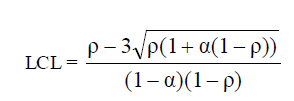
| In general, in queueing models, it is assumed that the customers arrive singly at service facility. But this assumption is violated in many real life queueing situations. Letters arriving at a post office, ships arriving at a port in a convoy, people attending a wedding reception etc., are some of the examples of queueing situations in which customers arrive in groups. Queueing model consisting of bulk arrival has been discussed by Gross and Harris (1998), Carmen Armero and David Conesa (2000) and several others. Control chart is a quality control technique evolved initially to monitor production processes. Montgomery (2005) proposed a number of applications of Shewhart control charts in assuring quality in manufacturing industries. Shore (2000) developed control chart for random queue length of M /M /S queueing model by considering the first three moments and also Shore (2006) developed Shewhart-like general control charts for G/G/S queueing system using skewness. Khaparde and Dhabe (2010) constructed the control chart for random queue length of M/M/1 queueing model using method of weighted variance. Poongodi and Muthulakshmi (2012) analysed number of customers in system of M/Ek/1 queueing model using control chart technique. In this paper Shewhart control chart for number of customers in the system of bulk arrival queueing model M[X] /M /1 is proposed. Section 2 relates to the queueing model description. Mean and variance of number of customers in the queueing system are derived in section 3. Parameters of control chart for number of customers are established in section 4. Numerical results are obtained in section 5 to analyse the effect of parameters. |
II. M[X]/M/1 MODEL DESCRIPTION |
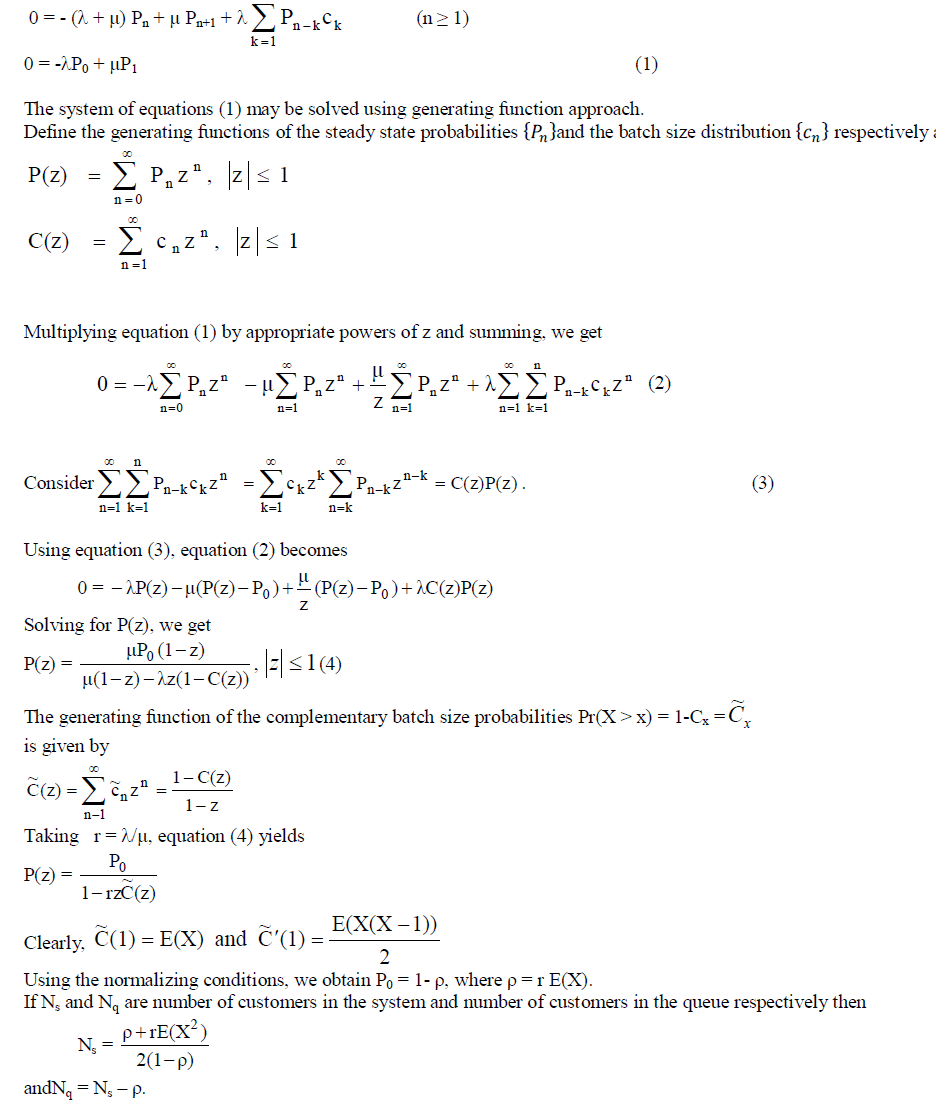
| Consider a single server queueing model in which the arrivals occur in batches according to Poisson process with rate ïÃÂìÃâ¹ÃÆ 0. The batch size X is a random variable with P(X = k) = Ck, k = 1, 2, 3,…. Customers are served one by one and the service time distribution is exponential with rate μ. Let Pn be the probability that there are n customers in the system. |
| The steady state equations governing this model are |
 |
 |
 |
V. NUMERICAL ANALYSIS |
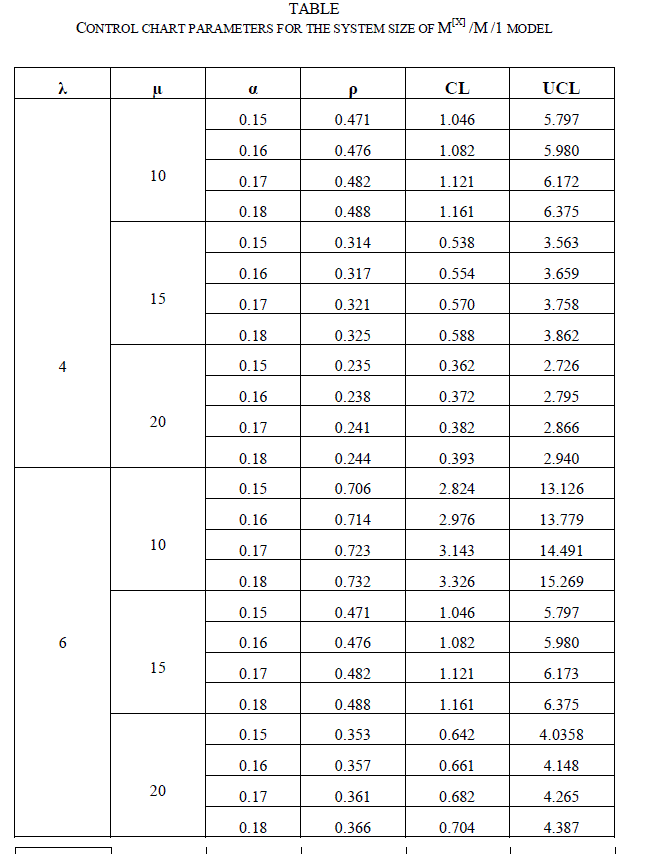
| Numerical analysis is carried out to analyze the performance of queueing system with reference to the parameters λ, μ and α. As LCL values are negative for the selected values of the parameters, they are considered as zero and therefore not shown in the table as a separate column. Table gives the traffic intensity and the control chart parameters for number of customers in the queueing system for various values of λ, μ and α. |
 |
| Numerical values in the table reveal the following features: |
| (a) increase in α increases the parameters ρ , CL and UCL for fixed values of λ and μ. |
| (b) increase in μ decreases the parameters ρ , CL and UCL for fixed values of λ and α. |
| (c) increase in λ increases the parameters ρ , CL and UCL for fixed values of μ and α. |
References |
|