International Journal of Innovative Research in Science, Engineering and Technology
ISSN ONLINE(2319-8753)PRINT(2347-6710)
ISSN ONLINE(2319-8753)PRINT(2347-6710)
| Lalith Krishnan H, Vasanth Dhinakaran, Jerubaal John Luke School of Electronics Engineering, VIT University, Chennai, India |
| Related article at Pubmed, Scholar Google |
Visit for more related articles at International Journal of Innovative Research in Science, Engineering and Technology
Controlling and monitoring a system in a cost efficient way is a challenge for residential and industrial grade liquid flow management systems as many of the sensors used in these systems are located remote, inaccessible locations. This project aims at creating a multipurpose solution for problem and a lab-view interface is used in conjunction with the Internet of Things (IOT) on-line console, instead of using a SCADA and power line communication interface. The data obtained is logged into the internet over a secure gateway and the obtained data is monitored using a Lab view interface on a PC based server .A brief outlook of using this system for the purpose of BTU measurement is provided at the end of this paper
Keywords |
| Lab-view, Internet of Things, Monitoring and Control , BTU , PC based server |
INTRODUCTION |
| An Industry undergoes through various processes. Each process comprises of various parameters like temperature, pressure, speed, timings and so on. These parameters need to be maintained at a desired level. If these parameters are not controlled, it will end up incurring large losses to both human life and industry .Therefore, it is essential that controlling a system plays a vital role. The controlling operation involves hug capita investment and occupies huge physical space for controlling operation [3]. Thus the controlling operation in this paper is done using Internet of things and by using a Zigbee gateway the data is logged into the web. |
| The connectivity of the system to Internet of things is provided by means of Ethernet based device [1].Each system is given a particular IP address and the system specifically can be accessed through the address. This enables remote access of the system and hence reduces man power and physical space for monitoring and control operation. Use of this controller reduces the power consumption, and increases the speed of operation. Using this system one can monitor the parameters like temperature and humidity in the Industrial processes. |
| The planned system customs the temperature sensor LM35 and humidity sensor SYHS-220.The parameter's data sensed by the sensors are read by PIC168ff Microcontroller through its one of the ADC ports and transmitted through Zigbee to a gateway node i.e. Zigbee based internet server [3] The client or a person on the PC is also connected to same LAN or Internet. By typing the IP-address of LAN on the web browser, the user gets a web page on screen; this page contains all the information about the status of the devices [4]. The user can also control the devices interfaced to the web server by pressing a button provided in the web page and these readings can be monitored on the web page over the web. By providing a LabView interface, we are reducing the overall cost of going for a SCADA based control system. |
COMPARISON BETWEEN LABVIEW AND SCADA BASED SYSTEM |
| The major difference between a SCADA based control system and LabView based control system would be with respect to cost , Complexity of implementation and the area required for implementation .For a SCADA based system, implementation will on the number of input and outputs connected. When large number of inputs and outputs are to be connected to the SCADA, Control Panel size required for processing the data will increase dramatically along with the cost incurred for implementation. But, the LabView based system involves the initial cost of procuring license for implementation. The area occupied with respect to LabView based system will be less as compared to SCADA based system. When large of input and outputs are to be processed ,several such controller systems can be connect to the centralised server which in turn will connect it to the Internet. |
EXPERIMENTAL SETUP |
| The experimental setup for controlling non-linear process consists of a water level tank with pneumatic controls which will increase or decrease the liquid level dynamically based on the output [7]. The data from the water level sensor is fed to the microcontroller analog pin. The analog to digital converter converts the analog value to digital and it feds to Zigbee transceiver .The Zigbee receiver gets the value and feds it to the PC which acts as a server. The data obtained is fed to the LabView interface which dynamically shows the variation in the water level. In addition to the water level indication, Temperature of the system is monitored using LM 35 and it is fed to the PC in a similar way. The values from the PC are then transmitted through RJ 45 cable to the modem which enables us connecting it to the internet. |
HARDWARE IMPLEMENTATION SETUP |
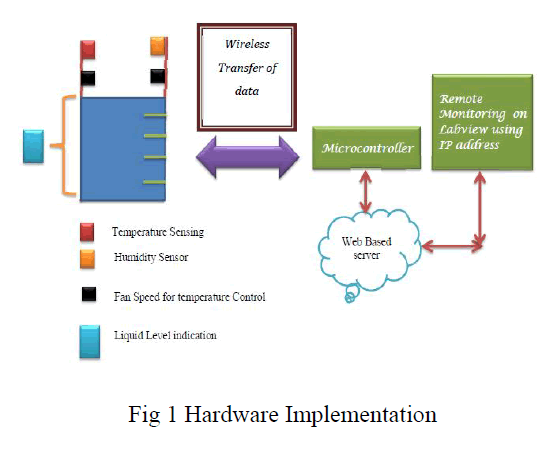
| The hardware implementation of the system as described in figure 1 controls the parameters of a non-linear process. The hardware components used in the implementation are PIC16F887 development kit, Zigbee cc2350 development kit, and LM 35 and RJ 45 cable. |
 |
| A. PIC16F887 |
| Microchip PIC 16F887 controller is used for controlling the level of the tank. It has 256 bytes of EEPROM data memory, self-programming, an ICD, 2 Comparators, 8 channels of 10-bit Analog-to-Digital (A/D) converter, 2 capture/compare/PWM functions, a synchronous serial port that can be configured as either 3-wire SPI or 2-wire I2C bus, a USART, and a Parallel Slave Port[11]. Here in this implementation, the PIC microcontroller plays and important role in both monitoring and controlling the process. |
| The level of liquid in the tank is transmitted to the microcontroller using level senor and it is given to server using Zigbee. The obtained data is then monitored using LabView interface. The microcontroller is also used for controlling the temperature obtained from LM 35 using coolant fan. |
| B. LabView Interface |
| LabView interface in this implementation plays a vital role as the data obtained from the microcontroller is graphically visualized. The data obtained is represented as a graph and can be logged for future reference also. The data will be available to the server and to the link which is connected to it. Hence, LabView can be made available both from remote location and near the server. The LabView interface near the server will act as a backup to the remote location link [10]. |
| C. Zigbee and PC based Server |
| The main significance with this implementation is usage of PC based server. The data obtained from the process is fed to the PC using Zigbee CC 2530. It is 2.4-GHz transceiver with IEEE 802.15.4 Compliant RF – IR Generation Circuitry. It generally covers 200 m distance connectivity and the Zigbee can be upgraded if there is a requirement for distant server from system. |
| D. Internet of Things |
| The data obtained from the Zigbee module is then connected to modem using RJ45 cable.A cable modem is a device that enables you to hook up your PC to a local cable TV line and receive data at about 1.5 Mbps. This data rate far exceeds that of the prevalent 28.8 and 56 Kbps telephone modems and the up to 128 Kbps of Integrated Services Digital Network (ISDN) and is about the data rate available to subscribers of Digital Subscriber Line (DSL) telephone service. A cable modem can be added to or integrated with a set-top box that provides your TV set with channels for Internet access. In most cases, cable modems are furnished as part of the cable access service and are not purchased directly and installed by the subscriber. The modem is used for sending the data to through internet and using the same IP address as that of PC data can be got and it can be used for monitoring from remote locations. The whole implementation setup utilizes TCP/IP stack for interfacing with the remote location. |
| E. Temperature Sensor-LM35 |
| LM35 is a precision IC temperature sensor capable of measuring temperature (in Oc) and producing a voltage in proportional to the temperature.The sensor is not susceptible to oxidation and other processes as it is sealed.In comparison to thermistor, the temperature measured is more accurate. It also possess low self-heating and does not cause more than 0.1 0C temperature rise in still air. The operating range is from -55 0 C to -150 0C.The output voltage varies by 10mV in response to every 0C rise/fall in ambient temperature. I.e. scale factor is 0.01V/0C [9]. |
| F. BTU Measurement |
| BTU is the amount of heat required to increase the temperature of a pint of water (which weighs exactly 16 ounces) by one degree Fahrenheit. So measuring BTU requires 2 basic parameters which is the quantity of water and the difference in water temperature. These two parameters can be measured by means of simple PT100 temperature sensor and usage of strategically placed flow wheel sensors to measure the Gallons per minute. The added advantage of using such liquid management systems is that it can be used as a water meter-ring device for households which not only computes the water consumption but also intimates the user about water leaks. Coupling this system with an ultrasonic sensor HC-SR04 for tank level detection, Solenoid valves for flow control within pipes ,we can create an overall liquid management system suited for both residential and industrial needs. |
| Heat (Btu/hr) = Flow Rate (Gallons Per Minute) x 500 x Temperature Difference. |
| BTU meters are used in chilled water systems for both commercial and industrial and office buildings. These meters are used to bill users for energy usage.Since BTUs are measurements of energy consumption, they can be converted directly to kilowatt-hours (3412 BTUs = 1 kWh).BTU is basically embodied energy as opposed to kWh which is known as operating energy so even well known green building programs across the world such as the Leadership in Energy and Environmental Design (LEED) use BTU as a measure for their certification needs ,for instance air conditioners for household use typically produce between 5,000 and 15,000 BTU. |
CALCULATIONS FOR CALIBRATING LM35 |
| Resolution Voltage –Vref / 2n n is the no channels of ADC |
| Suppose the LM35 gives a value of 0.34V,we get the output as (0.34) / (4.88 X 10^ -3) =69 oC. |
| Per oC = 0.08 V |
| For 300V =2.4 V |
| 2.4 / (4.88 X 10^ -3) =491 |
| This value should be loaded in the code for setting the thresholds. |
ALGORITHM |
| The figure 2 pronounces the algorithm used for fan control using PIC microcontroller. The PIC microcontroller has inbuilt timer and it is utilized for PWM generation. The PWM signals generated are used for controlling the speed of the fan so that optimum temperature is maintained. |
| The CCP module is a peripheral which allows the user to time and control different events. Capture Mode, allows timing for the duration of an event. This circuit gives insight into the current state of a register which constantly changes its value. In this case, it is the timer TMR1 register. Compare Mode compares values contained in two registers at some point. One of them is the timer TMR1 register. This circuit also allows the user to trigger an external event when a predetermined amount of time has expired. |
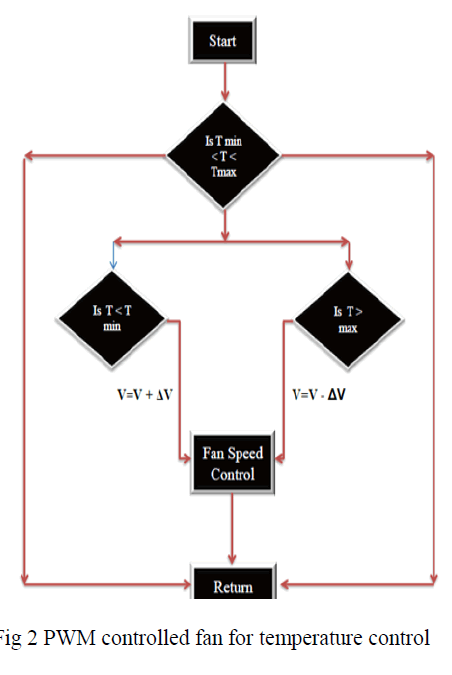 |
| The above block diagram explains the PWM control of fan using PIC microcontroller. If the temperature is more than maximum value system can withstand, the duty cycle is increased so that the temperature is reduced. If the temperature has reduced below temperature level, the fan speed is reduced by decreasing the duty cycle. |
RESULTS |
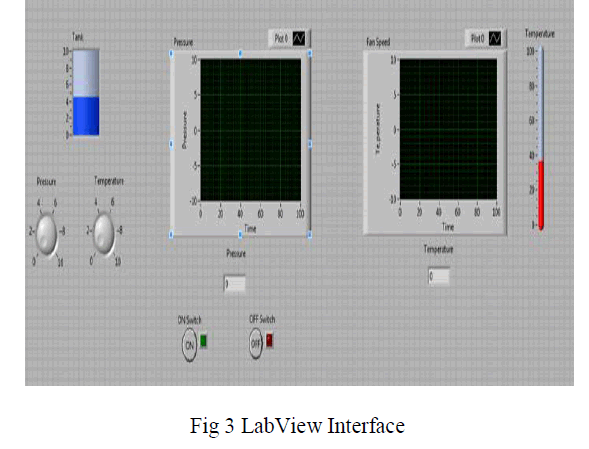 |
| The LabView interface will be on both server and the link side. The LabView data acquisition module will get the data from COM port and displays it as a graph. The Boolean function is connected to master control pin of Microcontroller so that whenever Master reset button is ON in LabView, the corresponding solenoid value will be disabled so that system can be turned off. |
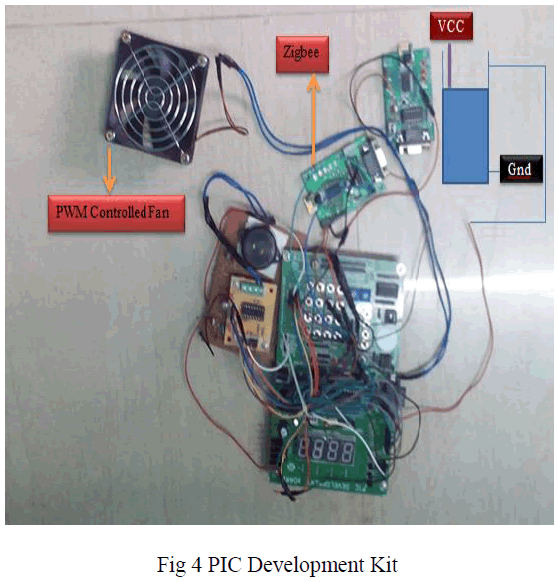 |
| The figure 4 illustrates the PIC development implementation of the above mentioned issue. The PIC development board is programmed with the hierarchy based approach .The PWM technique is used for controlling the fan speed and the UART is used for Zigbee reception |
FUTURE WORKS |
| The following items may be considered as topics for future Work: |
| The extension of the proposed architecture. Studying the limitations of Zigbee networks, sources of Delay and benefits of broadcast mode over unicast Mode for implementation of DCS systems. |
| The analysis of the Zigbee based Networks performance and the study of the ways to improve its reliability when working in a critical system applications like real-time Power system protection. |
| The integration of a web server (Embedded web server to host a web page containing the system acquired information. It should be realized that the Zigbee itself is not compatible with the IP-based network. |
| Field tests should be performed to evaluate parameters like types of noise, covered distance, etc |
| BTU Measurement |
CONCLUSION |
| The proposed system will provide an alternative to the existing SCADA based control system. The cost and area required for implementing a huge control system is drastically reduces in such a way that with minimal whole process can be controlled. The future work would be to expand this to a nonlinear process analogous to a DCS system. |
References |
|