ISSN ONLINE(2319-8753)PRINT(2347-6710)
ISSN ONLINE(2319-8753)PRINT(2347-6710)
E.Ramesh Kumar1, K.Rajanikumari2, B.Appa Rao3, G.Bhikshamaiah3
|
| Related article at Pubmed, Scholar Google |
Visit for more related articles at International Journal of Innovative Research in Science, Engineering and Technology
Fast ion conducting (FIC) glasses of composition 66%AgI-[MAg2O-F{(F1)B2O3-(F2)TeO2}] were prepared by melt quenching technique. Here M/F ratio was varied from 0.0 to 2.0 in steps of 0.25 for fixed values of F1& F2. The prepared samples were characterized by X-ray diffraction (XRD) and Fourier Transform Infrared (FTIR) experiments to understand their structure. Electrical studies of the prepared glasses were carried to evaluate DC and AC conductivity, activation energy and break down strength of them. The DC Conductivity was increased from 10-5 to 10-2 Scm-1 at room temperature. The activation energy (Edc) was decreased from 0.44 to 0.20eV. The breakdown strength varied from 2.9 to 1.7kV/cm as Ag2O concentration increased gradually. These results confirm that the addition of Ag2O has significantly enhanced the electrical conductivity of prepared silver borate glasses. The prepared fast ion conducting glasses can be effectively used as electrolytes in solid state batteries.
INTRODUCTION |
| The studies on fast ion conducting (FICs) glasses are increasing due to their potential applications in various electrochemical devices. The FIC glasses not only have high ionic conductivity but also have many other advantages over their crystalline counterparts, such as, ease in preparation, wide selection of composition & glass forming region, miniaturization in the form of thin films, absence of grain boundaries, isotropic properties, negligibly small electronic conductivity, inert to atmosphere, high stability, etc., [1-3]. Hence, many FIC glasses have been synthesized in the form binary, pseudo binary and ternary to achieve high ionic conductivity. Recently, it has been demonstrated that further improvement in the conductivity could be achieved by adding one more component to the ternary systems, which are called quaternary FIC glasses [4,5]. On the other hand, the analysis and understanding of the experimental results of FICs have become a real task, because of the multi component and complex nature of the glassy matrix [5- 7]. Recently, impedance spectroscopy has become a basic and ideal technique to characterize the FIC materials, where the impedance analysis can give the information about the bulk (DC) conductivity and also the electrical behavior (equivalent circuit) of the FIC materials [7-9].The analysis of the AC conductivity results will give information about the variousconduction species and their influence on the overall transport process in the glass matrix [10-12]. Hence, in this paper, we report the preparation, characterization, DC and AC conductivity through impedance measurements, of AgI-Ag2O-(B2O3+TeO2) glass system. |
II. LITERATURE SURVEY |
| M. Venkateswerlu and N. Satyanarayana have reported the AC conductivity studies of silver based fast ion conducting glassy materials with the glass system is AgI–Ag2O–(XSeO2- (1-X)As2O5) prepared by melt quenching techniquefor solid state batteries.The electrical conductivity measurements have been carried out at 1 kHz as well as in the frequency range of 5 Hz–13 MHz and thetemperature range of 295–350 K.N. Baskaran, G. Govindaraj, and A. Narayanasamy have reported the AC conductivity and relaxation processes in silver selenochromate glass. The AC conductivity and dielectric properties of Y% AgI–(1-Y)%[MAg2O–F[0.6SeO –0.4CrO ]with Y=20–80% glasses have been studied over the frequency range 1–1MHz, by impedance measurements in the temperature range100–300 K. |
III. EXPERIMENTAL |
A) Sample preparation |
| Silver boro tellurite [SBT2] glasses 66%AgI-[MAg2O-F{(F1)B2O3-(F2)TeO2}]; M/F=0.0 to 2.0 in steps of 0.25 for a fixed value of F1& F2 of various compositions were prepared by melt quenching method. AR grade AgI, Ag2O, B2O3 and TeO2 compositions were weighed according to their mol%, crushed and then ground in an agate mortar and pestle for 1 hour by wet grinding method. The homogenous mixture obtained was then kept in an alumina crucible in a controlled electric muffle furnace at 7500C. After 1 hour, the melt was poured on a heavy thick copper plate kept at room temperature and pressed by another similar copper plate to quench it.For XRD, FT-IR spectra, the obtained glasses are crushed into fine powders using pestle and mortar.For conductivity studies this powder is made into pellets(dia=1cm, thickness=1mm approximately) formed by high compression method and silver paste is applied for better electrode contact. |
B)Characterization |
| All the samples were characterized by using XRD, FT-IR spectra. In the present investigation, X-ray diffraction measurements were carried out for all the samples using Philips X’Pert pro diffractometer with Cu Kα-radiation of wavelength λ =1.5418Å between 10âÃâæand 90âÃâæof 2θ. The FT-IR spectra for all the samples are recorded on BRUKER (Model: TENSOR 27) FT-IR spectrometer.Pellets made with the mixture of SBT2 powder and KBr are used to record FT-IR spectra in the range of 600–4000 cm−1 with 4 cm−1 resolution. |
C) Electrical characterisation and break down strength |
| For DC conductivity measurement the silver painted pellets were sandwiched between two spring loaded stainless steel blocking electrodes of surface area 3.14 cm2.The sample holder is placed in a thermostat controlled furnace and temperature is varied from 300C to 1500C (423K) at an interval of 500C. DC conductivity measurements were carried out using Keithly 6485 pico ammeter in the temperature range of 303-423K for all SBT samples.For AC electrical conductivity, impedance measurements were carried out by Wayne Kerr LCR-6440B impedance analyser from 1 kHz to 3MHz over the temperature range of 303–423K for all SBT samples. The impedance data was analysed by nonlinear curve fit method, and from those curves AC conductivity, activation energywas calculated.The study on the electric breakdown of glass dielectrics is extreme importance in deciding the insulating character of the glass.Dielectric breakdown strength for all these glasses at room temperature in air medium were determined using a high AC voltage insulation breakdown tester ITL Model BDV-5 operated with an input voltage of 250V and a frequency of 50 Hz. |
IV. RESULTSAND DISCUSSIONS |
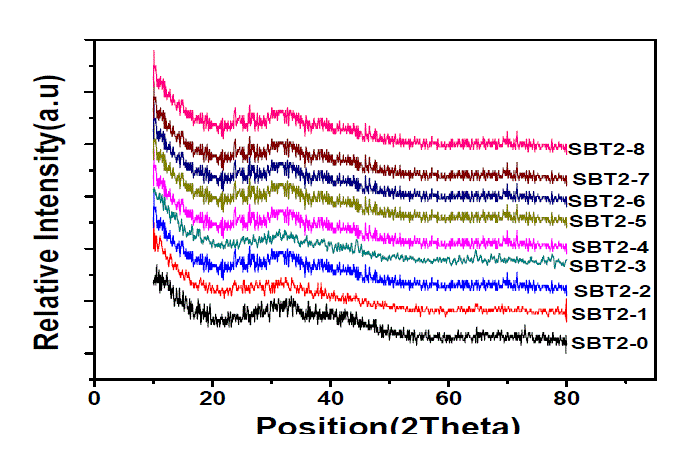
| Fig. 1 shows the XRD spectra of all the compositions of SBT2 series glasses and the absence of any sharp peak confirms that all the samples are amorphous in nature. |
 |
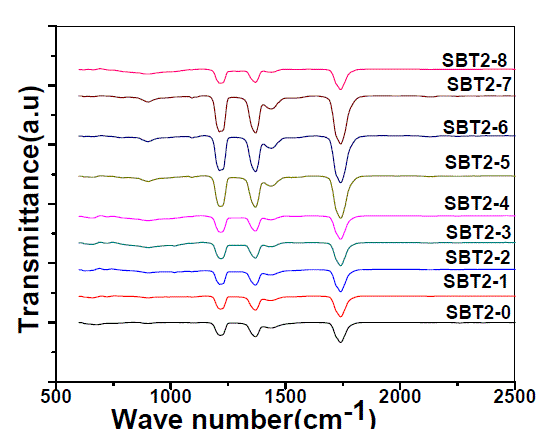
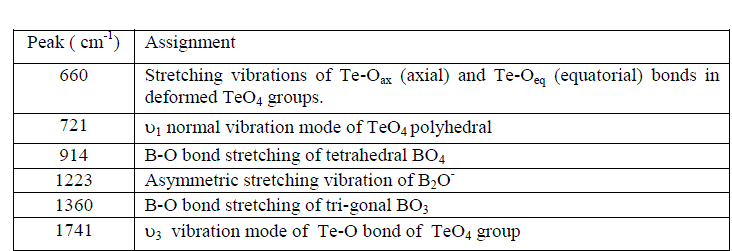
| Fig. 2 shows the FTIR spectra of SBT2system and their assignments are given in Table-1. |
 |
 |
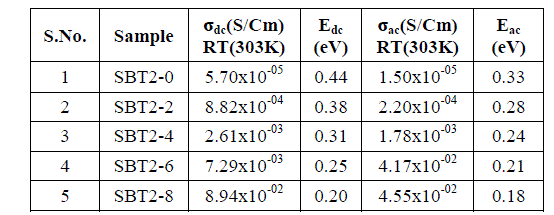
| Usually DC conductivity is measured to determine the ionic nature of conductivity in these systems. Ion transport in these materials under a DC potential leads to a build-up of charge at the electrolyte-electrode inter phase if the ions are not replenished at the electrodes. This phenomenon is termed as electrode polarization and it can drastically affect the magnitude of the DC conductivity.DC Conductivity of the samples at room temperature ranges between 10-5 to 10-2 Scm-1 from SBT2-0 to SBT2-8. From Table-2 it is observed that conductivity value increases not only with temperature and also with Ag2O concentration. This in turn enhanced the mobility and there by conductivity of the samples. A graph plotted between log conductivity and 103/ T(K-1) is shown in Fig. 3(a). DC activation energies are calculated for all the samples using Arrhenius equation value is highest (0.44eV) for SBT2-0 and the lowest for (0.20eV) SBT2-8 glass sample. The graph between mol% of Ag2O and activation energy is shown in Fig.3(b). It is obvious from this figure that the DC activation energy decreased with increasing the Ag2Oconcentration.Variation of increasing conductivity with increasing temperature is characteristic of ionic conductors. So we can conclude that the samples prepared are ionic conductors. |
 |
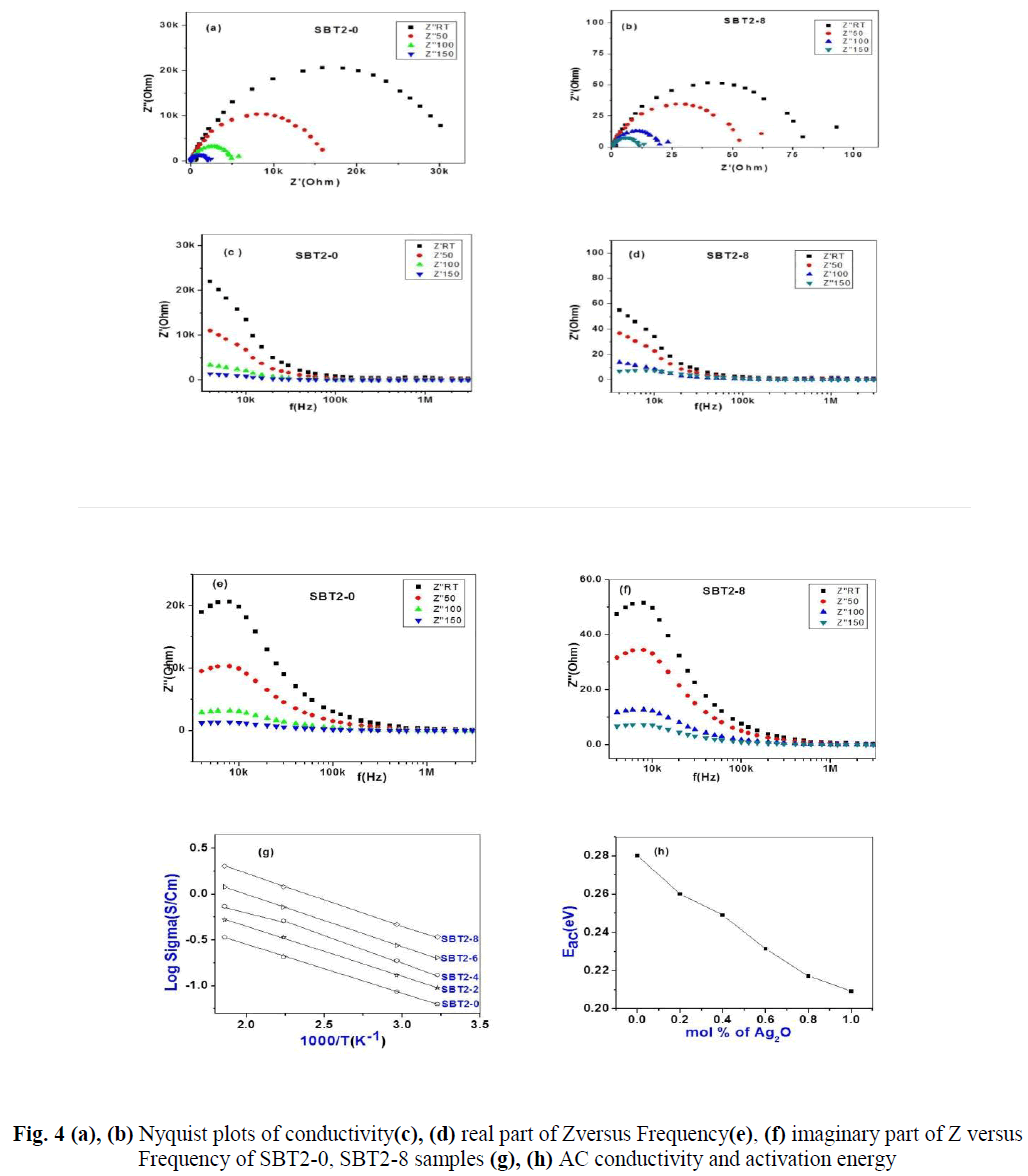
| The real (Z’) and imaginary (Z’’) parts of impedance values are calculated from the measured data of impedance |Z| and phase angle (ïÃÂñ).The complex impedance plots of SBT2-0 and SBT2-8 are shown in Fig.4 (a), (b). Nonlinear least square fit these plots gives equivalent R-C circuit. The present glass of samples can be approximated to a parallel combination of bulk resistance (Rb) and bulk capacitances (Cb). These values are tabulated below in Table- 3.Variation of real/imaginary part of impedance (Z’/Z’’) with frequency at different temperatures for SBT2-0, SBT2-8 samples is represented in Fig.4 (c) & (d),Fig.4 (e) & (f) respectively.We conclude that real and imaginary impedances to converge at lower frequencies indicating that at lower frequenciesimpedance become independent of temperature. Higher frequencies of dispersion of Z’ and Z’’ values indicate presence of large charge agglomerations in the relaxation process confirming the role of segmental motion of large chains.AC Conductivity values are found to vary between 10-5 Scm-1 (SBT2-0) to 10-2 Scm-1 (SBT2-8) at room temperature. It is observed from Fig. 4(g) the AC conductivity increased with increase of temperature. Higher temperatures favour the conduction in SBT glasses.AC conductivity increases with increasing Ag2Oconcentration, hence this favour the conduction in SBT glasses. Activation energies are calculated from Arrhenius equation.From Fig. 6(h) it is observed that AC activation energy decreases with increase inAg2Oconcentration from 0.33eV to 0.18eV. These values are given in Table-2. AC activation energy decrease depends on increase in temperature at selected frequency. This behaviour is a characteristic of conductors with hopping charge carriers. |
| From the Nyquist plots it is observed that the intercept of the semi-circle with the real axis at lower frequency shifts towards the higher frequency with increase in temperature. The intercept of the semi-circle at lower frequency with the real axis gives the equivalent DC resistance (bulk resistance-Rb) for each composition and at each temperature. DC resistance decreases with increase in temperature and this is in agreement with the result obtained from the DC measurements.Observation of semi-circle in these plots indicates that the samples are parallel combination of a resistance and a capacitance, which are respectively, the bulk resistance Rb and the bulk capacitance(Cb) of the solid electrolyte[13, 14].The straight line observed as a tail at the low frequency region represent a capacitance effect at the electrode and electrolyte interface and it is called double layer capacitance(Cdl ). Further the inclination of this tail in the low frequency region is due to the presence of the asymmetric nature of the distributed elements in the electrode and electrolyte interface. Relaxation time τ of the distributed elements at the interface is not a single valued, but it is distributed continuously around a mean value. The amount of the inclination in the low frequency straight line is related to the width of the relaxation time distribution. |
 |
 |
| The breakdown strength values for SBT2 glasses decreasing with increasing the concentration of Ag2O, since the rate of increase of conductivity with the temperature is increasing from SBT2-0 to SBT2-8 glass sample. So the prepared glasses are fast ion conducting glasses.The breakdown strength value for SBT20 is 2.9Kv/Cm. With increasing the concentration of Ag2O, breakdown strength values decreased gradually and reached a value of 1.7Kv/Cm for SBT2-8. |
IV. CONCLUSIONS |
| XRD confirms the amorphous nature of the SBT2 system. From FTIR spectra all band positions and their assignments identified. DC Conductivity increases with increase in temperature and it also increases with increase in the concentration of Ag2O and activation energies decreases. It is found that the sample SBT2-8 has highest conductivitywith lowest activation energy. AC Conductivity plots show the presence of relaxation. Impedance spectroscopy also reflects the involvement of conducting ions. In all the samples DC conductivity is lower than AC conductivity values. In all the samples the conductivities are observed to increase not only with increase in temperature, but also with increase in concentration of Ag2O. This is confirms hopping of charges between the coordinating sites, local structural relaxation and segmental motion of chains.Breakdown strength values are decreasing with the increasing the concentration of Ag2O. Even the FTIRspectra and breakdown results supports that increase of Ag2Oconcentration favour better conductivitynature in SBT glasses. The above electrical conductivity studies and breakdown strength studies indicate that these are fast ion conducting glasses,hence can be used as electrolytes in solid state batteries. |
ACKNOWLEDGMENTS |
| The authors are thankful to the University Grants Commission, New Delhi, for providing financial assistance to carry out this work. |
References |
|