Journal of Global Research in Computer Sciences
ISSN: 2229-371X
ISSN: 2229-371X
K.Ravishankar*, Jothi Kumar C
Department of Computing Technologies, SRM Institute for Science and Technology, Chengalpattu, Tamil Nadu, India
Received: 08-Jan-2024, Manuscript No. GRCS-24-124721; Editor assigned: 10-Jan-2024, PreQC No. GRCS-24-124721 (PQ); Reviewed: 24-Jan-2024, QC No. GRCS-24-124721; Revised: 16-Jan-2025, Manuscript No. GRCS-24-124721 (R); Published: 23-Jan-2025, DOI: 10.4172/2229-371X.16.1.006
Citation: Ravishankar K, et al. Death Rate Estimation Model for COVID-19 Patients Using CIXCNet Classifier. RRJ Glob Res Comput Sci. 2025;16:006.
Copyright: © 2025 Ravishankar K, et al. This is an open-access article distributed under the terms of the Creative Commons Attribution License, which permits unrestricted use, distribution and reproduction in any medium, provided the original author and source are credited.
Visit for more related articles at Journal of Global Research in Computer Sciences
The abrupt rise of Coronavirus Disease (COVID-19) infected cases causes huge pressure on healthcare sectors throughout the world. In this scenario, an earlier and accurate detection of the disease is essential. It is necessary to identify robust and meaningful markers of mortality risk of COVID-19 patients. An interpretable Machine Learning (ML) algorithm has to be designed to detect the most distinguishing biomarkers of patient death. It should aim to distinguish the patients at imminent risk, thereby relieving clinical burden and potentially reducing the mortality rate. This paper aims to design a death rate estimation model for COVID-19 patients to detectthe vital biomarkers causing death. In this model, CIXCNetclassifier is developed in whichConvolution Neural Network (CNN) and XGBoost with Cohart Intelligence (CI) optimization are combined. In traditional classifiers, the structure of the model is determined by hyperparameters, which is time-consuming due to manual tuning of the parameters. Hence the CI optimization method is employed for tuning the hyper parameters. The model output corresponds to the patient mortality rate. Performance results show that the proposed CIXCNet classifier achieves higher accuracy, precision, recall and F1-score when compared with other classifiers.
COVID-19; Mortality prediction; Convolutional Neural Network (CNN); Extreme Gradient Boosting (XGBoost); Cohort intelligence; Hyper parameter; Classification; Optimization; Biomarkers
A brutal sensitive respiratory disorder Coronavirus 2-caused COVID-19, which has spread the entire world. World Health Organization (WHO) proclaimed COVID-19 pandemic on March 11th, 2020, and New York City was labelled the outbreak's primary focus on April 22nd, according to WHO. Nearly 3.0 million people died from the COVID-19 pandemic as of April 17th, 2021, and the number of COVID-19 cases has reached 140 million evolving global; 31 million of these are from the United States alone [1].
Worldwide, the COVID-19 illness has been a significant cause of death and disease. Patients with this disease can experience a wide range of symptoms and complications, from no symptoms at all to organ failure and death. Even though SARS-CoV-2 is most commonly associated with the onset of Acute Respiratory Distress Syndrome (ARDS), it has the potential to have severe effects on the heart and lungs in addition to ARDS. It is more difficult to accurately predict the result of COVID-19 clinical trials because of the wide range of illness severity. Sub classification of COVID-19 is critical for both prognosis and severity classification. There is a great amount of intricacy in these traits, and they cannot be used to distinguish between patients with mild and severe forms of the disease. The clinical subtype of COVID-19 has been identified using a combined set of clinical attributes and biochemical markers [2].
Due to the fact that remdesivir and steroids will be the standard treatment for COVID-19 patients with moderate or severe symptoms starting on April 17, 2021, a predictive model for these individuals will be required. It's not clear whether COVID-19's racial disparity in death is related to infection rates, but it should be researched to see if it may be used in forecasting mortality [1]. The number of severely sick patients with COVID-19 continues to rise, even though vaccination programs were conducted in many places, more than 18 months after the first case was diagnosed. Symptoms of critical or severe disease in COVID-19 individuals are seldom identifiable, and development is usually rapid. The number of sudden deaths continues to rise. Researchers hope that by identifying traits that indicate death, they might identify COVID-19 individuals whose health is likely to exacerbate sooner than expected [3].
In terms of predicting medical problems and adverse outcomes, Artificial Intelligence (AI) has been shown to be a useful tool for caregivers. Patients with COVID-19 may have an increased risk of death, and our research suggests utilizing a data-driven predictive analytics strategy based on AI, computer science, and Machine Learning (ML). Hospitals and medical services may use this method to determine which patients should be prioritized for hospitalization, which ones need immediate attention, and which ones can wait less time before requiring critical care when the main stem is overcrowded. Patients' symptoms, physiological conditions, and demographic information are all incorporated into an algorithm that estimates the probability of their death [4].
Along with fundamental details, the information related to symptoms, lab test results and the corresponding outcomes such as survival or death were considered as inputs for the classification task, which ranged from initially general to severely critical patients [5]. Patients who are more likely to acquire a serious condition should get greater attention from the health care system, and accurate risk stratification might help with this [6].
In our earlier work [19], HSDC model is proposed to detectand classify the severity of COVID-19 from X-ray and CT-scan images. But identifying the patients who are at the immediate risk of death, has become an essential and difficult task. But there are no prognostic biomarkers available at present, to differentiate the patients who require urgent medical care and to determine the corresponding mortality rate. Existing works on COVID-19 mortality prediction mostly applied traditional machine learning approaches with limited dataset. The input dataset should be collected from normal, moderate and severe patients. The associated outcomes of this dataset should be predicted as surviving or death during the test completion time.
The problem statement can be stated as follows: There is a need to determine the most distinguishing biomarkers for patient’s mortality rate, using a ML algorithm. It should able to differentiate the patients at immediate risk and who need urgent medical care, thereby minimizing the mortality rate.
In order to provide a solution to this problem, this paper aims to design a death rate estimation model for COVID-19 patients to detectthe vital biomarkers of patient’s mortality.
Main novelty of the work
The novelty of the proposed CIXCNet is summarized as below:
Related works
For the short-term forecasting of US county-level COVID-19 mortality, Nick Altieri, et al. [7] presented: (i) A huge dataset which collects, combines and updates the data from different sources and (ii) A predictive algorithm along with a prediction interval. They were the first to use this method to create forecasts for specific counties. However the work did not forecast the severity and mortality risks of patients in advance.
There have been two interpretable machine learning models presented by Samarth Bhatia, et al. [8] that have been used to predict clinical outputs and death rate for patients based on regular non-invasive blood parameter tracking in one of India's largest cohorts. But they have taken very small number of data set for training and validation which may not yield reliable results.
Saranya Sankaranarayanan, et al. [9] assembled huge COVID-19 datasets ever published. Existing ML models, as well as Autogluon, a stacked learner, were evaluated using a variety of neural network topologies. These models were trained to work only on standard laboratory data and clinical characteristics after a patient's initial COVID-19 testing. However they have applied and evaluated only traditional machine learning models in their dataset.
According to Logan Ryan, et al. [10], the ML algorithm they used in their study can accurately predict patient death in the COVID-19 and pneumonia groups as well as mechanically ventilated patients up to 72 hours in advance. However, they have applied the traditional XGBoost classifier for prediction where manual tuning of hyper parameters results in more time complexity.
Tao Bai, et al. [11] conducted an international, bi-institutional investigation using data from China and Germany. A mortality prediction model was created using a Random Forest-based ML approach from the patients of Wuhan cohort. With a 91 percent accuracy rate and a 99 percent Area under the Curve (AUC), various clinical characteristics were demonstrated to be predictive of death rate in COVID-19 patients. However, the Random Forest-based ML approach may not yield higher accuracy.
Jie Xu, et al. [12] have derived a prediction interval to assist in the process of differentiating among studies. Dong Huang, et al. [13] have designed and validated a new risk score which is based on 10 risk parameters. The risk score can predict the heartrelated problems which can assist in the accurate prediction of COVID-19 patients. Daniele Andreini, et al. [14] have investigatedthe amount of lung infection due to COVID-19. It predicts the harmful outcomes of patients and the severity of heart disease.Their research analysis has shown a high mortality rate of COVID-19 patients with pneumonia and cardiac disease. Linyu Sun,et al. [15] have proposed a XGBoost classifier based parameter tuning technique using grid search and K-fold validations. Thelearning efficiency of the algorithm is better when compared with existing grid search method.
Research gaps
From the above literature review, the following research gaps can be summarized:
Existing techniques used in our work
XGBoost classifier: Tree boosting is a popular machine learning method. When it comes to fixing a broad range of machine learning problems, data scientists often turn to XGBoost [16]. When compared to other classifiers, since XGBoost is based on the gradient boosting framework, it constantly updates decision trees so that the efficiency and performance of learning process will be improved.
Below is a description of XGBoost [16].
For input set of samples (xi, yi), i=1,2,,,n with m features, XGBoostadds the outcomes of K trees as the final output, represented by
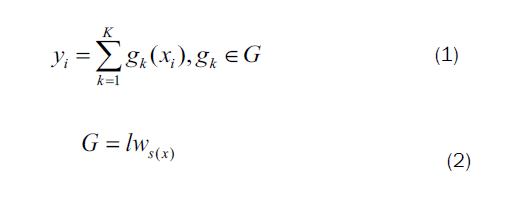
Where,
lws(x) is the leaf weight of each tree with structure s.
Therefore, the XGBoost estimated output is the aggregate value of the leaf nodes of individual trees.
In training process, a fresh tree in included to fill the remaining of the past round. After many iterations, the computed score of the best leaf node is
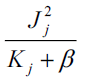
The final objective function is derived as
To summarize, XGBoost includes regularization factor to the objective function, in order to avoid overfitting. The hyper parameters of XGBoost model are listed as follows: Learning speed, maximumtree depth, sub sampling ratio, column subsample ratio, lowest child weight, highest delta step and gamma.
Due to manual parameter adjustment in classic XGBoost, the model structure is defined by hyperparameters. This issue may be solved using hyperparameter optimization methods, where there is no need for expertise or trial and error. There are lot of popular algorithms for optimizing hyper parameters, including GS, RS, and Bayesian optimization [16].
CI optimization algorithm
In CI, the conduct of a particular candidate can be compared to an objective function which naturally strives to improve by changing the associated collection of attributes and characters x=(X1,Xi,....Xn). Each member c (c=1,...,C) in a cohort C possess a set of properties, attributes and features Xc=(Xc1,Xci.....Xcn) that contribute to the overall characteristic of their action, which is represented by the symbol q(xc). Every member c follows the action which is better than its current action.
The steps involved in the CI algorithm arepresented below:
At the start of the algorithm, the following parameters are initialized:
Number of members C,
Sampling interval Ti
For each attributexi, (i=1 to N),
Learning trial counter n=1,
Sampling interval decreasing metric r ∈ [0,1],
Convergence metric and number of variations t.
Step 1: The probability of choosing the action q*(xc) of each cohart c is expressed as Pc
Step 2: Each c applies Roulette wheel selection technique to follow the associated action q*(xc’) and associated features xc’=(x1c’,....,xic’,...xN c’).c’ denotes the selected unknown action by the member.
Step 3: Each c reduces the sampling period Hci(i=1,..M )related to each variable y Yci to its one-hop neighbor set.
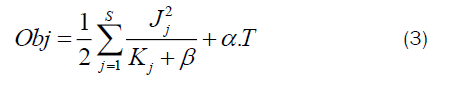
Step 4: Each c collects t features within the updatedHciassociated with every feature Yci and calculates a set of related t actions as
It chooses the optimum action q*(xc) and updates the actions, as shown below:

Step 5: If there is no further development in q*(xc) of each c, then it will be considered as the saturation state of the cohort action.
Step 6: If either of the following conditions is valid,
Admit any C behaviors and return the value of q*(x) as the resulting solution
Stop
Else
Repeat from Step 1.
Proposed methodology
Overview: In this paper, we aim to design a death rate estimation model for COVID-19 patients using CIXCNet classifier. It identifies the crucial predictive biomarkers of disease mortality. CIXCNet Classifier combines the performance of CNN and XGBoost integrated with CI. It has many stacked Convolutional Layers (CLs) to extract and study the features and CI-XGBoost layer to predict the output. The model output corresponds to the patient mortality rate. The CI optimization method is employed in XGBoost, for tuning the hyper parameters. The architecture CIXCNet classifier is shown in Figure 1.

Figure 1. Architecture of CIXCNet.
Data pre-processing
Input learning: This phase reads and processes the input data. If a training data set (X) has two tuples (xj,yj), the index of the data set j is likely to be one of those tuples. yj is the class label of vector xj.
Data pre-processing: If the input is not in a square form, it will be changed to the common form by filling as required. This phase can also convert a wide range of data formats.
CIXCNet classifier
The CIXCNet contains two major components: Feature selection and prediction. The feature selection component learns and selects the optimal features from the pre-processed dataset using CNN layers. The prediction component predicts and classifies the selected features using CI-XGBoost [17].
The architecture of CIXCNet [18] is shown in Figure 2. It has Convolutional Layer (CL), Reshape Layer (RL), Class Prediction Layer (CPL) and Output Layer (OL). Each layer contains unique potentials and functions. Each layer is split into two components: Feature learning and class label prediction.

Figure 2. Architecture of the CIXCNet classifier.
Feature selection using CNN layers
Convolutional layer: These are the core layers which are in responsible of learning features and convolutionizing and applying decision to the input. The data has dimensions Equation.
Where Z(l) is the number of filters available in each layer.
The convolution Oi (l) for each layer l of the kth feature map is calculated as:
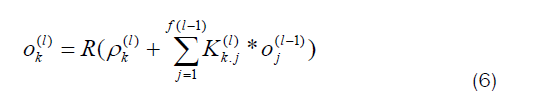
Where,
R is the ReLU activation function
K(l) is the filter size of layer l,
ρ(l) is the bias matrix
Reshape layer: In this layer, the logical tensors produced by the CLs are transformed to a vector. It does some basic housekeeping tasks.
Class Prediction Layer (CPL): In this layer, XGBoost was used for training and predicting the class labels. XGBoost serves as the primary driving force behind this layer's forecasts of class. It is possible to control the number of trees in the XGBoost structure, therefore the size of the structure has an impact on performance. Quality of a tree's structure is rated on a scale ranging from one to five:
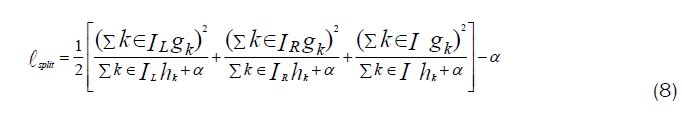
Given IR and IL, the left and right projection sets such that I=IR∪ IL, then the loss which occurs after splitting is given by:
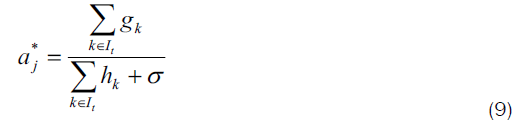
The best leaf weight for the optimal tree is computed as
CI optimization of hyper parameters: The hyper parameters of XGBoost such as Learning Rate (LR), Tree Depth (TD) and Sub Sample Ratio (SSR) are fine-tuned using CI optimization. CI performs optimization by searching for the optimal hyper parameter of XGBoost.
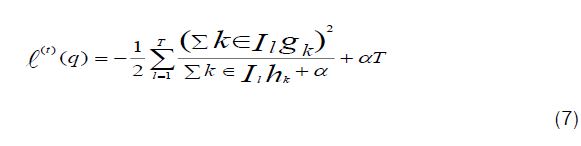
The loss function FL of XGBoost classifier can be defined as

Where a is the actual value and p is the predicted value.
The objective function FO is defined by
Let C be a cohort which consists of set of attributes and properties (Equation) that contribute to the overall quality of their behaviour, f (xc).
Each member c follows the actionswhich is better than its current action.
(ie) f * (x(c) f *(x(c) ) < f * (xc).
Then in our work, f(xc) is given by
f(xc) = {Minimize (FL) , Optimize(Fo)} (12)
The mathematical functions of the CI optimization have been already explained.
The prediction layer has the parameter settings as presented in Table 1.
| Parameters | Values |
| Maximum depth | 4 |
| Learning speed | 0.2 |
| Number of tree estimators | 150 |
| Regularization factor (α) | 1 |
| Subsample | 0.9 |
| Column sample | 0.9 |
Table 1. Parameter settings for class prediction layer.
In order to avoid over fitting in case of small sample size, the subsample and colss sample values are set as shown in Table 1.
Output layer: The class prediction layer provides the class information to the output layer. As a final step, these courses are tested for their accuracy, which evaluates the model's capacity to learn.
CIXCNet algorithm
Let equation be a set of Mtraining feature vectors in RNand yj is the label of vector xj.
Let L be the number of CLs and z be the output of each output CL. Let l (l=1,2,…L) be each layer.
The learning algorithm for CIXCNetis presented below:
CIXCNet learning algorithm
4.1 Assign the filter size asK(l) and filter stride as equation
4.2 Compuete Oi (l) for l using Equation (6)
The algorithms were implemented with Python 3.6 and TensorFlow1.11.0 under Anaconda navigator 1.10.0.
Dataset description
The medical data of all patients gathered for two months from Tongji Hospital, Wuhan, China [5] were used for model development. The dataset contains the time series data of medical information of all patients excluding the pregnant women and teenagers. The training data set contains 375 patients and testing data contains 110 patients. Among the 375 patients, 197 falls in general category, 27 in severe category and 151 in critical category. Table 2 shows the some of the important information collected from each patient.
| S. no. | Parameters | Value |
| 1 | Age | 50-70 years |
| 2 | Gender | 60% male, 40% female |
| 3 | Symptoms | |
| Fever | 50% | |
| Cough | 14% | |
| Fatigue | 4% | |
| Dyspnoea | 2% | |
| 4 | Lab results | |
| LDH (range Q1-Q3) | 273.50 (199.00, 617.75) | |
| Lymphocyte (Q1-Q3) % | 14.35 (4.17, 27.53) | |
| C-Reactive Protein (hs-CRP) | 26.3 (2.0, 99.10) | |
| Albumin (mean) | 32.67 (6.31) | |
Table 2. Important parameters collected from patients.
Results of model
From the above table, the three biomarkers and Age are selected to predict the mortality of individual patients with high accuracy. The selected bio markers are Lactic Dehydrogenase (LDH), Lymphocyte (LC) and C-Reactive Protein (hs-CRP). LDH and CRP are related to respiratory function (PaO2/FiO2) and predictors of respiratory failure in COVID-19 patients. In glucose chemical mechanism, LDH changes pyruvate to lactate. LDH secretion is caused by necrosis of the cell membrane, resulting in viral or lung infection like pneumonia. CRP is a plasma protein generated by the liver and induced by different inflammatory substances. This acute phase reactant is used as a biomarker for various inflammatory cases. LC is present in White Blood Cells (WBCs), which is produced from the bone marrow and lymphoid tissue. Figure 3 presents the model explanation in terms of the selected features.

Figure 3. a) Average prediction for LDH; b) Average target for LDH; c) AUC curves for Importance of features
Figure 3(a) and (b) shows the average prediction and target for LDH among the other features. Figure 3(a) shows that the partial dependence of LDH remains constants from 0.8, when the value of LDH increases beyond 500. Similarly, Figure 3(b) shows that average target reaches almost 1, when LDH increases beyond 500. Figure 3(c) shows the AUC curves of all the 4 features. It shows that LDH having the highest importance among the other features.
Classification results of CIXCNet
This section presents the results of CIXCNet classifier. Table 3 shows the results of predicted results for survival and death.
| Outcomes | Precision | Recall | F1-Score | Support |
| Survival | 0.99 | 0.97 | 0.98 | 125 |
| Death | 0.98 | 0.99 | 0.97 | 112 |
| Accuracy | 0.99 | 236 | ||
| Weighted average | 0.985 | 0.98 | 0.98 | 157 |
Table 3. Results of classification accuracy.
The performance of the proposed CIXCNet classifier is compared against the CNN-XGboost, XGBoost, CNN, Support Vector Machine (SVM) and Neural Network (NN) classifiers.
Figures 4-7 show the comparison results of all these classifiers for accuracy, precision, recall and F-measure, respectively, at various training stages.

Figure 4. Comparison results of accuracy.
From Figure 4, we can infer that the proposed CIXCNet classifiers achieves the highest accuracy (around 97%), followed by CNN-XGBoost (around 95%). CIXCNet yields 2-3% improvement over the normal CNN-XGBoost classifier, because of the hyper parameter optimization, increases the accuracy. At the same time, it has 6% improvement over XGBoost and CNN, 14% improvement over SVM and 12% improvement over NN, since the combination of XGBoost with CNN enhances the quality of the learning phase.

Figure 5. Comparison results of Precision
From Figure 5, we can infer that the proposed CIXCNet classifier achieves the highest precision (around 96%), followed by CNN-XGBoost (around 95%). CIXCNet yields 1% improvement over the normal CNN-XGBoost classifier. At the same time, it has 4% improvement over XGBoost, 2% improvement over CNN, 32% improvement over SVM and 11% improvement over NN, since the combination of XGBoost with CNN enhances the quality of the learning phase.

Figure 6. Comparison results of recall.
From Figure 6, we can infer that the proposed CIXCNet classifier achieves the highest recall (around 95%), followed by CNN-XGBoost (around 92%). CIXCNet yields 3% improvement over the normal CNN-XGBoost classifier. At the same time, it has 10% improvement over XGBoost, 5% improvement over CNN, 28% improvement over SVM and 12% improvement over NN, since the combination of XGBoost with CNN enhances the quality of the learning phase.

Figure 7. Comparison results of F1-measure.
From Figure 7, we can infer that the proposed CIXCNet classifier achieves the highest F1-score (around 96%), followed by CNN-XGBoost (around 92%). CIXCNet yields 4% improvement over the normal CNN-XGBoost classifier. At the same time, it has 6% improvement over XGBoost, 4% improvement over CNN, 30% improvement over SVM and 28% improvement over NN, since the combination of XGBoost with CNN enhances the quality of the learning phase.
Table 4 shows the comparison results of these classifiers in terms of the metrics accuracy, precision, recall and F1-score.
| Model | Accuracy (%) | Precision (%) | F1-score (%) | Recall (%) |
| CIXCNet | 97 | 96 | 96 | 95 |
| CNN-XGBoost | 95 | 95 | 92 | 92 |
| CNN | 91 | 92 | 90 | 85 |
| XGBoost | 91 | 94 | 92 | 90 |
| SVM | 83 | 65 | 67 | 68 |
| Neural network | 85 | 85 | 69 | 83 |
Table 4. Comparison results of various classifiers.
Convergence time and computational complexity
The computational complexities of the proposed and existing algorithms were analyzed on Graphics Processing Units (GPU) settings. The Table 5 shows the convergence time and computational complexity of the algorithms.
| Model | Complexity (in seconds) | Convergence time (seconds) |
| CIXCNet | 10.3 | 0.008 |
| CNN | 9.75 | 0.015 |
| SVM | 9.88 | 0.038 |
| Neural network | 10.21 | 0.047 |
Table 5. Computational complexity and convergence time
As we can see from the Table 5, the proposed CIXCNet algorithm has the least convergence time around 0.008 seconds which is 46%, 78% and 82% lesser than CNN, SVM and NN, respectively. But its computational complexity is slightly higher around 10.3 seconds which is 5%, 4% and 0.8% higher than CNN, SVM and NN, respectively.
In this paper, CIXCNetclassifier is designed as a death rate estimation model for COVID-19 patients to determine vital biomarkers of patient’s mortality. The CIXCNet combines the performance of CNN and XGBoost integrated with CI. The CIXCNet model is simulated in Python with Anaconda environment The dataset contains the time series data of medical information of 375 patients the training data set contains 275 patients and testing data contains 110 patients. For predicting the mortality rate, the biomarkers LDH, LC and hs-CRP are identified along with the age parameter. The performance of the proposed CIXCNet classifier is compared with CNN-XGboost, XGboost, CNN, NN and SVM classifiers in terms of accuracy, precision, recall and F1-score metrics. Performance results have proved that CIXCNet classifier achieves higher accuracy around 97%, precision around 96%, recall around 95% and F1-score around 96%, when compared with other classifiers.
[Crossref] [Google Scholar] [PubMed]
[Crossref] [Google Scholar] [PubMed]
[Crossref] [Google Scholar] [PubMed]
[Crossref] [Google Scholar] [PubMed]
[Crossref] [Google Scholar] [PubMed]
[Crossref] [Google Scholar] [PubMed]
[Crossref] [Google Scholar] [PubMed]
[Crossref] [Google Scholar] [PubMed]
[Crossref] [Google Scholar] [PubMed]
[Crossref] [Google Scholar] [PubMed]
[Crossref]