- Thukaram , B. D., and Kashyap, K. H., "Artificial Neural Network Application to Power System Voltage Stability Improvement," inTENCON 2003. Conference on Convergent Technologies for Asia-Pacific Region, pp. 53-57, 2003.
- Yorino, N., Sasaki, H., Masuda, Y., and Et al., ''An investigation on Voltage Stability Problems'', IEEE Transactions on Power Systems, Vol. 7,No 2, pp 600-607, 1992.
- Tamura, Y. M., and Iwamoto, H. S., '' Relationship Between Voltage Instability and Multiple Load Flow Solutions in Electric Power Systems'',IEEE Transaction on Power Apparatus and Systems, PAS-102, No 5, pp. 1115-1125 , 1993.
- Lof, P.A., Anderson, G., and Hill, D. J. , '' Voltage Stability Indices of the Stressed Power Systems'', IEEE Transactions on Power Systems,Vol. 8, No. 1, pp. 326-335, 1993.
- Jinli, Z., and Yixin, Y., "Equivalent Network for Determination of Voltage Stability Limit", IEEE School of Electrical andAutomation Engineering Tianjin University, China, 2003.
- Yahia, F. Z., Doud, K. R., and Mohamed, D. E., ''Method of Computing Maximum Loadability Using Continuation Power Flow, Case StudyNational Grid of Sudan'' ,Proc of ICCEEE Conference, Sudan 26-28, august 2013.
- Bansilal, Thukaram, D., and Parthasarathy, K., ''Optimal Reactive Power Dispatch Algorithm for Voltage StabilityImprovement’’, Electrical Power and Energy Systems, Vol. 18, No. 7, pp. 461-468, 1996.
- Huang, G.M., and Nair, N.C., ''Voltage Stability Constrained Load Curtailment Procedure to Evaluate Power System ReliabilityMeasures'', IEEE Transactions on Power Systems, 2002.
- Sode –Yome, A., Mithulan, N. , and Lee, K.Y., "A Maximum Loading Margin Method for Static Voltage Stability in Power Systems", IEEETransactions Power Systems, Vol. 21, pp.799- 808, 2006 .
- Ruan, S. Y., Li, G. J., Ooi, B. T. and Sun Y.Z., "Power System Damping from Real and Reactive Power Modulations of Voltage SourceConverter Station", IET Genera, Transmission. & Distribution Journal 2, pp 311-320, 2008.
- Ahmed, N. A. , and Miyatake, M., " A novel Maximum Power Point Tracking for Photovoltaic Application under Partially Shaded InsulationConditions", Electric Power Systems Res. 8, pp777–784, 2008.
- Blaabjerj, F., Chen, Z., and Kiaer, S.B., " Power Electronics as Efficient Interface in Dispersed Power Generation Systems ", IEEETransactions Power Electron, No 19, pp1186-1194, 2004.
- Khan, M.M., Arifin, S., Haque, A., and Al-Masood, N., “ Stability Analysis of Power System with the Penetration ofPhotovoltaic Based Generation”, International Journal of Energy and Power Engineering, Vol. 2, No. 2, pp. 84-89, 2013.
- Kessel P., and Glavitsch, H., “Estimating the Voltage Stability of a Power System,” IEEE Transactions Power Delivery, Vol.PWRD- 1, pp 346-354, 1986.
- University of Washington Power System Test Case Achieve, http://www.ee.washington.edu/research/pstca
- Saadat, H., ''Power System Analysis'', Tata McGraw-Hill, 1999.
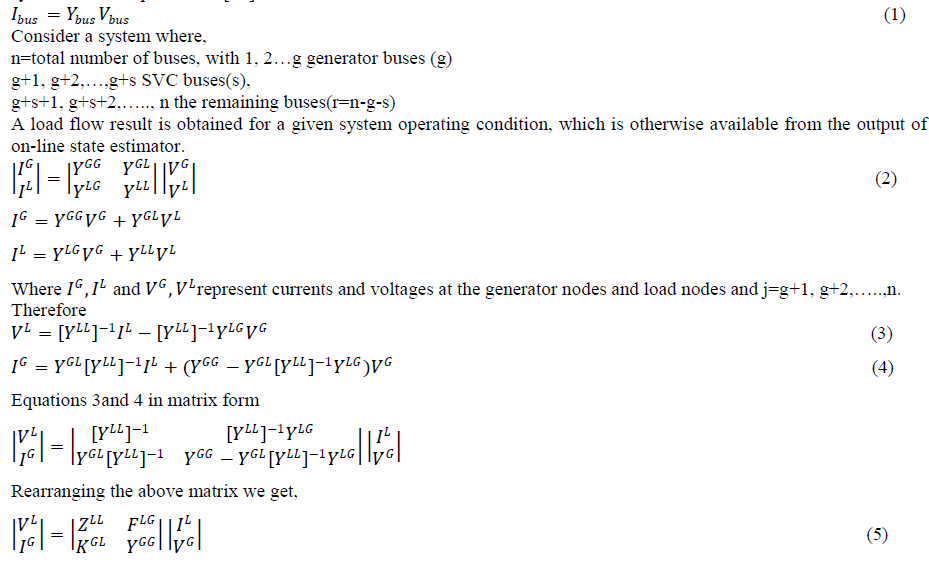
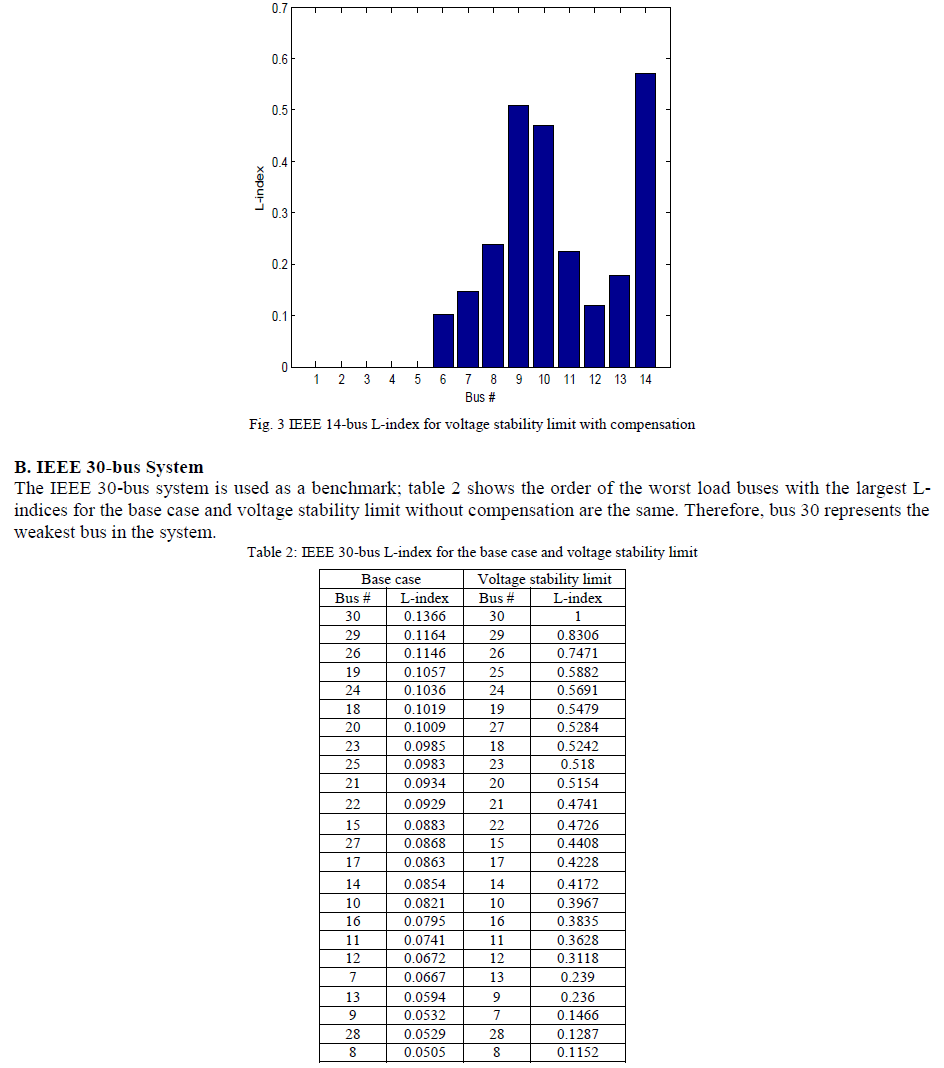
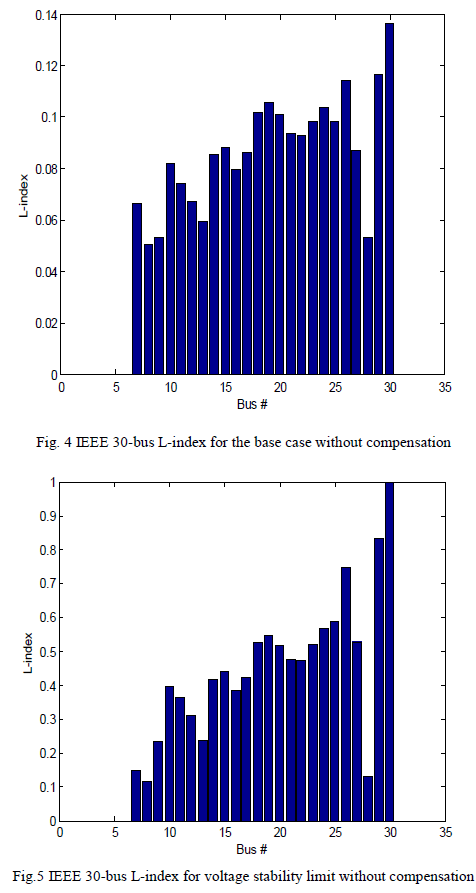
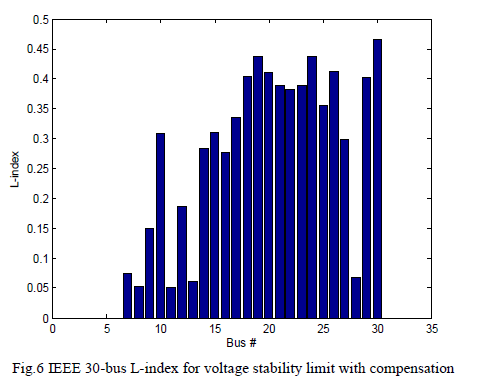
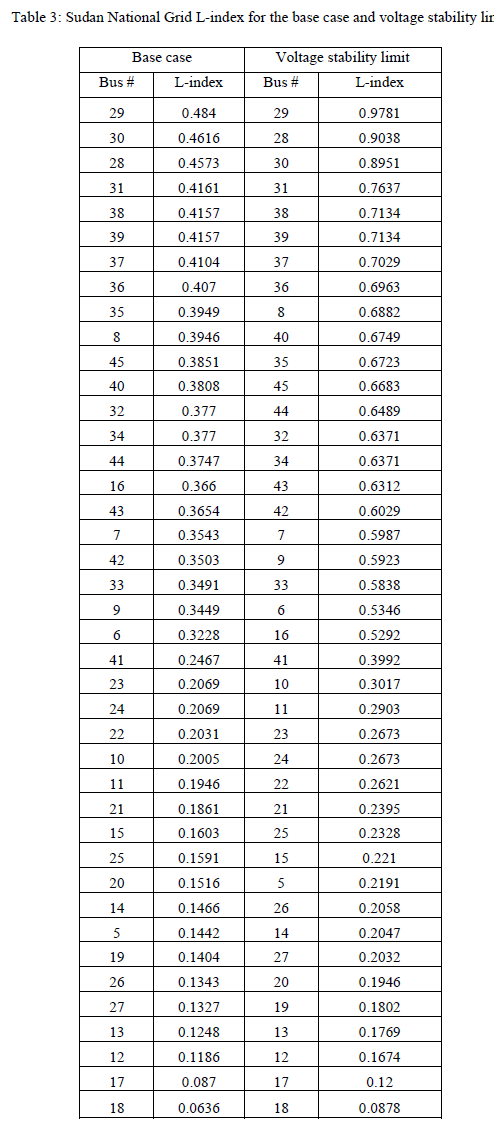
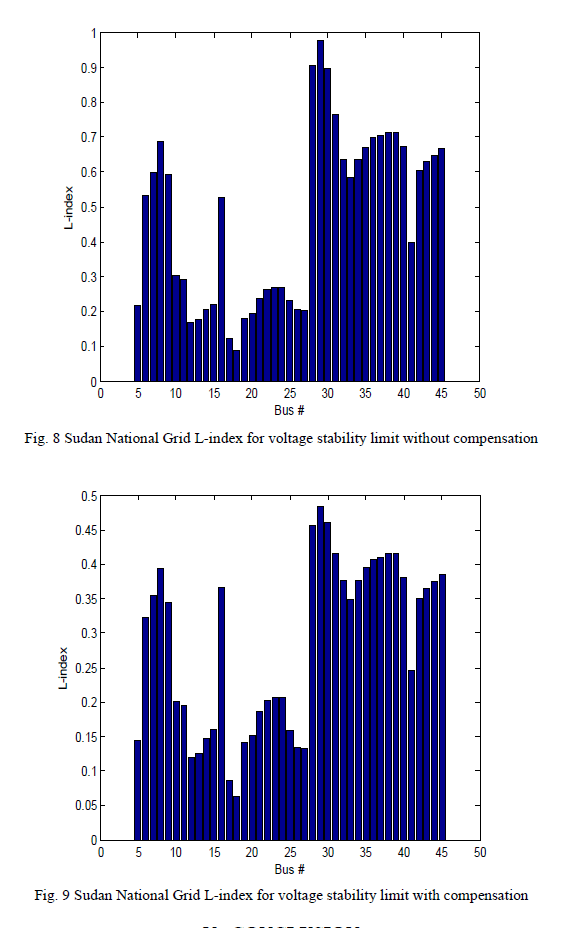
|