Research & Reviews in Pharmacy and Pharmaceutical Sciences
e-ISSN:2320-1215 p-ISSN: 2322-0112
e-ISSN:2320-1215 p-ISSN: 2322-0112
Swathi Kolisetty*, N. Sunitha, Rama Rao Nadendla
Department of Pharmaceutic, Chalapathi Institute of Pharmaceutical Sciences, LAM, Guntur, India
Received date: 13/04/2021; Accepted date: 18/05/2021; Published date: 25/06/2021
Visit for more related articles at Research & Reviews in Pharmacy and Pharmaceutical Sciences
A simple, rapid, and sensitive fluorimetric method was developed and validated to quantify quassia in polymeric nanocapsule suspensions and nonpolymeric suspensions, using acetonitrile as a solvent. The excitation and emission wavelengths were set at 397 nm and 465 nm, respectively. The calibration graph was linear from 0.05 to 0.25 μg/mL with a correlation coefficient of 0.9892. The detection and quantitation limits were 2.4 and 0.8 μg/mL, respectively. The validation results confirmed that the developed method is specific, linear, accurate, and precise for its intended use. The current method was successfully applied to the evaluation of curcumin content in lipid and polymeric nanocapsule suspensions during the early stage of formulation development.
Quassia; Fluorimetric method; Polymeric nanocapsules; Suspension
Quassia amara, also known as amargo, bitter-ash, bitter-wood, or hombre grande [1] (spanish for big man) [2] is a species in the genus Quassia, with some botanists treating it as the sole species in the genus. The genus was named by carl linnaeus who named it after the first botanist to describe it: the surinamese freedman graman quassi. Q. amara is used as insecticide, in traditional medicine and as additive in the food industry (Figures 1 and 2).

Figure 1: Stucture of Quassin.

Figure 2: Quassia bark.
A small, multistemmed and slow growing tree with a disorderly growth twiggy limb [4]. It is a shrub or rarely a small tree, reaching a height up to 6 metres [3,4,7,6]. The pinnate with 3-5 leaflets, deeply veined, polished alternated dark green leaves are 15–25 cm long and distinctive for their broadly winged axis and reddish veins. Leaf rachis are winged. Terminal red-branched racemes of panicles, 10–30 cm long, produces narrow, vivid crimson flowers, 2.5-3.5 cm long, that decorate the tips of each little limb [4,3,6]. The flower comprises 5 lanceolate petals, which remain mostly closed together forming a sharpening cylinder [3]. The flowers are produced in a panicle 15–25 cm long, each flower 2.5-3.5 cm long, bright red on the outside, and white inside. They are generally open for two days during the flowering period and each inflorescence presents on to four open flowers at once. The flowers are fragile and sometimes fall from the rachis at the slightest touch [8]. The fruits, five small eliptic, fleshy, purple black drupes, 0.8-1.5 cm long, replace the flower and turn red as they mature [4]. Every fruit contains one small seedling [3]. All parts of Q. amara contain the bitter Quassimarin.
The tree is predominately pollinated by hummingbirds but also self-compatible [4,8]. Besides hummingbirds, other birds and Trigona species from the Apidea family do pollination [8].
Chemicals and reagents
Quassia bark powder, HPMC, sodium lauryl sulphate, coconut oil, sodium chloride, acetonitrile.
Preparation of the colloidal suspensions
Nanocapsule suspensions: Lipid nanocapsule suspensions were prepared by the phase inversion method. An aqueous phase containing 7 ml distilled water, 0.06 g NaCl and 2 g surfactant was added to the oil phase containing 1.40 g coconut oil, and 5 mg quassia bark powder, both previously heated to 90ºC, under magnetic stirring. Three temperature cycles alternating from 60ºC to 95ºC were applied to achieve the inversion process. During the last cooling period, the suspensions were rapidly diluted with 25.0 mL cold water (approximately 0ºC) and continuously stirred for 30 min.
Polymeric nanocapsule suspensions: Polymeric nanocapsule suspensions were prepared using the interfacial deposition process after solvent displacement. 40 mg sodium lauryl sulphate, 0.25 ml coconut oil, and 2.5 mg quassia bark powder were dissolved in 2 ml of acetone. The resulting solution was mixed with a 10 ml acetone:ethanol (3:2, v/v) mixture and the final volume was adjusted to 8 ml. This organic phase was poured into an aqueous phase (26.0 ml) containing 0.375% (w/v) of sodium lauryl sulphate, maintained under magnetic stirring. The organic solvents were then eliminated by evaporation under reduced pressure, and the final volume of the colloidal suspension was adjusted to 10.0 ml.Polymeric nanocapsule suspensions were filtered through filter paper and were analyzed in the fluorimetric system after dissolution in acetonitrile.
Fluorimetric method: The fluorescence spectra of quassia bark powder were recorded on a systronics Spectrofluorimeter. The sample was continuously stirred in a standard 1 cm quartz cell. The samples were excited at 397 nm and the emission spectra were recorded from 440 to 600 nm. The relative fluorescence intensities were measured at λemi=465 nm.
Preparation of stock and working solutions: A stock solution was prepared by accurately dissolving 10 mg of quassia bark powder in 100.0 mL of acetonitrile. From this solution, a working standard solution of 100.0 μg/mL was prepared in acetonitrile. This solution was then diluted as needed to prepare different standard solutions: 0.05, 0.1, 0.15, 0.2 and 0.25 μg/mL in acetonitrile.
Method validation
The validation parameters evaluated were specificity, linearity and range, accuracy, precision, Limit of Quantification (LOQ) and Limit of Detection (LOD). The performance characteristics were based on the pharmaceutical regulatory guidelines of the International Conference on Harmonization (2005) and United States Pharmacopeia (2007).
(a) Specificity: The specificity of the fluorimetric method was evaluated by analyzing unloaded nanocapsule suspensions in order to verify whether the excipients used in the formulations of the nanocapsule suspensions interfered in the curcumin quantification. The samples were analyzed in the fluorimetric system in triplicate.
(b) Linearity and range: Six standard solutions ranging from 0.05 to 0.25 μg/mL, in concentration, 3 replicates each, were analyzed in the fluorescence system. The calibration graph was obtained by plotting the fluorescence intensity of the standard solutions against the theoretical standard concentrations. The linearity was evaluated by linear least-square regression analysis (Figure 3).

Figure 3: Calibration curve of different concentrations of quassia bark powder.
(c) Accuracy: The accuracy was investigated by spiking unloaded nanocapsule suspensions with known concentrations of quassia standard solution at 3 different levels (lower, medium and upper concentration) corresponding to quassia final concentrations of 0.05, 0.15 and 0.25 μg/mL. The analysis was performed in triplicate. The recovery (R) was estimated after fluorescence analysis using the following equation:
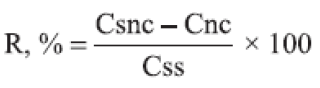
where R is recovery, Csnc is the quassin concentration in the spiked nanocapsule suspension, Cnc is the quassin concentration in unloaded nanocapsule suspension, and Css is the quassin concentration in standard solution.
(d) Precision: The precision of the method was determined by measuring the repeatability (intraday precision) and the intermediate precision (interday precision), both expressed as Relative Standard Deviation (RSD). The precision was evaluated by assaying standard solutions with different concentrations of quassin (0.05, 0.1, 0.15, 0.2, 0.25 μg/mL). The repeatability was evaluated by measuring 3 samples of each concentration of quassin on the same day under the same experimental conditions. The intermediate precision was evaluated by assaying each standard solution on 3 different days. The RSD was calculated (Table 1).
| S. No |
Intraday precision | Interday precision |
|---|---|---|
| 1 | 0.925 | 856 |
| 2 | 0.941 | 0.872 |
| 3 | 0.898 | 0.796 |
| 4 | 0.952 | 0.824 |
| 5 | 0.924 | 0.825 |
| 6 | 0.923 | 0.869 |
Table 1. Table showing values of intraday and interday precision.
(e) Limit of Quantification (LOQ): The LOQ value was calculated directly from the calibration graph. It is defined as the lowest concentration in the standard curve that can be measured with suitable precision and accuracy. LOQ may be expressed as:
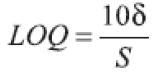
where δ is the Standard Deviation (SD) of y-intercepts of regression lines and S is the slope of the calibration graph.
(f) Limit of Detection (LOD): The LOD value was calculated directly from the calibration graph. It is defined as the lowest concentration in the standard curve that can be detected, but not necessarily quantified as an exact value. LOD may be expressed as:
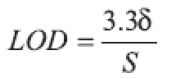
where δ is the Standard Deviation (SD) of y-intercepts of regression lines and S is the slope of the calibration graph.
Determination of Quassin loading in nanocapsules
Drug content were estimated after determination of the quassia concentration in the nanocapsule suspensions by fluorescence spectrophotometry. The concentration of drug in the supernatant obtained by the suspension after filtration the drug content of is found to be 24.8 mL of suspension.
A representative emission spectrum of quassin obtained shows an intense emission band in the 450-600 nm wavelength region, exhibiting a fluorescence maximum at 465 nm. In order to prove the specificity of the method, unloaded lipid and polymeric nanocapsule suspensions containing the same concentration of the excipients were analyzed. The method was specific because no interference from the excipients was detected at 465 nm under the fluorimetric conditions employed.
The calibration graph for quassin lipid and polymeric nanocapsules was linear over the range of 0.05 to 0.25 μg/mL with a correlation coefficient of 0.9892. The regression equation of the mean calibration graph (n=3) was: y=11.943x+1.095
The slope and the intercept were 11.943 and 1.095 respectively. The LOQ and LOD of the method calculated were 2.4 and 0.8 μg/mL, respectively, indicating that the method was sufficiently sensitive to be used for the drug entrapment evaluation.
The precision of the developed method is mentioned in Table 1. The results showed that the intraday and interday RSD values were lower than 5.0%. The fluorescence intensities indicated satisfactory intraday and interday variability.
The accuracy of the method was evaluated using three developed nanocapsule suspensions: using sodium lauryl sulphate surfactant at 3 different levels. Each level was tested 3 times. The results given in demonstrate that the method exhibits acceptable accuracy (Table 2).
| Sample | Amount added (ug/ml) | Measured Concentration(ug/ml) | Recovery | %RSD |
|---|---|---|---|---|
| Polymeric Nano capsule | 0.05 | 0.05 | 100 | 3 |
| 0.1 | 0.1 | 100 | 2.9 | |
| 0.15 | 0.15 | 97.2 | 1.6 |
Table 2. Table showing Recovery.
The concentration of drug in the supernatant obtained by the suspension filtration procedure was lower than the LOQ of the method, indicating that only a very low concentration (<0.10 μg/mL) was not encapsulated. Since the total concentration of quassin ranged from 107.04 to 498.49 μg/mL, it is possible to state that for all formulations, the entrapment efficiency values were higher than 99%. These high values of entrapment efficiency obtained for quassin could be related to the higher affinity of this hydrophobic drug for the oil core of nanocapsules. The quassin was completely recovered in the colloidal suspensions, independent of the drug amount initially added to the formulations. The differences of drug content values in the nanocapsule suspensions are related only to the differences in the final volume of the preparations. The results demonstrated that the fluorimetric method can be successfully applied to determine quassin in normal and polymeric nanocapsule suspensions (Figure 4).
The fluorimetric method developed and validated proved to be specific, linear, accurate, precise and sensitive. It was successfully used to quantify quassia in polymeric nanocapsule suspensions and can be applied for the determination of entrapment efficiency and drug content, not only for formulation studies, but also as a pre-requisite to undertaking further chemical stability evaluation and preclinical studies of the nanocapsule suspensions.
We are thankful for CDTL, Chalapathi Institute of Pharmaceutical Sciences for their help without which the work would not be completed.