Research & Reviews in Pharmacy and Pharmaceutical Sciences
e-ISSN:2320-1215 p-ISSN: 2322-0112
e-ISSN:2320-1215 p-ISSN: 2322-0112
1Department of Pharmaceutical Analysis, Procadence Institute of Pharmaceutical Sciences, Rimmanaguda, Medak (dt), Andra Pradesh, India.
2Assistant Manager, Department of Pharmacokinetics, Mylan Laboratories, Hyderabad, Andhra Pradesh, India.
3Principal, RIPER, Anantapur, Andhra Pradesh, India.
4Associate Professor of Chemistry, JNTU-College of Engineering, Anantapur, Andhra Pradesh, India.
Received: 29/03/2013 Accepted: 12/04/2013
Visit for more related articles at Research & Reviews in Pharmacy and Pharmaceutical Sciences
A simple, sensitive, rapid, economic, UV Spectroscopic method was developed for the estimation of Sitagliptin-Metformin in Pure and Tablet dosage forms. The linearity for Metformin was found between 200-400 μ/ml and between 20-45 μ/ml for Sitagliptin. Metformin showed the maximum absorbance at 232nm & Sitagliptin at 266nm and Validation parameters like Precision, Accuracy, and System suitability parameters were determined and examined by applying validated parameters.
Metformin, Sitagliptin, Method development, Validation, UV Spectroscopy
Sitagliptin is (3R) -3-amino-1-[3-(trifluoromethyl)-6,8-dihydro-5h- [1,2,4] triazolo [3,4-c] pyrazin-7-yl]-4-(2,4,5-trifluorophenyl) butan-1-one, an oral hypoglycemic agent that blocks the dipeptidyl peptidase 4 (DPP-4) enzyme activity [1,2]. This enzyme inhibition will leads to increased amount of active incretins, glucagon like peptide- 1 (GLP-1) and gastric inhibitory polypeptide (GIP), which significantly increases insulin secretion. And in turn decreases blood glucose level [3].
Metformin is 3-(diaminomethylidene)-1, 1-dimethylguanidine, the biguanide class drug from of oral hypoglycemic agents [1,2]. It is the first line drug of choice for the treatment of type 2 diabetes lowering both basal and postprandial plasma glucose. This drug is given orally in the treatment of non insulin-dependent diabetes mellitus [1].
The literature review suggested that there were methods available for the estimation of Sitagliptin [4-10] and Metformin [11,12] individually with the help of instruments like UV-Spectrophotometer and HPLC. An attempt was made to develop a UV-Spectroscopic method which is precise, accurate, simple, and most economic method so far for their simultaneous determination.
Distilled water is used as common solvent. Pure drugs of Metformin and Sitagliptin were obtained from Mylan Laboratories and the commercial tablets Janumet containing Metformin 500mg and Sitagliptin 50mg were purchased from local pharmacy. The specifications of the instruments and all the conditions maintained were shown in Table-1.

Figure 1: Structure of sitagliptin

Figure 2: Structure of Metformin

Table 1: Optimized Conditions
The standard solutions of Metformin & Sitagliptin were taken and scanned individually in the range of 200-400nm for their maximum absorbances. Metformin showed maximum absorbance at 232nm(λ1) & Sitagliptin at 266nm (λ2).Calibration curves were constructed at their linearity ranges. The linearity range for Metformin was found to be in between 10-50μg/ml and Sitagliptin it is between 20-80μg/ml The absorbances and absorptivities were measured and the concentrations were calculated using the following equations.
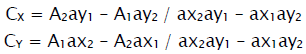
Where A1 & A2 are absorbances and CX & CY are the concentrations of Metformin and Sitagliptin respectively.
100mg portions of Metformin and Sitagliptin were separately dissolved in 100ml volumetric flasks and make up the volume with distilled water. From this above stock solutions prepare 10μg/ml concentrations of Metformin & Sitagliptin individually.
20 tablets were powered finely and a weight of tablet powder equivalent to 100 mg of Metformin (which also contain a tablet powder equivalent to 10 mg of Sitagliptin). Stock solution was prepared by dissolving it in 100 ml of distilled water. From the above solution 10ml was withdrawn and made up to 100 ml. This solution was considered as sample solution and was used for assay [13-17].
An attempt was made to develop a UV Spectroscopic method which is economic, accurate, precise and sensitive for the determination of Metformin-Sitagliptin in combined dosage form. The spectroscopic conditions were optimized. Metformin was found linear between the concentrations 10 to 50 μg/ml and 20 to 80 μg/ml for Sitagliptin. Their correlation coefficients were found from the linear graph as 0.99928 and 0.99977 for Metformin and Sitagliptin respectively. Limit of Detection and Limit of Quantification(table-1) were calculated from the regression lines using their standard deviation and slope.LOQ is 3.3s/S & LOD is 10s/S. All the optimized conditions were mentioned (table-1). The precision (Table-2) of the method was determined from one lot of combined dosage forms by considering intraday & inter day measurements. The accuracy (Table-3) of the method was checked by performing recovery studies. The recovery was determined at three levels Viz- 80, 100 and 120% of the selected concentrations. Three samples were prepared for each recovery level. The assay (Table-4) was made for the combination tablets by preparing the solutions of concentrations from tablet powder which falls between the linear ranges of standard solution. All the validated parameters were checked by applying statistical formulas such as standard and relative standard deviation. The results were found to fall within the prescribed limits.

Table 2: Precision Data for Sitagliptin & Metformin

Table 3: Accuracy Data for Sitagliptin & Metformin

Table 4: Assay Data for Sitagliptin & Metformin

Figure 3: UV Overlain spectrum of Metformin & Sitagliptin
The present combination Metformin and Sitagliptin is marketed as one formulation (Janumet 50 mg/500mg).
The fixed dose combination tablet of Metformin and Sitagliptin was subjected to simultaneous estimation by UV Spectroscopic method. The proposed method was validated by evaluation of the validation parameters. Assay was performed within a short analysis time.
Highly reliable and cost efficient UV method was developed for the quantitative estimation of Metformin and Sitagliptin in combined tablet dosage form. The results obtained were reproducible and reliable. The validity and precision of the methods were evident from the statistical and analytical parameters obtained.
From the forgoing it is concluded that the methods developed are simple, rapid, selective and precise hence suitable for application in routine analysis of pharmaceutical preparations.
The authors are thankful to Mylan Laboratories, Hyderabad for providing gift samples of Metformin and Sitagliptin for the research work.