International Journal of Innovative Research in Science, Engineering and Technology
ISSN ONLINE(2319-8753)PRINT(2347-6710)
ISSN ONLINE(2319-8753)PRINT(2347-6710)
Mohd. Talha Khan1 and R.S. Jadoun2
|
| Related article at Pubmed, Scholar Google |
Visit for more related articles at International Journal of Innovative Research in Science, Engineering and Technology
In this study, the gap between customer expectations and perceptions in Hero, Bajaj and Honda two wheeler automobile service industries is evaluated using SERVQUAL model with the objective of determining how satisfied the customers are with the services being provided by these automobile industries. For this, the data was collected in the form of questionnaire from users of Hero, Bajaj and Honda two wheeler automobile service industries. The hypothesis of the study is analysed using Paired t test, Results of the study show that Bajaj with overall perceived service quality level 2.972 provides the best after sales service followed by Hero with 2.869 and Honda with 2.822. It is also found that there is significant gap between customer expectation and perception in case of Hero and Honda whereas there is no significant gap found in Bajaj service industry.
Keywords |
| SERVQUAL, Service Quality, Customer Satisfaction, Hero, Bajaj, Honda. |
INTRODUCTION |
| The importance of the service sector has sharply increased in the countries in today’s high competitive global market. The expectations and demands of the public are increasing day by day. Normal infrastructure and processes fall short in fulfilling those expectations and demands. As a result of which service sector is going through revolutionary change, which affects the way in which we live and work. Hence, new services are being launched on regular basis to meet the existing and potential needs of customers. Now, service becomes one of the most important elements for gaining a competitive advantage in the marketplace. The efforts of service managers and academic researchers are directed towards understanding how customers experience or perceive the quality of service. Service providers mainly focus on providing superior service quality to achieve higher level of customer satisfaction. Satisfying customers is one of the main objectives of every business as it can result in increasing the company’s income and they are more likely to purchase additional products and services and often generate new businesses for the companies through word-of-mouth recommendation. The study area that has attracted significant interest towards the understanding of customer satisfaction is service quality. The object of improving service quality is to give rise to customer satisfaction. Service quality, as perceived by the consumer can have both direct and indirect impact on customer loyalty. The size of service sector is increasing in almost all economies around the world. At one end there are huge international corporations operating in industries such as airlines, banking, hotels, telecommunications and insurances. At the other end there are locally owned and operated small businesses such as restaurants, automobile service centers, beauty parlors, laundries, etc. Any service industry cannot survive in this highly competitive environment until it satisfies its customers by providing good quality service by [1]. In services it is the customer who defines the quality and human side of service is key to deliver quality by Katarne and Sharma [2]. |
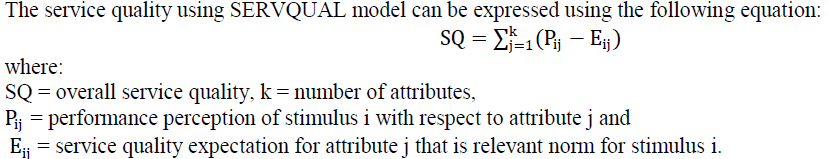
| The service quality in service sectors is mostly measured using a SERVQUAL model which is being developed by Parasuraman et al. [3] & [4]. The model contains 22 items for evaluating customer perceptions and expectations regarding the quality of service. A level of disagreement or agreement with a given item is rated on a Likert-type scale numbering from 1 to 7. The level of service quality is represented by the gap between perceived and expected service. The SERVQUAL model is based on five service quality dimensions, namely: Tangibles - physical facilities, equipment and personnel appearance, Reliability-ability to perform the promised service dependably and accurately, Responsiveness-willingness to help customers and provide prompt service, Assurance-knowledge and courtesy of employees and their ability to gain trust and confidence and Empathy-providing individualized attention to the customers. |
 |
| The following gaps are identified for evaluating the service quality and customer satisfaction by Parasuraman et al. [3]. |
| Gap 1: The gap between consumer expectation and management perception. |
| Gap 2: The gap between management perception and service quality specification. |
| Gap 3: The gap between service quality specification and service delivery. |
| Gap 4: The gap between service delivery and external communications |
| Gap 5: The gap between expected service and perceived service. |
| The first four gaps contribute to Gap 5, that is, the gap between customer expectations and customer perceptions of service received and it is this last gap which has been the main focus of this research. |
| In the recent years the global auto industry has been the subject of much analysis. Moreover the last decade has seen the Indian auto industry gain in maturity and confidence. The Indian automotive customer is well aware of global markets and products today, and hence expects the same levels of quality in products and services. In this scenario, providing effective after sales service for vehicles has become important for service center in India to stay in the highly competitive market. The competitiveness in the market and continuous search for differentiation has called more attention towards customer satisfaction and has increased the interest to research on the topic of service quality. According to Al-Shammari and SamerKanina [5] a common response to the question of what differentiates one automobile dealer from another often revolves around the customers; view of quality and the quality of customer service Hence good service providers are dedicated to satisfy the needs of customers. It is interesting to note that lot of research work has been conducted on sectors like hotels, health, public transport, telecommunication, banking whereas automobile service sector has limited published research on service quality and customer satisfaction by [7]. These limited researches imply that there are more questions than answers on service quality and customer satisfaction in automobile service sector. This study aims at providing the comparison of various two wheeler automobile industries (Hero, Bajaj and Honda) by measuring the service quality and effect of customer satisfaction using SERVQUAL model. This will hopefully increase the knowledge and understanding about the service quality that is being provided by various two wheeler automobile industries nowadays. |
| This study is aimed at providing the comparison of various two wheeler automobile industries (Hero, Honda and Bajaj). To achieve this, research work is designed to address the following objectives: |
| 1. Finding the gap between customer expectation and perception across different two -wheeler automobile service industries. |
| 2. Comparing the service quality of different two-wheeler automobile service industries and testing of the hypothesis made in this study. |
REVIEW OF LITERATURE |
1. Service quality |
| Parasuraman et al [3] defined service quality as the discrepancy between consumers’ perceptions of services offered by a particular industry and their expectations about industries offering such services. If perception of service is below the expectation of service then customers judges quality as low and if perception of service is equal or above the expectation of service then customers judges quality as high. |
| Dehgan [7] defined service quality as the subjective comparison that customers make between the quality of service that they want to receive and what they actually get. |
| [8] defined service as an act or performance that one party can offer to another that is essentially intangible and doesn’t result in the ownership of anything. They also stated that services have four distinctive characteristics which are intangibility, inseparability, variability and perishability. |
| Vijaykanth Urs et al. [9] defined service quality as the consumers’ overall impression of the relative inferiority/superiority of the organization and its services. Therefore, service quality is a key for survival to all service providing companies. With service, companies not only retain their existing customers but increase chances of getting and attracting new customers. |
2. Customer satisfaction |
| Dehgan [7] defined customer satisfaction as a result of cognitive and effective evaluation, where some comparison standard is compared to the actually perceived performance. If perceived performance is less than expected than customer will be dissatisfied. On the other hand if perceived performance exceeds expectations, customer will be satisfied. |
| [10] stated that good customer satisfaction has an effect on the profitability of nearly every business. When customers perceive good service, each will typically tell nine to ten people. It is estimated that nearly one half of American business is built upon this informal, “word-of-mouth” communication. The cost of gaining a new customer is ten times greater than the cost of keeping a satisfied customer. In fact, if the service incident is negative, the negative effects can last years through repeated recollection and recounting of the negative experience. |
| Jhanshahi et al. [11] stated that customer satisfaction has been defined in various ways, but the conceptualization that has achieved the widest acceptance is that customer satisfaction is a post choice evaluative judgment of a specific transaction. They also identified three general components of customer satisfaction: customer satisfaction is a response, the response pertains to a particular focus and the response occurs at a particular time. |
| Vijaykanth Urs et al. [9] defined customer satisfaction as an individuals’ reaction in the form of sequence of an information processing, valuation of the degree to fulfil the functions which a good service should posses. It also includes the feeling of happiness or joy of matching the expectation and having pleasure while consuming the service. |
3. Service quality in automobile industry |
| Katarne and Sharma [2] in his study measured current service quality level of a typical automobile dealership in an Indian city. The satisfaction/dissatisfaction of the customer has been measured using standard statistical tools, and an attempt has been made to find out reason(s) of dissatisfaction by applying root cause analysis and results of the study show that delay in delivery is the most critical reason responsible for dissatisfaction or poor service quality level. |
| [12] studied service quality and customer satisfaction in automobile after sales services in two Indian companies (Bahman Group and Irankhodro) and one foreign company General Motor Group. The results of the rate of customer satisfaction of after sales service for three companies in every five dimensions were analysed separately. The two Indian companies have no significant difference in all the dimensions but showed a meaningful significant difference with other foreign company in all the dimensions. |
| Jhanshahi et al. [11] conducted a research to find the relationship between customer service and product quality with customer satisfaction and loyalty in the context of the Indian automotive industry. Results of the study showed that there are high positive correlation between the constructs of customer service and product quality with customer satisfaction and loyalty. |
| [13] conducted a study on the perceived service quality in Australian automobile insurance industry by employing SERVQUAL scale. The results indicates that SERVQUAL scale relates better with advanced economy of Australia compared to less advanced economy countries which was investigated in earlier studies. |
| [14] conducted an empirical study on the relationship between after sales service qualities in China Automobile sector and they found that fairness, empathy, reliability and convenience have significant positive impact on customer satisfaction while responsiveness doesn’t have a significant impact on customer satisfaction and at the same time satisfaction has a significant positive impact on trust and trust has a significant positive impact on commitment. They also found satisfaction and commitment both have a significant positive impact on relationship value but trust cannot impact relationship value directly. |
| Vijaykanth Urs et al. [9] studied the gap between expected and perceived quality measured through SERVQUAL method to know the current situation of automobile service in Karnataka. Two independent samples of personal vehicle users and Fleet vehicle users are selected for comparative analysis and they find that there is considerable gap found in Expected and Perceived quality for the factors like Reliability, Responsiveness and Empathy. |
| Al-Shammari and SamerKanina [5] examined service quality in Saudi Automotive Company and they concluded that that the most important quality dimensions from customer’s viewpoint was the Reliability and Assurance followed by Tangibility and Responsiveness while the Empathy dimension was the least important. |
RESEARCH CONCEPTUAL FRAMEWORK AND HYPOTHESIS DEVELOPMENT |
| Customers hold different types of expectations and perceptions about service. The study measures the perceived service quality separately for the three two wheeler automobile industries. The service quality gap (i.e. gap between what customers expect to receive and their perceptions of the service that actually is delivered) is the most critical gap. The objective is to close or narrow this gap to improve the service quality by comparing expected and perceived service quality. This is expressed in the form of a conceptual framework as shown in Fig. 1. |
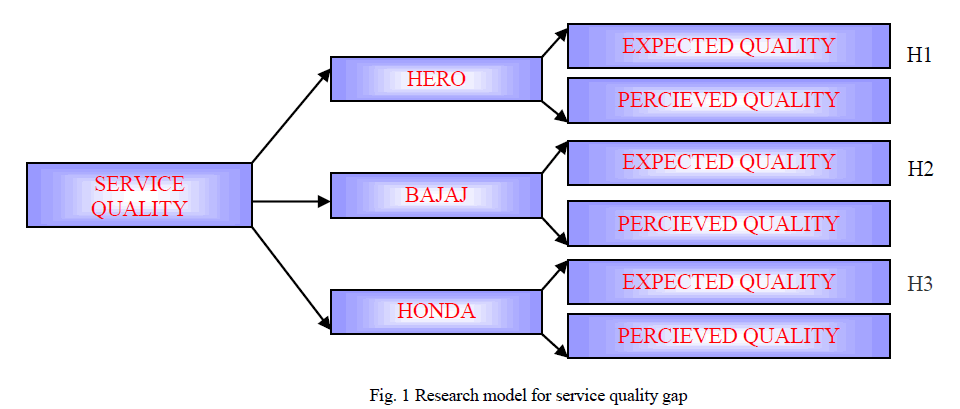 |
| From fig. 1 it can be seen that the hypotheses of the study are framed for Hero, Bajaj, and Honda two wheeler users and stated as: |
| H1: There is significant difference of mean ratings between expected and perceived service quality parameters for Hero two wheeler automobile users. |
| H2: There is significant difference of mean ratings between expected and perceived service quality parameters for Bajaj two wheeler automobile users. |
| H3: There is significant difference of mean ratings between expected and perceived service quality parameters for Honda two wheeler automobile users. |
RESEARCH METHODOLOGY |
1. Procedure |
| The data is collected in three major cities of Uttar Pradesh, by means of structured questionnaire. The respondents for filling up of the data are the users of two wheeler automobiles of companies namely Hero, Bajaj and Honda. In total 50 respondents each from Hero, Bajaj and Honda users were selected for the study. The cities included in the study are Lucknow, Moradabad and Noida. |
2. Measures |
| The SERVQUAL scale developed by Parasuraman et al [3] & [4] is adapted for measuring service quality. The SERVQUAL model is modified and two more attributes (parking area and appropriate location) are added in the model to cover other aspects of two wheeler automobile industries and this further validated the research instrument. The modified SERVQUAL model includes 24 attributes for measuring the actual perception of service quality provided by two wheeler automobile industries. The answer format is a 5-point Likert scale ranging from strongly disagree (1) to strongly agree (5). |
3. Reliability and Validity of data |
| The current study applied internal consistency method because multiple items are used for all constructs. According to [15] the Cronbach alpha value of at least 0.70 is the basis of reliability. A pre-test for reliability is conducted by distributing questionnaires to 15 customers. The cronbach alpha value for this test is found to be 0.885 which is well above the cut-off value. Moreover the values of cronbach alpha for Hero, Bajaj and Honda are 0.877, 0.868 and 0.880 respectively which are also well above the cut-off value. |
| The current study is emphasized on content validity. In social sciences, the content validity can be verified with the professional knowledge of the researchers by [16]. Appropriate and relevant measurements for a study can be identified from literature review and the assistance of experts. This study concentrated on content validity through the review of literature and adapts instruments which are used in previous research. |
4. Statistical Tools for Data Analysis |
| The study is based on the data collected to measure the customers’ perception of service quality to assess the service gap in two wheeler automobile service industry. For this purpose 5-point Likert scale is used that is a numerical and more specifically, interval-scaled data. The data is analysed using SPSS 16 and paired t-test was performed for testing to draw a final conclusion about the gap between the customers’ expectation and perception about the service quality of two wheeler service industries (Hero, Bajaj and Honda). |
RESULTS AND DISCUSSIONS |
1. Determination of SERVQUAL Score: |
| SERVQUAL Score = Perception Mean Score- Expectation Mean Score Assuming an overall mean expectation level to be (3.00) meaning the customers expect a reasonable service from all attribute indicating their importance. |
2. Criteria for classification: |
| Note that any mean service attribute value below 3.00 (hypothesized mean) – poor service quality. This is also indicated by negative gap score. |
| Mean service attribute score above 3.00 – good service quality. This is also indicated by positive gap score. |
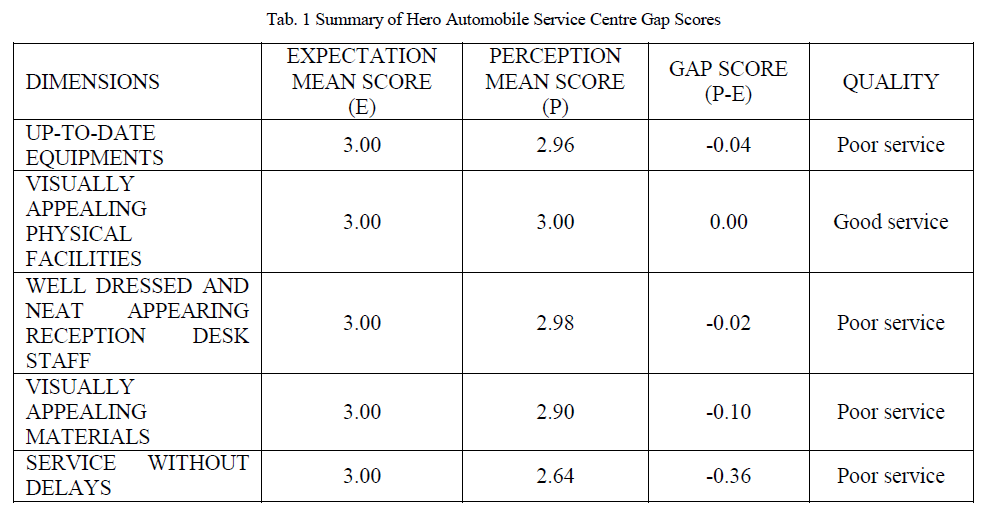
| The tables below show the gap between customers’ expectation and perception of service being offered in automobile service industries. Table 1, 2 and 3 shows the gap scores of Hero, Bajaj and Honda two wheeler automobile service industries respectively and their level of quality. |
 |
 |
 |
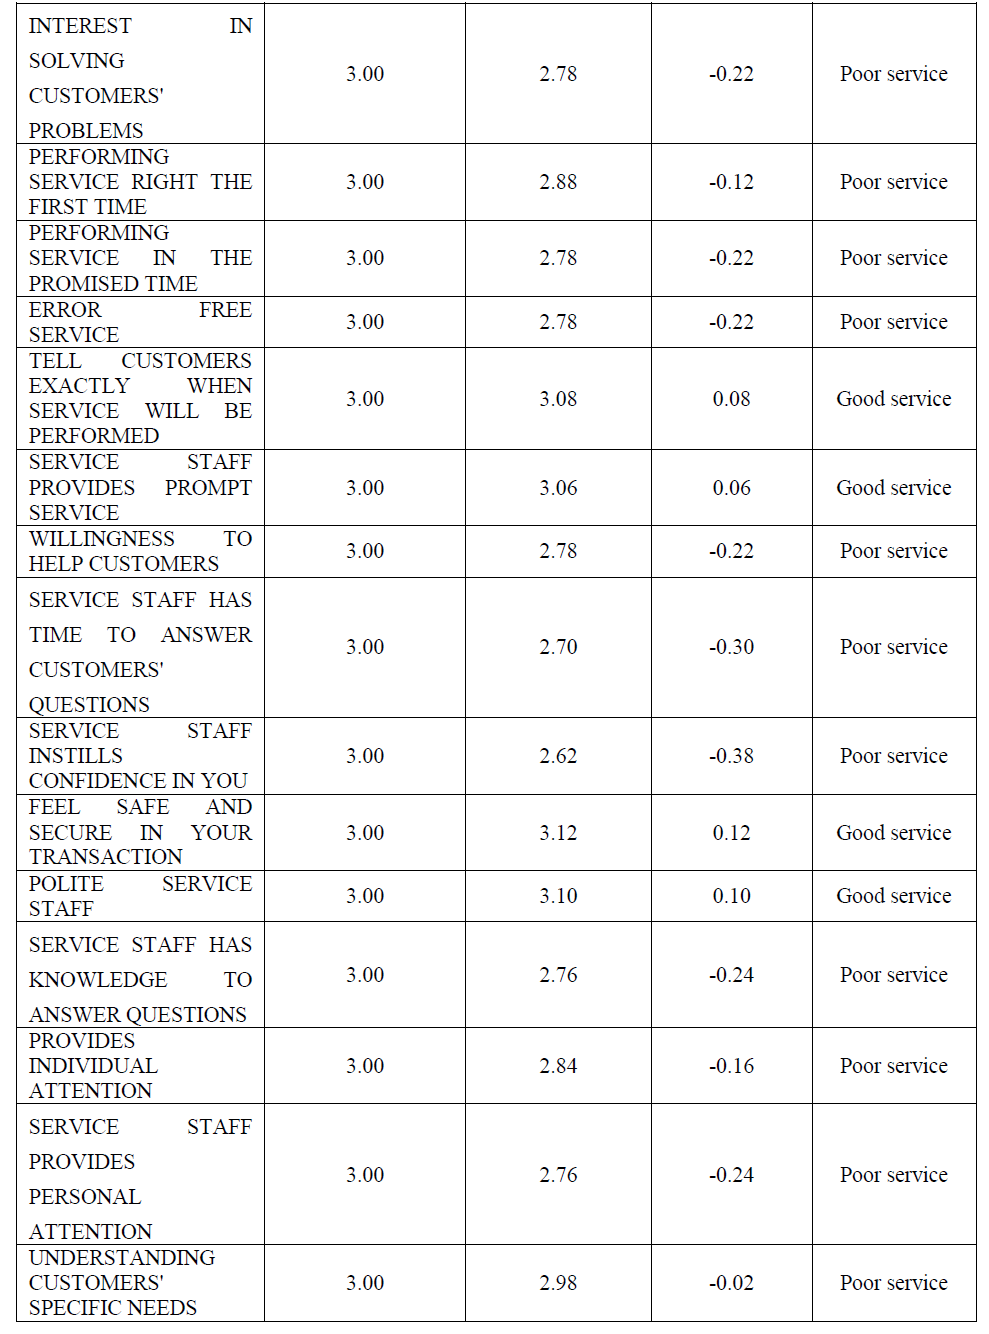
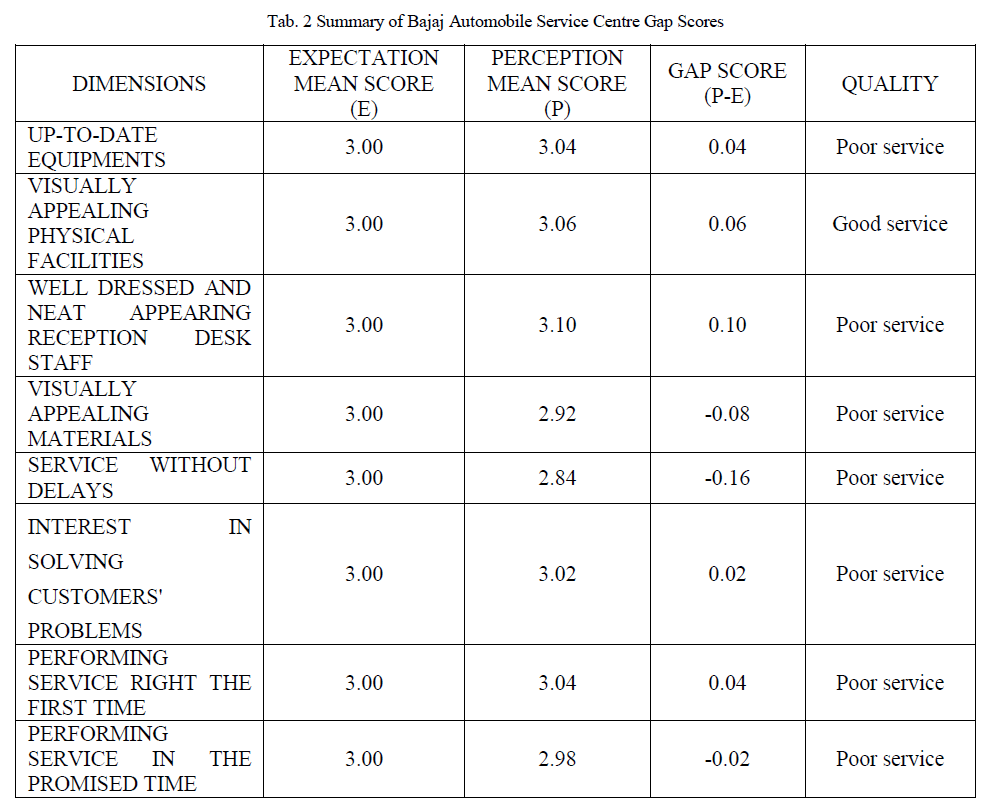
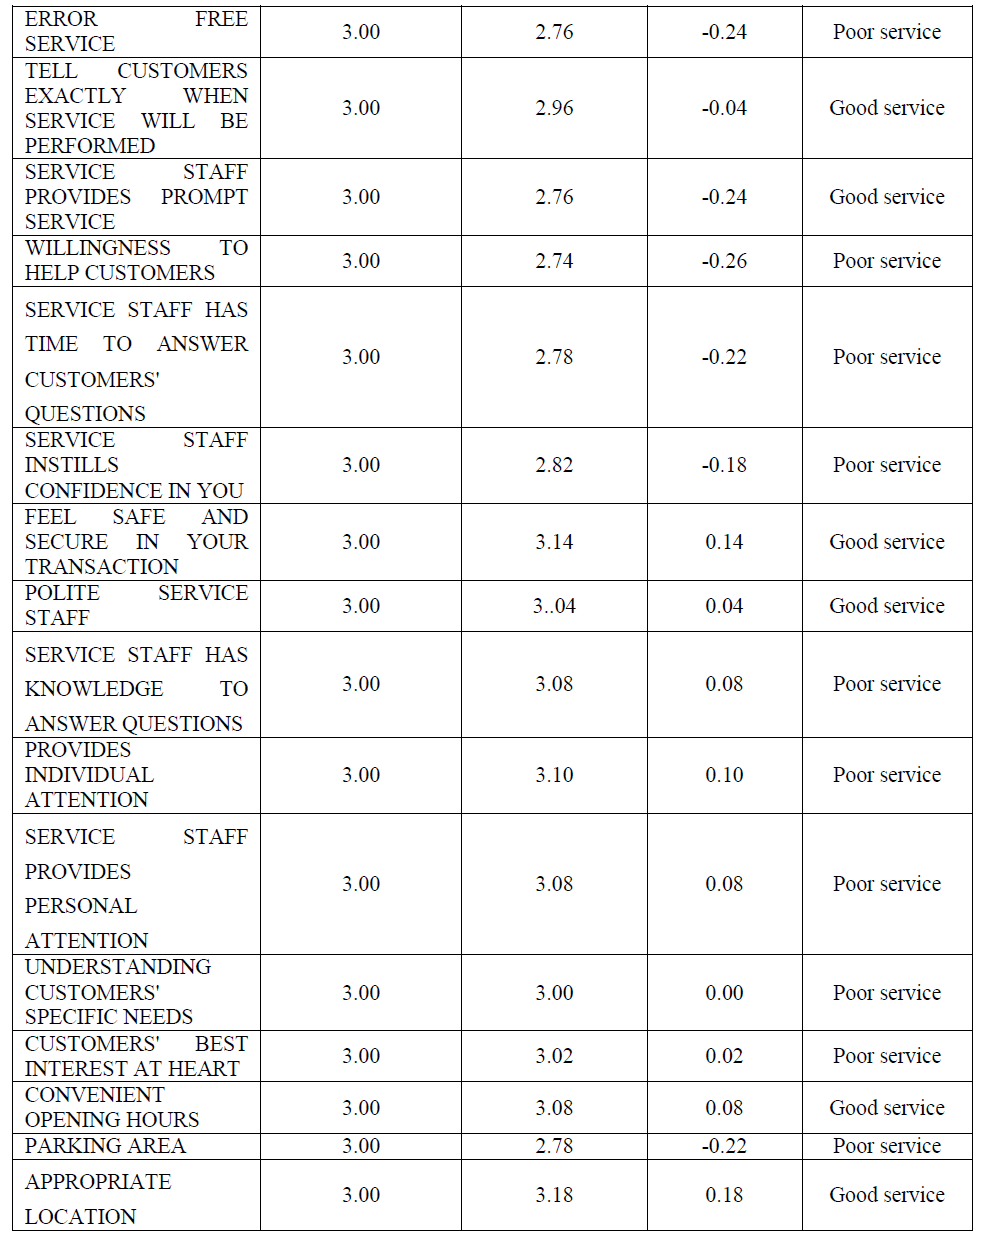
| The overall mean of perceived service quality in Hero industry is 2.869. From Tab.1, it can be seen that under Tangibility dimension, visually appealing material service attribute showed the most negative gap score and visually appealing physical facilities service attribute showed zero gap score. In Reliability dimension, service without delays attribute showed the most negative gap score and also all the other attributes under this dimension showed negative gap scores and hence poor quality. In Responsiveness dimension, service staff has time to answer customers’ question service attribute showed the most negative gap score and tell customers exactly when service will be performed service attribute showed the most positive gap score. In Assurance dimension, service staff instils confidence in you service attribute showed the most negative gap score and feel safe and secure in your transaction service attribute showed the most positive gap score. In Empathy dimension, two service attributes that are service staff provides personal attention and customers’ best interest at heart showed the most negative gap scores and convenient opening hours showed the most positive gap score. In Accessibility dimension, parking area showed negative gap score and appropriate location showed zero gap score. |
 |
 |
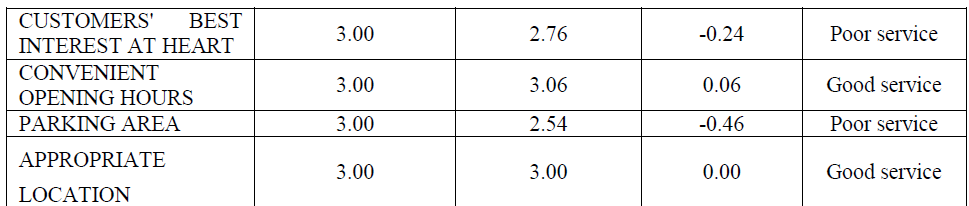
| The overall mean of perceived service quality in Bajaj industry is 2.972. From Tab. 2, it can be seen that under Tangibility dimension, visually appealing material service attribute showed the only negative gap score and well dressed and neat appearing reception desk staff service attribute showed the most positive gap score. In Reliability dimension, error free service attribute showed the most negative gap score and performing service right the first time showed the most positive gap score. In Responsiveness dimension, willingness to help customers service attribute showed the most negative gap score and all the service attributes showed negative gap scores. In Assurance dimension, service staff instils confidence in you service attribute showed the most negative gap score and feel safe and secure in your transaction service attribute showed the most positive gap score. In Empathy dimension, service staff provides personal attention service attribute showed the most positive gap score and all other service attributes showed positive gap scores and hence good quality. In Accessibility dimension, parking area showed negative gap score and appropriate location showed positive gap score. |
 |
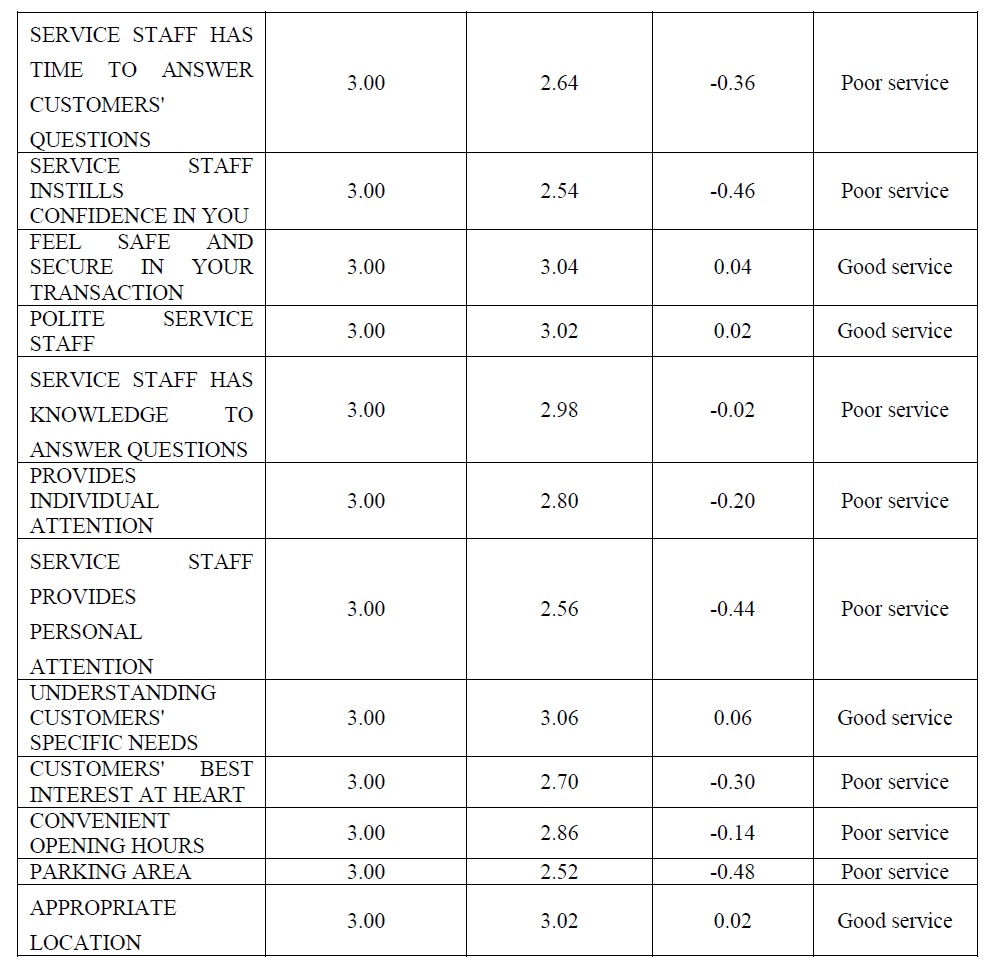 |
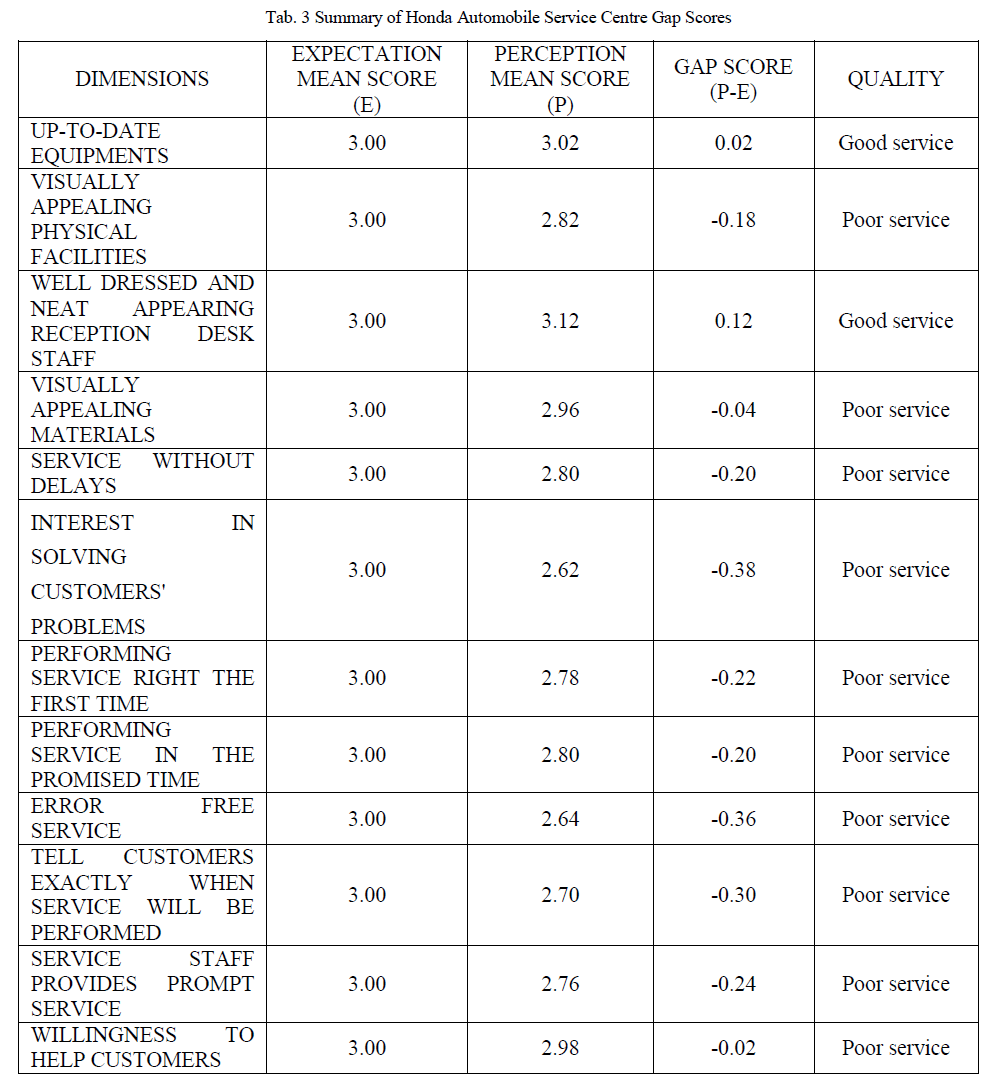
| The overall mean of perceived service quality in Honda industry is 2.822. From Tab. 3, it can be seen that under Tangibility dimension, visually appealing physical facilities service attribute showed the most negative gap score and well dressed and neat appearing reception desk staff service attribute showed the most positive gap score. In Reliability dimension, interest in solving customers’ problem service attribute showed the most negative gap score and also all the other attributes under this dimension showed negative gap scores and hence poor quality. In Responsiveness dimension, service staff has time to answer customers’ question service attribute showed the most negative gap score and also all the other attributes under this dimension showed negative gap scores and hence poor quality. In Assurance dimension, service staff instils confidence in you service attribute showed the most negative gap score and feel safe and secure in your transaction service attribute showed the most positive gap score. In Empathy dimension, service staff provides personal attention showed the most negative gap score and understanding customers’ specific need service attribute showed only positive gap score. In Accessibility dimension, parking area showed negative gap score and appropriate location showed positive gap score. |
3. Testing of the Hypothesis using Paired T Test |
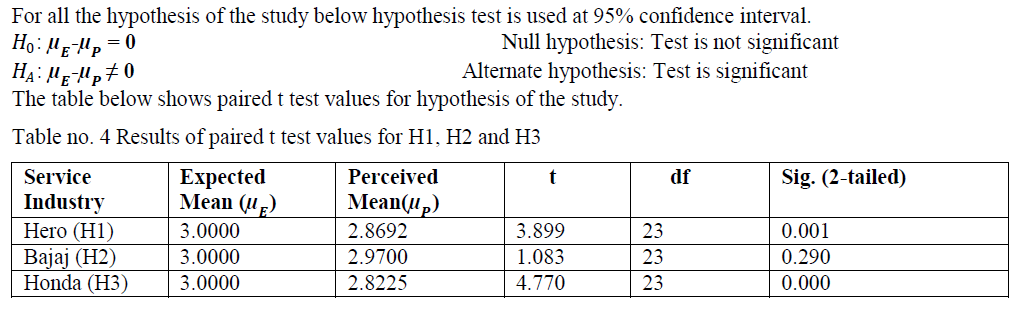 |
| H1: There is significant difference of mean ratings between expected and perceived service quality parameters for Hero two wheeler automobile users. |
| As it can be seen from table no. 4, significance (sig.) in first hypothesis is less than 0.05 therefore, this hypothesis is approved. |
| H2: There is significant difference of mean ratings between expected and perceived service quality parameters for Bajaj two wheeler automobile users. |
| As it can be seen from table no. 4, significance (sig.) in second hypothesis is more than 0.05 therefore, this hypothesis is rejected. |
| H3: There is significant difference of mean ratings between expected and perceived service quality parameters for Honda two wheeler automobile users. |
| As it can be seen from table no. 4, significance (sig.) in third hypothesis is less than 0.05 therefore, this hypothesis is approved. |
| According to statistical analysis in this section the results indicates that there is a significant gap in the overall service quality for Hero and Honda two wheeler automobile service industries whereas no such significant gap in the overall service quality for Bajaj two wheeler automobile service industry is found. |
CONCLUSIONS |
| Customer satisfaction is a result of after sales service provided by the automobile service industries. The aim of the study was to analyse the gap between expected service quality attributes and perceived service quality attributes. The overall service quality for Hero and Honda two wheeler automobile service industries was found below the expectation of the users and it was near to the expectation of users in case of Bajaj two wheeler automobile service industry. Moreover, among all three service industries Bajaj seems to have better overall service quality. As a whole the service attributes like visually appealing materials under Tangibility dimension, service without delays and error free service under Reliability dimension, service staff has time to answer customers’ questions and willingness to help customers under responsiveness dimension, service staff instils confidence in you under Assurance dimension, service staff provides personal attention under Empathy dimension and parking area under Accessibility dimension were found common service attributes that need to be improved in order to provide better service quality to their users. The service attributes like feel safe and secure in transaction under Assurance dimension and appropriate location under Accessibility dimension were found above expectation level of users in all three service industries. |
| The study can be further extended by taking combined data from different automobile users and then comparing them and also similar study can be done for four wheeler service industries. |
References |
|