ISSN ONLINE(2319-8753)PRINT(2347-6710)
ISSN ONLINE(2319-8753)PRINT(2347-6710)
Vatsal Patel1 and Srinivasarao Meka2
|
| Related article at Pubmed, Scholar Google |
Visit for more related articles at International Journal of Innovative Research in Science, Engineering and Technology
Rapid industrialization and population explosion has led to the migration of people from villages to towns, which generate thousands of tons of MSW daily. One of the main functions of urban local bodies in developing countries is Municipal Solid Waste Management (MSWM). Forecasting of solid waste generation is a vital component of MSWM. This paper deals with modelling of solid waste generation in medium scale towns located in a developing country. Primary data is analyzed to identify independent variables to be used to predict solid waste generation. Different empirical models are used for population projection. Projected population is used to predict solid waste to be handled during the study period. Artificial neural network models are proposed for estimation of solid waste generation in medium scale towns located in the study area. Efficacy of the proposed modelling scheme for forecasting solid waste generation was successfully demonstrated with the help of validation data.
Keywords |
| Solid waste generation, Solid waste forecasting, Solid waste modelling, ANN models, Dynamic models |
INTRODUCTION |
| Waste generation encompasses activities in which materials are identified as no longer being of value (in their present form) and are either thrown away or gathered together for disposal. Growth of population, increasing urbanization and change in lifestyle and food habits, has contributed to an increased quantity of waste and variation in waste composition [1]. Indian urban dwellers generate 0.2- 0.6 kg per person per day resulting into an average national total generation of nearly 105,000 metric tons of solid wastes per day as per one of the estimation carried out in year 2009[2]. An assessment states that the per capita waste generation is increasing by about 1.3% per year. With an urban growth rate of 3-3.5% per annum, the annual increase in waste quantities has been estimated at 5 % per annum [3]. In absence of weighbridge facility at disposal sites in number of towns the records are not maintained for quantity of waste disposed per day. |
| Successful planning of a solid waste management system depends critically on the prediction accuracy of solid waste generation [4]. Prediction of MSW generation provides the basic data on which the management system is planned, designed and operated. Requirement of Transportation trucks, Segregation plant capacity, land requirement for composting, capacity of landfill site are directly depend on quantity of MSW. The population growth and migration, underlying economic development, household size, employment changes, as well as the impact of waste recycling are factors that influence solid waste generation interactively [5]. Generation of MSW is expected to increase significantly in the near future as the country strives to attain an industrialized nation status by the year 2020 [6]. There are various sources of MSW generation and it includes - Domestic/Residential Waste, Commercial Waste, Institutional Waste generating from schools, universities, hospitals etc., waste from street sweeping, Dead Animals, Construction and Demolition Wastes and Sewage Wastes that includes solid components of open drains and by-products of sewerage/drains cleaning. |
| It is reported that solid waste generation is a strong function of population of the town. Hence, it is necessary to predict the population of the town under consideration to predict the solid waste generation. The percentage growth of population is commonly expressed as natural growth and overall growth. Natural growth represents the births and deaths and does not take into account migration. The overall growth rate takes migration into account commonly varies about 0.1% and 3%. The world's current (overall as well as natural) growth rate is about 1.14%, representing a doubling time of 61 years. On an average, women in a country give birth approximately to 2.1 children to yield zero population growth. With 1.21 billion people, India is currently the world's the second most populated country. In 2000, India established a new National Population Policy. One of the primary goals of the policy was to reduce the total fertility rate to 2.1 by 2010. Present fertility rate in India remains at the high number of 2.8. Thus, India’s population will continue to grow at a rapid rate. India's high population growth results in increasing generation of solid waste. |
| Based on the 2011 censes the major cities of Gujarat Surat (58.68%), Rajkot (28.21%), Ahmedabad (23.12). Gujarat has also become more urban with the population in cities growing from 37.4 per cent in 2001 to 42.6 per cent in 2011. The growth in rural population has dropped from 62.6 per cent to 57.4 per cent. However, population growth rate in small scale tows has increased by approximately 27% during this period. |
| To predict population growth four empirical models a) arithmetic projection b) geometric projection c) incremental increase method and d) decreasing rate of growth are used. The suitability of the projection method to predict the population growth can be identified from the existing data of the population growth during the previous years. The uncollected solid waste remains present in and around the locality or find its way into the open drains. Proper solid waste disposal is also hampered by the non – availability of suitable land fill site, partly due to the high land costs and partly due to rapid growth [7]. Sastry, (2007)[8] reported that the rate of waste generation is an index of socioeconomic development of the region. The consumption of raw materials and finished product by the community is directly proportional to the Gross National Product (GNP) of the country. Since the solid waste quantities are directly proportional to the quantity of material consumed the increase in per capita solid waste quantities would be directly proportional to the per capita increase in GNP. The study conducted by the United Nations in 1995 for various countries, shows the relation between GNP and expected generation of municipal solid waste. However, it does not show any direct relation for cities/towns. |
| Quantity of solid waste generation is dependent on demographic profile, geographic location and condition, socioeconomic profile of area and many other parameters. Beigl et al., 2008[9] reviewed various modeling techniques like Group comparison, Correlation analysis, multiple regression analysis, Single regression analysis, Input–output analysis, Time-series analysis and System dynamics used to predict solid waste generation. To the best of our knowledge mathematical models developed based on the extensive data collected from medium scale towns located in developing county is not reported in the open literature. For improved MSWM it is desirable to predict waste generation from medium scale towns of developing country. |
IDENTIFICATION OF STUDY AREA |
| MSWM continues to be a major challenge for local governments in urban areas across the world. Low waste collection efficiency and financial constraints along with poor planning and lack of study on changing complexities of municipal waste lead to worsening of MSW related problem. These difficulties results in masking the goal of sustainable management of municipal solid waste. An integrated planning and capacity building backed by financial support is required to control the situation. Life cycle assessment, categorization, recycling and reduction in all types of wastes and proper land filling are required. |
| Due to non-availability of adequate data on waste generation and waste characteristics for low-income cities of the developing countries, integrated solid waste management is very challenging. In low-income group of cities, the existing practices of MSWM and their planning are based on projection of population and per capita waste generation based on sample survey. Comprehensive survey in winter, summer and rainy seasons for each generation source is unavailable. Very few small cities and towns have solid waste, and hazardous waste disposal facilities. In addition to direct adverse impacts on public health, the growing and uncontrolled disposal of solid waste contributes to increasing contamination of groundwater supplies through inadequate leachate collection systems. There is an urgent need to prepare well defined SWM system for small cities and towns. |
| In continuation to above, it is intended to carry out research work for preparation of effective strategic plan for medium scale towns of Gujarat. Gujarat - “The Urbanized State of India“ situated on the western coast of India. The State of Gujarat is an industrial powerhouse with an enviable track record of development during the last four decades. Gujarat has just 5 per cent of the India's total population and 6 per cent of geographical area. The state is experiencing high urbanization with 37.67 per cent of the population living in 242 urban areas as per population census 2001. The State government has constituted 12 urban development authorities, 2 Area development authorities and designated 116 Municipalities as area development authorities for planned urban development in the state. |
| Gujarat has witnessed a robust urban growth, in the view of rapid industrialization in the state. Rapid urbanization is resulting into generation of large quantities of MSW in cities as well as towns. Hence, the scientific management of the same should be given priority. The Honorable Supreme Court of India, the MOEF, GOI framed MSW (management and handling) Rules 2000 under the provisions of the Environmental Protection Act 1986. Treatment and disposal of MSW in a scientific manner is now mandatory for all Municipalities. However, due to lack of finance and technical assistance, most of the municipalities in the state are failed to implement MSW Rules. The focus of the present research work is a part of the effort towards an effective and integrated solid waste management system, which shall be implementable in all medium scale towns of Gujarat State. |
| A. Background Information about Study Area |
| Gujarat is a state in western India. It has an area of 75,686 sq mi (196,077 km²) with a coastline of approximately 1,600 km. The state is bordered by Rajasthan to the north, Maharashtra to the south, Madhya Pradesh to the east and the Arabian Sea as well as the Pakistani province of Sindh on the west. The state is situated between latitude 20.07 to 24.36 and Longitude 68 to 74.25. |
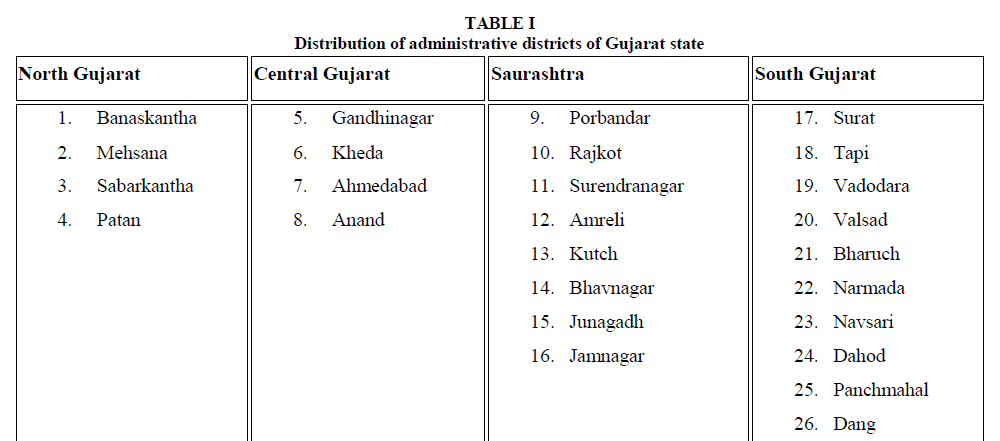
| Its capital is Gandhinagar, while its largest city is Ahmedabad. The state encompasses major sites of the ancient Indus Valley Civilization, such as Lothal and Dholavira. The population of the Gujarat State was 60,383,628 as per the 2011 census data. The density of population is 308 persons/sq.km. (797.6persons/sq.mi) which is lower compared to the national average. On 1st May 1960, Gujarat was created out of the 17 northern districts of former State of Bombay. These districts were further subdivided later on. There are 26 administrative districts in the state in four regions of the Gujarat State as shown in Table (1). |
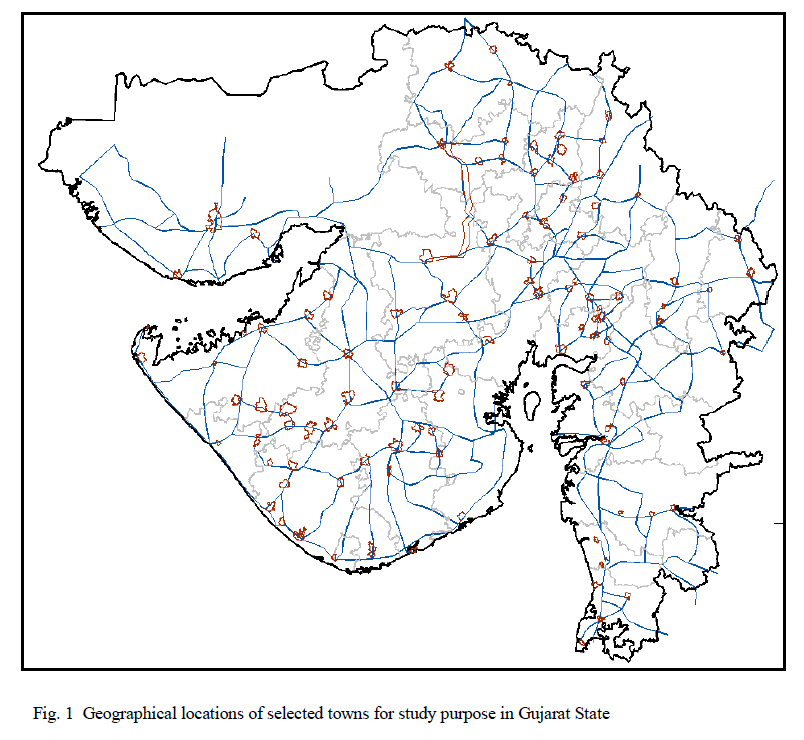
| The classification of towns is done on the basis of population. Towns with population ranging from 50,000 to 1 Lac is considered as Class-B, similarly population ranging from 25000 to 50000 are considered as class-C and towns with population from 15000 to 25000 are classified as class-D towns. For study purpose, Class-B, Class-C and Class-D towns are selected. For the study purpose, 32 B-class towns, 44 C-class Towns and 63 D-Class towns are selected based on criteria set for this research work. This research work focuses on 98 towns and the other towns are not considered due to lack of sufficient data. Geographical locations of the towns considered for study purpose is presented in Fig. 1. |
 |
 |
PREDICTION OF MUNICIPAL SOLID WASTE |
| Land filling is one of the important stages of MSWM System. Development of landfill site requires land acquisition. Required land for study period of next 25 years should be predicted in advance as land is a limited resource. MSW generation is key factor for estimation of size of landfill. MSW generation is a strong function of population. Hence, population projection is vital for prediction of MSW generation. Methods adopted for prediction of MSW generation for 25 years are explained in the next section. |
| A. Population Prediction for Study Period |
| The percentage growth of population is commonly expressed as natural growth and overall growth. Natural growth represents the births and deaths and does not take into account migration. The overall growth rate takes migration into account commonly varies about 0.1% and 3%. Today India has the second largest urban population in the world and more than two thirds of it lives in the 393 cities that have a population of more than a lakh. During the last 50 years, the rate of growth of urban population of India has been double that of the rate of growth of population. It took nearly 40 years between 1971 and 2008 for India's urban population to rise by 230 million and it could take only half that time to add the next 250 million. According to Mckinsey Report Indian cities are likely to house 40% of the urban population by 2030. India has seen a phenomenal increase in the number of its metropolitan towns. More than half of the total urban population of India lives in small and medium towns. |
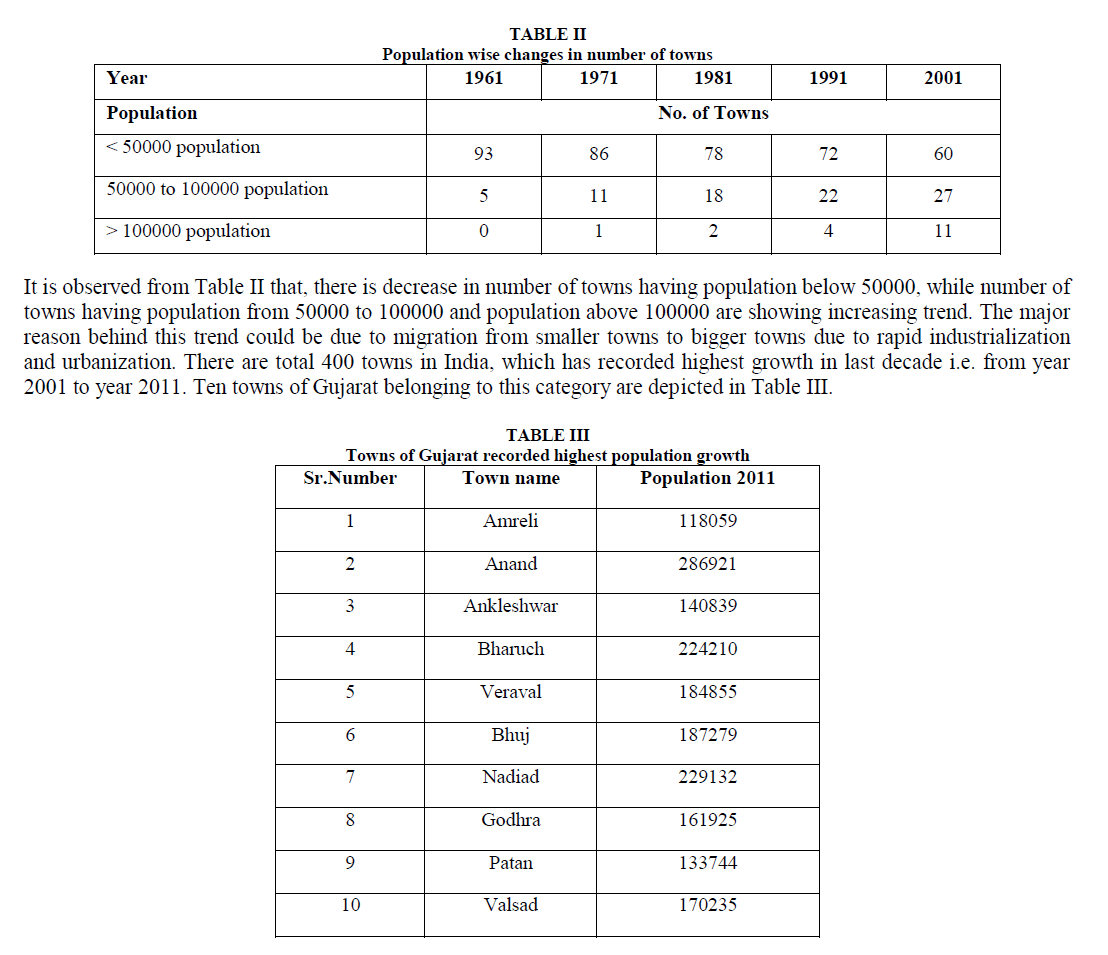
| Based on the 2011 censes the major cities of Gujarat Surat (58.68%), Rajkot (28.21%), Ahmedabad (23.12). Gujarat has also become more urban with the population in cities growing from 37.4 per cent in 2001 to 42.6 per cent in 2011. The growth in rural population has dropped from 62.6 per cent to 57.4 per cent. However, population growth rate in small scale towns has increased by approximately 27% during this period. Table II shows population changes between 1961 and 2001. |
 |
| It is reported that solid waste generation is a strong function of population of the town. Hence, it is necessary to predict the population of the town under consideration to predict the solid waste generation. To predict population growth four empirical models a) arithmetic projection b) geometric projection c) incremental increase method and d) decreasing rate of growth are considered in the present work. |
| 1) Arithmetic projection: In this method it is assumed that population is increasing in arithmetical progression and assumption is made that this pattern will persist into future. Using the past trend of population of an area future population is projected. Mathematically. Pn= Po ( 1 + r*t ). |
| 2) Geometric projection: In this method assumption is made that population tends to grow at a geometric rate and it compounds like interest or money. The geometric curve portrays this idea, growth at a constant rate or percentage, which means that with each unit of time, the absolute addition to population gets bigger and bigger and bigger. The projection is done by using the following formula. Pn = Po (1 + r ^ t). |
| 3) Incremental increase method: In this method incremental increase in population over unit time (one year or one decade) is considered for projection of future population. Assumption is made that Past trend of increase in population will continue in future. It can be calculated from the following formula, Pn = Po + nX +1/2 [ n (n+1 )] Y. |
| 4) Decreasing rate of growth: Decrease in growth rate is considered for projection of future population in this method. It is assumed that decrease in growth rate will continue in future as observed in past. For calculation purpose decrease in growth rate for each decade should be calculated. It can be expressed mathematically, Pn = Po[ 1+ (r + r1 ) t] |
| Where: |
| Pn = Population in the nth decade from the base year. |
| Po = Population in base year. |
| r = Rate of Increase in Population. |
| r1 = Average decrease in the percentage increase. |
| t = number of decades from the base year. |
| x = average increase in population. |
| y = incremental increase in population. |
| The suitability of the projection method to predict the population growth can be identified from the existing data of the population growth during the previous years. Population data for year 1961, 1971, 1981 and 1991 from Census of India publications are used for selection of population prediction model. Based on these base year data, population for Year 2001 are estimated using three methods i.e. arithmetic projection, geometric projection and incremental increase method. These estimated data for all study towns are compared with actual census data of year 2001. Based on comparison, appropriate method of population projection is selected for each study town. Population is predicted for each study town from year 2002 to year 2025. It is to be noted that all these population prediction models are empirical models. |
| B. Forecasting of Solid Waste Generation for Study Period using Conventional method |
| Generation of solid waste is directly dependent on population. With increase in population, solid waste generation also increases. To estimate solid waste generation, data of total waste generated in each study town is collected for year 2004. Based on this data, per capita solid waste generation is calculated. Per capita generation of solid waste varies from 0.10 kg/day to 0.61kg/day. It is observed that with increase in population size, per capita waste generation also increases. |
| To estimate solid waste generation for study period, projected population for 25 years is considered. Average increase in solid waste generation varies between 1% to 5% and an increase of 3% is observed every year in medium scale towns in India (GOI, 2011). Therefore, solid waste generation is estimated considering population growth and average increase of 3% in solid waste generation. |
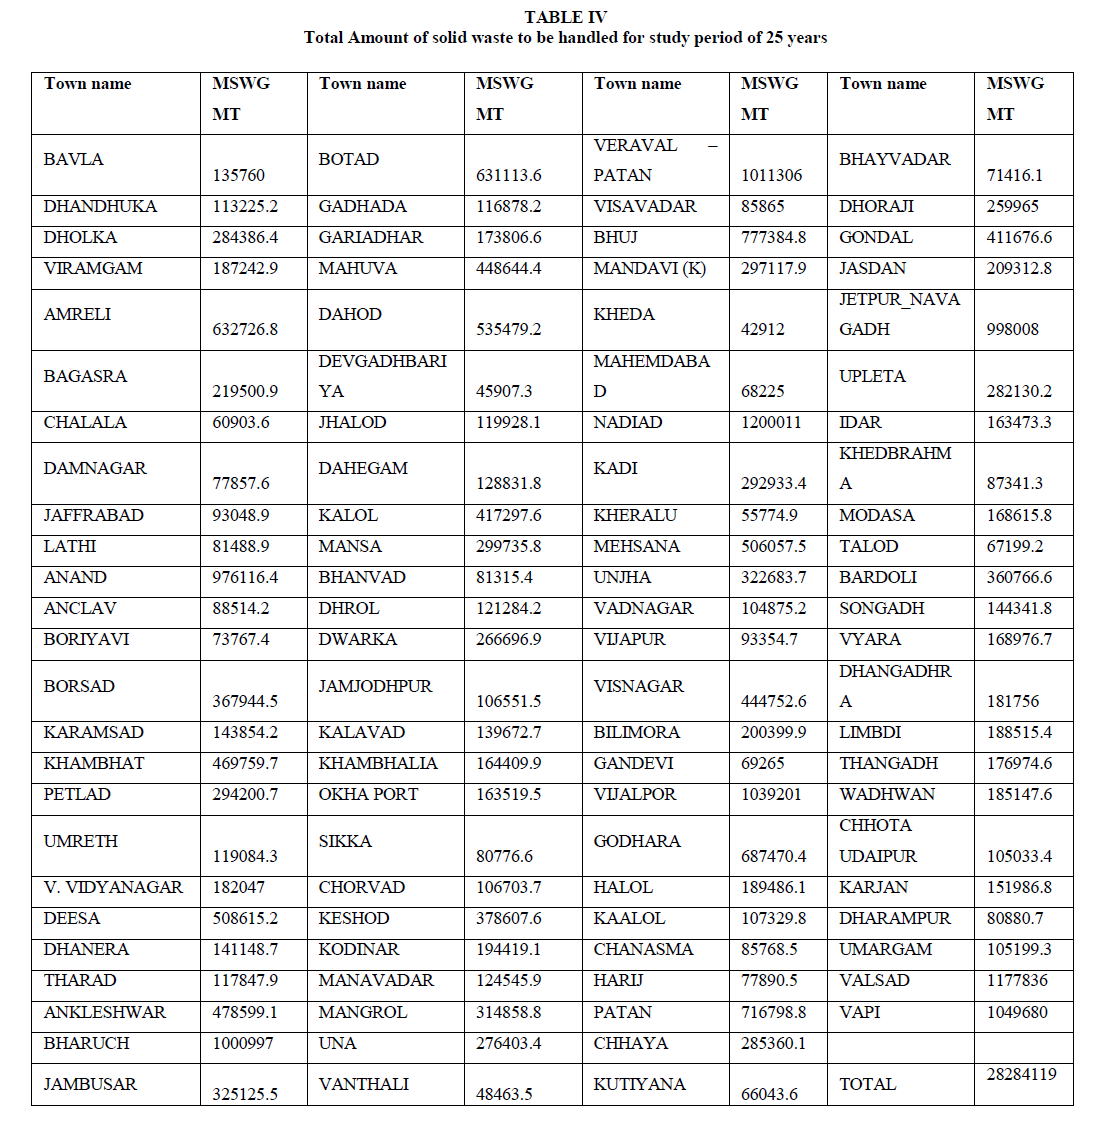
| Based on solid waste generation estimation, quantity of per capita waste generation varies from 0.18 kg/day to 1.13 kg/day for year 2025. The projected solid waste generation from the towns under consideration for a period of 25 years is presented in Table IV. |
DATA ANALYSIS AND SELECTION OF INDEPENDENT VARIABLES PREDICTION OF MUNICIPAL SOLID WASTE |
| The data collected has been analyzed for independent and dependent variables. The output of the model is taken as waste generation. The independent variables are identified based on the literature and the availability of the data for the study area. Independent variables considered in the present work are a) Population of the town during current year b) Waste generation during current year c) SC+ST population d) Total received as tax e) Longitude f) Latitude. Population and waste generation are considered as dynamic variables and remaining variables assumed to be static variables for given town during study period. |
ARTIFICIAL INTELLIGENCE BASED MODELLING |
| In absence of necessary domain knowledge it is difficult to generate mechanistic models. The possible alternative for these models are black box models. Black box models are developed using input and output data. The dependence of output variable on independent variables is very complicated. These complicated inter relationships can be explained by using AI based models. AI based model are expected to help in investigation of key system variables in greater detail. An AI based modeling technique namely Artificial Neural Networks (ANN) is being used extensively in the recent past. In the present study ANN modeling technique is used for estimation of solid waste generation. |
 |
| A. Proposed ANN based Model for Prediction of MSW Generation |
| Architecture of the proposed ANN based model is presented in Fig(2). It can be seen from the Figure that the model has two components one is a dynamic component to forecast population and ANN component to predict the quantity of MSW. Population predictions are done using the relevant model suitable to specific town from the models explained earlier. ANN model has total six inputs and one output. The model output gives the solid waste generation for the coming year while performing one-step a-head perditions. Inputs to the ANN include the percentage of SC+ST population to incorporate major demographic factor as an indicator social status of the town. Economic component is included by considering total tax collected from the town. Longitude and latitude of the town are used to incorporated regional and geographical variations of the town. It is to be noted that the model is used to dynamically predict the solid waste generation. Model outputs generated for the previous years are used as one of the inputs to ANN. |
| The functions used in the neurons depend on the complexity of the system. For example pure linear transfer function can be used to explain a linear input output relationship. For complicated nonlinear relationships sigmoid functions are used. In the present work pure linear transfer functions are used in the output and tan-sigmoid transfer functions are used in the input and hidden layers. Algorthems used for these transfer functions are given in equations 1 and 2. Where ‘a’ and ‘n’ are neuron output and input respectively. |
| Algorithm for pure linear transfer function is |
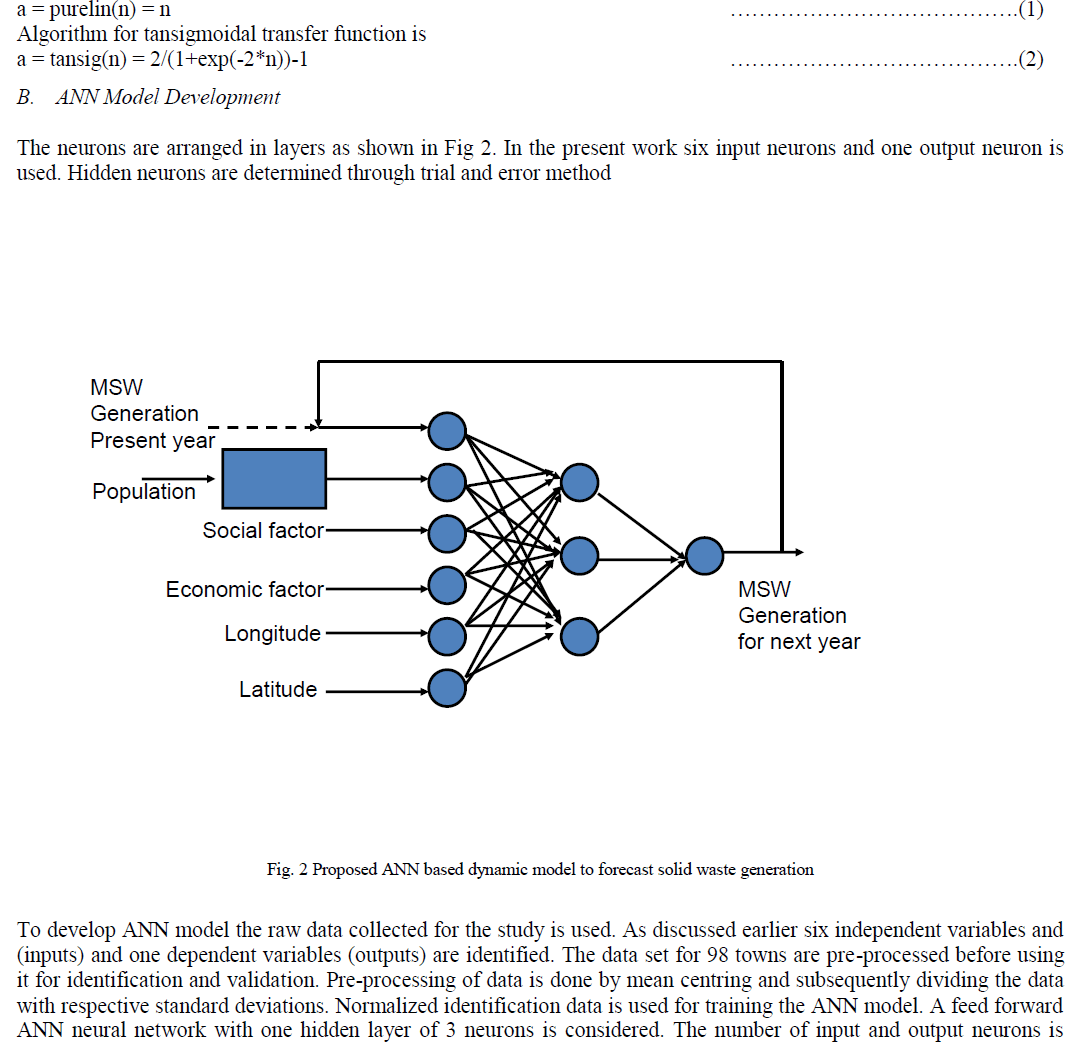 |
| taken same as actual number of inputs and outputs to the network. Tan sigmoid functions are used for all neurons except for output layers neurons. In the output layer pure linear transfer function is used. Input to each Neuron is weighed with corresponding weights and each Neuron has its own bias. Weights and biases are identified by Lavenburg-Marquate algorithm using MATLAB software. |
| C. Validation of proposed ANN Model |
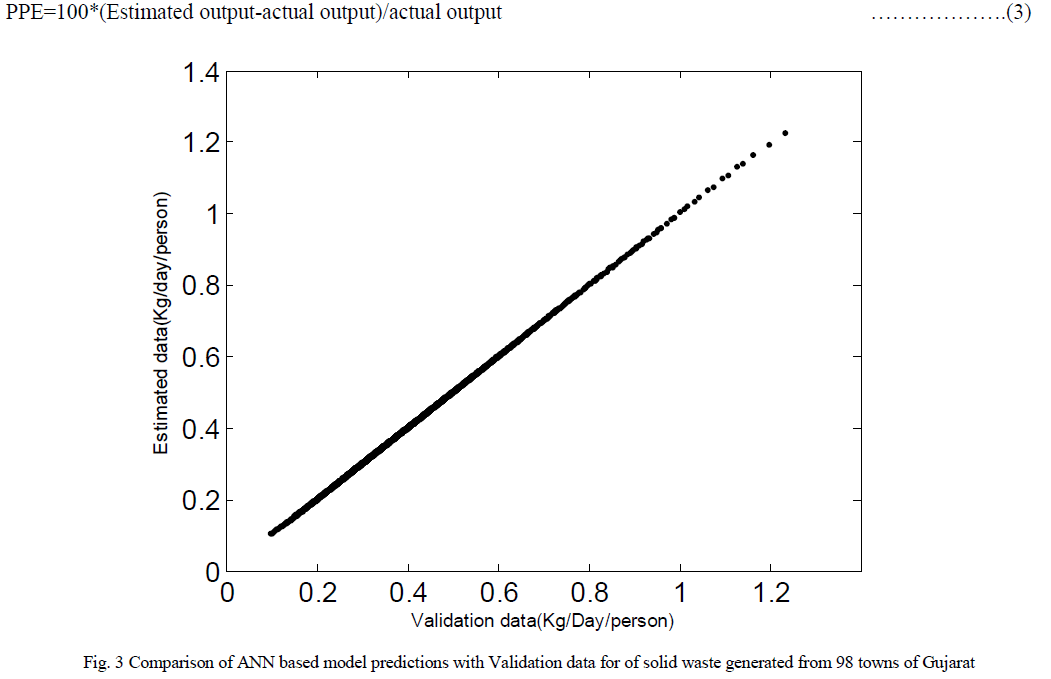
| Validation of the identified ANN model is done using validation data set. The validation data set is selected from the data available for the study area. While selecting validation data set, care is taken to represent the data across the longitude and latitude of the study area. Output of the model for the validation data set is simulated using the corresponding normalized input sets. The estimated output is de-normalized to determine the actual output. The estimated quantity of solid waste and the validation data are presented in Figure (). From the figure it can be obseved that data following 45O very closely indicating excellent prediction capability of the proposed model. The performance metric for the predictions are determined by taking the percentage prediction errors (PPE). PPE is estimated by using the equation (3).Percentage prediction errors for selected data for validation data are found to be less than 2 percent for all the towns under consideration which is within acceptable limit. |
 |
CONCLUSION |
| Study area is identified as 98 medium scale towns of Gujarat state of India. Independent variable and dependent variables are identified as population, socio economic data, Geographical location in terms of Latitude and longitude to forecast MSW generation per day. Necessary data for model development is collected from the primary and secondary sources. Empirical models are used to forecast population for 25 years. A dynamic model using ANN is proposed to forecast solid waste generation for 25 years. Performance of proposed ANN model is found to be satisfactory. |
References |
|