Research & Reviews in Pharmacy and Pharmaceutical Sciences
e-ISSN:2320-1215 p-ISSN: 2322-0112
e-ISSN:2320-1215 p-ISSN: 2322-0112
1College of Pharmacy, Shree Venkateswara College of Paramedical Sciences, Erode-Gobi Main Road, Erode, Tamil Nadu, India
2Mother Theresa Post Graduate and Research Institute of Health Sciences, Puducherry, India
Received date: 12/02/2021; Accepted date: 02/03/2021; Published date: 10/03/2021
Visit for more related articles at Research & Reviews in Pharmacy and Pharmaceutical Sciences
Objective: The aim of the study is the formulation and evaluation of Quercetin nanoparticles using low molecular weight chitosan by applying QbD approach.
Materials and methods: The Quercetin nanoparticles are prepared by ionic gelation technique, low molecular weight chitosan was used as the polymer. In this study 23 Factorial design (FD) with two center points was used for optimization. The independent variables were speed, time and cross linking agent to polymer ratio. The dependent variables were particle size and entrapment efficiency. The resulting data was fitted into Design Expert Software (Trial Version) and analyzed statistically using analysis of variance (ANOVA). The data was also subjected to response surface methodology to determine the influence of speed, time and cross linking agent to polymer ratio on responses. The physicochemical properties of the prepared Quercetin nanoparticles were characterized by Particle Size, Particle Size Distribution, Zeta Potential, Surface Morphology Drug encapsulation efficiency FT-infrared spectrophotometer, In-vitro release Study and Kinetic Study.
Results: The average particle size of optimized Quercetin nanoparticles was found to be 97.5 nm with entrapment efficiency of 50% and zeta potential of +24.7 mv. The drug release profile showed that there was a burst release of 30.7% in first 5 hrs and 93% was released in 36 hrs. In release kinetic study the release profile had a best fit with Higuchi model with R2 value of 0.995.
Conclusion: The optimized Quercetin nanoparticles can be used as effective drug in the targeting of cancer due to its size and drug release characteristics.
Nanoparticles; Low weight Chitosan; QbD Approach and Quercetin
Quercetin (3,3′,4′,5,7-pentahydroxyflavone) is the major representative of the flavonol subclass among flavanoids. It has been reported to have a variety of biological activities and pharmacological actions. They are most abundant flavonoid, found in variety of foods including apples, berries, Brassica vegetables, capers, grapes, onions, shallots, tea and tomatoes, as well as many seeds, nuts, flowers, barks and leaves. Quercetin itself has been shown to exhibit a chemo preventive role in several cancers including liver, lung, prostate cancers, breast and renal cancer [1-4].
Mechanisms of Action
Antioxidant: Quercetin’s phenol groups have hydrogen-donating capacity and exhibits antioxidant effects by scavenging electrophilic, oxygen free radicals as well as blocking the formation of copper and iron induced free radicals and inhibits lipid peroxidation In- Vitro.
Anti-inflammatory: Inhibits production of leukotrienes and prostaglandins, Inhibits lymphocytes and suppresses macrophage phagocytosis.
Antiplatelet: A complicated process involving inhibition of the eicosanoid Pathway and reducing cyclicAMP.
Antineoplastic: Inhibits cell cycle at G1 and S phase in vitro, inhibits phosphorylation of protein kinase C (PKC) and tyrosine kinase, which ultimately blocks cellular signal transduction leading to decreased tumor growth. Inhibits the RAS cascade, which is important for cellular proliferation and induces apoptosis. Binds to type II estrogen receptors to stimulate growth inhibition.
Antiviral: Binds to viral coat and may inhibit nucleic acid synthesis, competitive inhibitor of reverse transcriptase.
Antihistamine: Inhibits the release of histamine and basophils from mast cells in lung and intestinal tissues [5,6].
Anticancer effect of quercetin: A study conducted by Chengxian Han et al confirmed the QUERCETIN’S anticancer effect in Renal cancer cell through inhibiting proliferation and inducing cancer cell apoptosis According to the study quercetin inhibited survivin mRNA expression and enhanced caspase 3 activity. Hence induced apoptosis in renal cancer cells (Figure 1) [7].

Figure 1: An overview of anticancer activity of quercitin.
Although quercetin has been studied as a potential candidate for cancer treatment it has certain limitations, like low aqueous solubility (<0.1 g/ml), poor absorption (<10%), high metabolic rate (<1 h) and low bioavailability. Hence, to overcome the restrictions, nanotechnology is being employed. The quercetin loaded polymeric nanoparticles will enhances its bioavailability, targeting and effective treatment in cancer.
The main purpose of the present research was to prepare the quercetin loaded polymeric nanoparticles using low molecular weight chitosan which was prepared from normal chitosan by enzymolysis, by applying quality by design approach and was evaluated. Low molecular weight chitosan had increased targeting efficiency and the nanoparticles of around 100 nm are considered to be effective in targeting of the cancer cells.
The materials used in the formulation of Quercetin nanoparticles are Quercetin (Sigma-Aldrich) chitosan (HIMEDIA) acetic acid (RANKEM), cellulase & pectinase (Gift sample from sun glow pharmaceuticals), sodium tripolyphosphate (Sigma-Aldrich), DMSO (Sigma-Aldrich), Sodium chloride (Chemspure), Disodium hydrogen phosphate (SPECTRUM), Potassium dihydrogen phosphate(SPECTRUM), Ethanol (Analytical CS reagent). The software used were design expert 7.1.5 and Graph pad prism7.
Preparation of low molecular weight chitosan by enzymolysis
Chitosan (1.0% W/V) solution was prepared using 1%v/v acetic acid, which is having a pH of around 3.0. To the above solution, enzymes were added and incubated at 37°C for 3-5 hrs with constant stirring. After the hydrolysis, the enzyme was inactivated at 1000°C for 10 min and the pH was adjusted to 12 with 2 M NaOH to precipitate the products with a high degree of polymerization (DP). The suspension was centrifuged; the insoluble residue was washed with double distilled water and lyophilized to give LMWC (Table 1) [8].
| Sample | Cellulase | Pectinase | Time of degradation (In Hrs) |
|---|---|---|---|
| Chitosan (1%w/v) | 0.3 g | - | 3 |
| Chitosan (1%w/v) | - | 0.3 g | 3 |
| Chitosan (1%w/v) | 0.3 g | 0.3 g | 3 |
| Chitosan (1%w/v) | 0.3 g | - | 4 |
| Chitosan (1%w/v) | - | 0.3 g | 4 |
| Chitosan (1%w/v) | 0.3 g | 0.3 g | 4 |
| Chitosan (1%w/v) | 0.3 g | - | 5 |
| Chitosan (1%w/v) | - | 0.3 g | 5 |
| Chitosan (1%w/v) | 0.3 g | 0.3 g | 5 |
Table 1. Preparation of low molecular weight chitosan by enzymolysis.
Evaluation of prepared low molecular weight chitosan
Determination of average viscosity molecular weight by Ostwald’s viscometer: The viscosity average molecular weight was determined by using Ostwald viscometer. Solvent used in this work was a mixture of 10 ml of 0.5 M acetic acid and 20 ml of 0.25 M sodium chloride. The experiment was carried out in triplicate to get concordant value. The average viscosity molecular weight was then calculated from the following formulas [8].
Relative viscosity
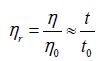
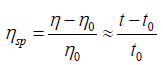
Relative viscosity increment (or specific viscosity) is the ratio of difference in viscosities (or efflux times) to solvent viscosity (or solvent efflux time)
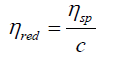
Reduced viscosity (or viscosity number)
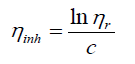
Inherent viscosity
Intrinsic viscosity [η] can be defined
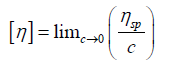
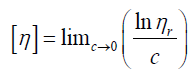
By plotting viscosities as a function of concentration the intrinsic viscosity can be estimated by extrapolation of polymer solution to zero concentration.
Mark-Houwink equation
The equation describing the dependence of the intrinsic viscosity of a polymer on its relative molecular mass (molecular weight) is:
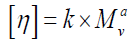
Where [η] is the intrinsic viscosity, K and α are constants the values of which depend on the nature of the polymer and solvent as well as on temperature, and M is usually one of the relative molecular mass averages.
Fourier transforms infrared spectrometer (FT-IR) analysis
FTIR spectroscopy analysis of low molecular weight chitosan was done using the KBr disc technique in the range of 4000- 400 cm-1. All the spectra was recorded at room temperature with a resolution of 4 cm-1 for 45 scans. FTIR study was done to confirm that there is no structure variation in the resulting low molecular weight chitosan when compared to normal chitosan [9].
Preparation of Quercetin nanoparticles using low molecular weight chitosan
Quercetin nanoparticles were prepared by ionic gelation cross linking method. Quercetin was first made soluble in DMSO: Phosphate buffer saline (1:4 ratio) and between 80 was added adequately in order to bring out complete solubilisation i.e. clear liquid solution was obtained. Low molecular weight Chitosan in adequate amount was taken and made soluble in phosphate buffer saline pH 7.4 and acetic acid was added slowly in drops until it gets completely solubilised. Appropriate amount of quercetin and chitosan solution (1:2 ratio) was mixed and then required amount of 0.1% of sodium tripolyphosphate was added as a cross linking agent and the solution was stirred vigorously until the opalescence was observed. The final suspension was centrifuged at specified rpm and time. The supernatant obtained upon centrifugation was collected and measured. The ratio of Quercetin and low molecular weight chitosan was selected on the basis of the stability of quercetin with low molecular weight chitosan in phosphate buffer saline solution. It was found that 0.5 mg/ml of quercetin was stable (no precipitation) with low molecular weight solution (Figure 2) [10].

Figure 2: Preparation of Quercetin nanoparticles.
Optimization of Quercetin nanoparticles formulation using QbD- Design expert7 Software
In this study 23 Factorial design (FD) with two center points was used for optimization (Figure 3). In this study independent variables were speed, time and cross linking agent to polymer ratio. The dependent variables were particle size and entrapment efficiency. Among the independent variables, speed, time and cross linking agent to polymer ratio (C: P) were identified as the most critical parameters which will affect the particle size and entrapment efficiency. In the responses, particle size is the most important for the cancer cell targeting and entrapment efficiency is the next important for being an effective formulation. So these independent variables and responses were selected for optimizing the formulation. (Table 2) summarizes an account of all the experimental runs and the actual values and levels of independent variables. All other formulation and processing variables were kept invariant throughout the study. The resulting data was fitted into Design Expert Software (Trial Version) and analyzed statistically using analysis of variance (ANOVA). The data was also subjected to response surface methodology to determine the influence of speed, time and cross linking agent to polymer ratio on responses.

Figure 3: Optimization design summary.
| Formulation | Speed(rpm) | Time(in hrs) | TPP*:Polymer (ratio) |
|---|---|---|---|
| QC1 | 600 | 6 h | 1:3(TPP-6 ml) |
| QC2 | 600 | 4 h | 1:5(TPP-4 ml) |
| QC3 | 400 | 6 h | 1:5(TPP-4 ml) |
| QC4 | 400 | 4 h | 1:5(TPP-5 ml) |
| QC5 | 400 | 6 h | 1:3(TPP-6 ml) |
| QC6 | 600 | 4 h | 1:3(TPP-6 ml) |
| QC7 | 600 | 6 h | 1:5(TPP-5 ml) |
| QC8 | 400 | 4 h | 1:3(TPP-6 ml) |
| QC9 | 500 | 5 h | 1:4(TPP-5 ml) |
| QC10 | 500 | 5 h | 1:4(TPP-5 ml) |
Table 2. Optimization design summary for the preparation of Quercetin nanoparticles formulation (*TPP solution concentration is 1 mg/ml).
Evaluation of optimized Quercetin nanoparticles
Particle size, particle size distribution: The particle size and particle size distribution of the formulation was determined by photo correlation spectroscopy with a zeta master (Malvern Instruments, UK) equipped with the Malvern PCS software.
Zeta potential: Zeta potential was measured using photo correlation spectroscopy with a zeta master (Malvern Instruments, UK) equipped with the Malvern PCS software.
Drug encapsulation efficiency: The entrapment efficiency was calculated from the free quercetin that was present in the supernatant after centrifugation and the absorbance was measured using UV Spectrophotometer at 362 nm. The encapsulation efficiency was calculated using the formula [10].

Fourier transforms infrared spectrometer (FT-IR) analysis: FTIR spectroscopy analysis of optimized Quercetin nanoparticles formulation was done using the KBr disc technique in the range of 4000-400 cm-1. All the spectra was recorded at room temperature with a resolution of 4 cm-1 for 45 scans.
Surface morphology: Surface morphology study of nanoparticles was carried out by using Scanning Electron Microscopy and transmission electron microscopy.
In-vitro release study: The quercetin release profile was investigated by using dialysis bag from HIMEDIA (membrane-50). In this study 5mg equivalent nanoparticles were taken and dispersed in 2ml phosphate buffer and 2 ml was inoculated in the dialysis membrane. Dialysis membrane containing QUER-CHIT nanoparticles was placed in a 200 ml medium at 37 °C under magnetic stirring. The medium was consisting of phosphate-buffered pH 7.4 containing 10% ethanol (v/v) because the limit of solubility of QUER in water makes it impossible to study in buffer. At selected times interval aliquot of sample were withdrawn and was replaced with fresh medium maintained at same temperature. Withdrawn samples medium was measured for absorbance at 370 nm by UV-Vis spectrophotometer. The absorbance was recorded and it was related to the amount of quercetin released using the standard curve. Results were expressed as cumulative percent of released as a function of time compared with standard QUER.
Kinetic study: For estimation of the kinetic and mechanism of drug release, the result of in vitro drug release study of nanoparticles were fitted with various kinetic equation like zero order (cumulative % release vs. time), first order (log % drug remaining vs. time), Higuchi‟s model (cumulative % drug release vs. square root of time). R2 and k values were calculated for the linear curve obtained by regression analysis of the above plots.
Identification of the Drug
The IR spectrum of quercetin demonstrated specific peaks corresponding to –OH stretch at 3384.93cm-1, C-H stretch at 2360.77,C=O stretch at 1665.94 cm-1, aromatic C=C stretch at 1512.64 cm-1 and 1613.28 cm-1, and aromatic C-O stretch at 1211.08 cm-1 as shown in (Figure 4).

Figure 4: IR spectrum of quercetin.
Melting Point Determination
The melting point of quercetin was found to be 316.5
Preliminary Solubility Study of Drug
The solubility study of quercetin was carried out. It was found that in DMSO-phosphate buffer pH 7.4 solvent systems the solubility of quercetin was high 0.5 mg/ml. But the solution tends to precipitate after some time. With this above solvent system when tween 80 (3%v/v) was added, quercetin solution remained stable and no precipitation occurred. Hence this solvent system of DMSO- phosphate buffer pH 7.4 and tween 80 was taken for further studies i.e. in the preparation of quercetin nano formulations.

Figure 5. Preliminary solubility study of quercetin.
Drug Excipient Compatibility Study
The principal peaks of Quercetin were found identical to the standard depicting no harmful interaction as shown in the Figure 6.

Figure 6. Compatibility study- IR Spectra of Drug with polymer.
A (top): IR spectra of drug- Quercetin. B (middle): IR spectra of drug and LMWC.
C (bottom): LMWC.
Preparation of Standard Calibration Curve of Quercetin
| Concentration (mcg/ml) | Absorbance |
|---|---|
| 10 | 0.436 |
| 20 | 0.966 |
| 30 | 1.482 |
| 40 | 1.85 |
| 50 | 2.1 |
Table 3. Calibration curve of quercetin for entrapment efficiency (Solvent: DMSO- Phosphate buffer 7.4 and tween 80).

Figure 7. Calibration curve of quercetin –entrapment efficiency.
Concentration(mcg/ml) |
Absorbance |
|---|---|
| 10 | 0.29 |
| 20 | 0.834 |
| 30 | 1.359 |
| 40 | 1.879 |
| 50 | 2.218 |
Table 4. Calibration curve of quercetin for drug release (Solvent: 10% v/v in phosphate buffer pH 7.4).

Figure 8. Calibration curve of Quercetin- drug release.
Evaluation of prepared low molecular weight chitosan
Determination of Viscosity average Molecular weight of chitosan: The viscosity average molecular weight of chitosan and prepared low molecular weight chitosan products of various time intervals (Figure 9) was calculated and the results were described in the tables.

Figure 9. Evaluation of prepared LMWC by cellulase and pectinase-5 hrs.
From the (Table 5), it was clear that increase in the time of reaction with combined enzymes of cellulase and pectinase significantly decreases the molecular weight of chitosan. The molecular weight of raw chitosan was significantly decreased from 1123197 Da to 15 K Da in the 5 hrs of reaction time. This obtained low molecular weight chitosan product was selected for further evaluation studies.
| S.no |
Time of degradation (hrs) |
Initial molecular weight of chitosan (Da) |
Final Molecular weight of chitosan Using cellulase (Da) |
Final Molecular weight of chitosan Using pectinase (Da) |
Final Molecular weight of chitosan Using cellulase and pectinase (Da) |
|---|---|---|---|---|---|
| 1 | 3 | 1123197 | 61895 | 57773 | 50207.7 |
| 2 | 4 | 1123197 | 46987.3 | 37869 | 29175.1 |
| 3 | 5 | 1123197 | 20639.4 | 19401 | 14661.8 |
Table 5. Summary of viscosity average molecular weight of LMWC preparation.
Fourier transform infrared spectrometer (FT-IR) analysis: The FTIR spectra study of the prepared low molecular weight chitosan was carried out and compared with the initial chitosan. These results demonstrated that the structures of the main chain of the initial chitosan and LMWCs were the same. The NH2 amino groups had a characteristic peak near 3440 cm-1, which was overlapping by the peak due to the –OH group. The occurrence of absorption peaks at around 2900 cm-1 was assigned to the asymmetric stretching vibration of the –CH2 and the rapid reduction in the intensity for the LMWCs was probably attributed to degradation of chitosan after hydrolysis. A significant peak around 1660 cm-1, which suggests that the –C=O groups had more opportunity to form stronger hydrogen bonds, and the scission of polymer chains led to the decrease of the chitosan molecular weight. The results indicated that there was no significant difference between the main structures of the two samples before and after the enzymatic hydrolysis, but the molecular weight of the main hydrolysis products decreased (Figure 10).

Figure 10. IR Spectra of initial chitosan (top) and prepared Low molecular weight chitosan (below).
Evaluation of Prepared Quercetin Nanoparticles
Particle size: The particle sizes of the formulations were evaluated using Malvern particle size analyzer. The particle sizes of the formulations are illustrated in the following (Table 6, Figure 11).
| Formulation code |
Particle size (nm) | Poly dispersity index |
|---|---|---|
| QC1 | 88 | 0.471 |
| QC2 | 104 | 0.472 |
| QC3 | 104 | 0.460 |
| QC4 | 118 | 0.342 |
| QC5 | 159 | 0.399 |
| QC6 | 95 | 0.457 |
| QC7 | 90 | 0.472 |
| QC8 | 103 | 0.453 |
| QC9 | 88 | 0.483 |
| QC10 | 85 | 0.460 |
Table 6. Particle size of prepared Quercetin nano formulation.

Figure 11. Particle Size of prepared formulations.
Entrapment efficiency: The entrapment efficiency of quercetin nanoparticles formulations was measured and the results are described in the (Table 7).
Formulation |
Entrapment efficiency (%) |
|---|---|
| QC1 | 61 |
| QC2 | 38 |
| QC3 | 30 |
| QC4 | 54 |
| QC5 | 41 |
| QC6 | 66 |
| QC7 | 42 |
| QC8 | 41 |
| QC9 | 61 |
| QC10 | 50 |
Table 7. Entrapment efficiency of prepared QC nano formulations.
Optimization of Quercetin Nanoformulation`

Figure 12. Screenshot of 23 factorial design matrix with response.
Response 1: particle size

Figure 13. Half Normal plot showing significant factors on size.
The half normal plot shows the point which constitutes positive or negative effect on the particle size. Here the significant factors affecting the particle size are A (speed) and BC (time and C: P ratio).
The Model F-value of 11.33 implies the model is significant. There is only a 3.66% chance that a "Model F-Value" is large. This large value could occur due to noise.Values of "Prob > F" less than 0.0500 indicate model terms are significant. In this case A, BC is significant model terms. Values greater than 0.1000 indicate the model terms are not significant (Figure 14).

Figure 14. ANOVA for size.
The "Curvature F-value" of 17.73 implies there is significant curvature (as measured by difference between the average of the center points and the average of the factorial points) in the design space. There is only a 2.45% chance that a "Curvature F-value" this large could occur due to noise.
The "Pred R-Squared" of 0.2755 is not as close to the "Adj R-Squared" of 0.8659. "Adeq Precision" measures the signal to noise ratio. A ratio greater than 4 is desirable. Hence the ratio of 10.852 indicates an adequate signal. This model can be used to navigate the design space. The R- squared value of the regression is 0.9497. It means that 95% of variation in the size can be explained by the above model. That is the above equation is statistically capable to produce 95% of size (Table 8).
| Std. Dev. | Mean | C.V. % | PRESS | R-Squared | Adj R-Squared | Pred R-Squared | Adeq Precision |
|---|---|---|---|---|---|---|---|
| 7.847505 | 102.4 | 7.663579 | 2662 | 0.9497193 | 0.8659182 | 0.275523 | 10.851862 |
Table 8: Final Equation in Terms of Actual Factors.

Figure 15. Contour plot showing the effect of speed on the particle size.

Figure 16. C3D Response Surface plot showing the effect of speed and time on size.
3D response surface plot shows that increase in the speed and time decreases the particle size.
Response 2: entrapment efficiency
The half normal plot shows the point which constitutes positive or negative effect on the entrapment efficiency. Here the significant factors affecting the entrapment efficiency are AC (speed and C:P ratio) and A (time) (Figure 17).

Figure 17. Half normal plot showing significant factors for entrapment efficiency.
The Model F-value of 62.14 implies the model is significant. There is only a 0.31% chance that a "Model F-Value"is large. This large value could occur due to noise.Values of "Prob>F" less than 0.0500 indicate model terms are significant. In this case A, C, AB, AC, ABC are significant model terms. Values greater than 0.1000 indicate the model terms are not significant The "Curvature F-value" of 5.33 implies the curvature (as measured by difference between the average of the center points and the average of the factorial points) in the design space is not significant relative to the noise. There is a 10.41% chance that a "Curvature F-value" this large could occur due to noise (Figure 18).

Figure 18. ANOVA for Entrapment efficiency.
The "Pred R-Squared" of 0.8470 is in reasonable agreement with the "Adj R-Squared" of 0.9745."Adeq Precision" measures the signal to noise ratio. A ratio greater than 4 is desirable. Hence ratio of 23.117 indicates an adequate signal. This model can be used to navigate the design space.The R- squared value of the regression equation is 0.9904. It means that 99% of variation in the entrapment efficiency can be explained by the above regression model. That is the combination in the above equation is statistically capable to produce 99% of entrapment efficiency (Table 9).
| Std. Dev. | Mean | C.V. % | PRESS | R-Squared | Adj R-Squared | Pred R-Squared | Adeq Precision |
|---|---|---|---|---|---|---|---|
| 1.8484 | 47.3 | 3.9079 | 164 | 0.9904 | 0.9745 | 0.847 | 23.1167 |
Table 9: Final Equation in Terms of Actual Factors.
The contour plot shows that speed of 400 – 500 rpm and C.P ratio of 3-5 gives good result on the entrapment efficiency (Figures 19–22, Table 10).

Figure 19. Contour plot showing the effect of speed and C:P ratio.

Figure 20. 3D Response surface plot showing the effect of speed and C:P on entrapment efficiency.
3D response surface plot shows that increase in the speed upto 500 and C:P ratio of 4 increases the entrapment efficiency.

Figure 21. Optimization constraints.

Figure 22. Optimization solutions.
| Formulation | Speed | Time | Crosslinking: polymer ratio |
|---|---|---|---|
| QC11 | 500 rpm | 4 hrs | 1:3 |
Table 10: Optimized formulation by the QbD tool.
Evaluation of Optimized Quercetin Formulation
Particle size and particle size distribution: The particle size of optimized quercetin nanoparticles formulation was found to be 97.5 nm and had narrow particle size distribution. Particle size of around 100 nm was required for kidney targeting. Thus the optimized products may be a suitable candidate for the effective treatment of renal cell cancer (Figure 23).`

Figure 23. Particle size of optimized formulation.
Drug entrapment efficiency: The entrapment efficiency was then calculated from the above given formula. The entrapment efficiency of optimized formulation was found to be 50%.
Zeta potential: The zeta potential of optimized formulation was found to be + 24.7 mv. Hence the prepared optimized formulation has high degree of stability (Figure 24, Table 11) [11].

Figure 24. Zeta Potential of optimized formulation.
| Paramters | Resultts |
|---|---|
| Particle size | 97.5 nm |
| Entrapment efficiency | 50 % |
| Zeta potential | +24.7 mv |
Table 11: Evaluation of optimized formulation QC11.
FTIR study of optimized formulation: The FTIR study of optimized formulation of quercetin nanoparticles was carried out using FTIR spectroscopy and the characteristics peaks are displayed in (Figure 25). The peaks of optimized formulation (top) matches with standard Quercetin spectra (bottom).

Figure 25. FTIR study of optimized formulation.
Surface morphology: The SEM and TEM analysis of the optimized formulation shows that they were irregular spheres with rough surfaces as shown in the (Figures 26-27).

Figure 26. SEM analysis of optimized formulation (QC11).

Figure 27. TEM analysis of optimized formulation (QC11).
In vitro release Study: The in-vitro release study of optimized quercetin nanoparticles formulation was carried out (Figure 28).

Figure 28. Invitro release study of optimized formulation with image of dialysis membrane (before and after study – middle and last image).
From the result (Table 12), it was found that there was a initial burst release of about 30.7% in first 5 hours. This may be due to the release of the drug entrapped on the surface of nanoparticles. Later it was found to have a sustained release up to 36 hours with 93% of drug release. After which there was no release.
| Time hrs |
Abs | Conc Mic gm/ml |
Conc Micgm/ 200 ml |
Correction | Cum. correction |
Total drug release micgm | Total drug release mg | % release |
|---|---|---|---|---|---|---|---|---|
| 0.5 | 0.002 | 1.612542 | 322.5084442 | 1.612542 | 0 | 322.5084 | 0.322508 | 6.450169 |
| 1 | 0.011 | 1.804826 | 360.9652871 | 1.804826 | 1.612542 | 362.5778 | 0.362578 | 7.251557 |
| 1.5 | 0.029 | 2.189395 | 437.8789729 | 2.189395 | 3.417369 | 441.2963 | 0.441296 | 8.825927 |
| 2 | 0.084 | 3.364465 | 672.8930127 | 3.364465 | 5.606764 | 678.4998 | 0.6785 | 13.57 |
| 3 | 0.143 | 4.624995 | 924.9989826 | 4.624995 | 8.971229 | 933.9702 | 0.93397 | 18.6794 |
| 4 | 0.208 | 6.013714 | 1202.742848 | 6.013714 | 13.59622 | 1216.339 | 1.216339 | 24.32678 |
| 5 | 0.282 | 7.594718 | 1518.943556 | 7.594718 | 19.60994 | 1538.553 | 1.538553 | 30.77107 |
| 6 | 0.316 | 8.321125 | 1664.224962 | 8.321125 | 27.20466 | 1691.43 | 1.69143 | 33.82859 |
| 9 | 0.393 | 9.966223 | 1993.244618 | 9.966223 | 35.52578 | 2028.77 | 2.02877 | 40.57541 |
| 12 | 0.498 | 12.20954 | 2441.907785 | 12.20954 | 45.492 | 2487.4 | 2.4874 | 49.748 |
| 18 | 0.606 | 14.51695 | 2903.389899 | 14.51695 | 57.70154 | 2961.091 | 2.961091 | 59.22183 |
| 24 | 0.771 | 18.04216 | 3608.432019 | 18.04216 | 72.21849 | 3680.651 | 3.680651 | 73.61301 |
| 30 | 0.910 | 21.01188 | 4202.376592 | 21.01188 | 90.26065 | 4292.637 | 4.292637 | 85.85274 |
| 36 | 0.995 | 22.8279 | 4565.580108 | 22.8279 | 111.2725 | 4676.853 | 4.676853 | 93.53705 |
Table 12: Drug release profile of optimized formulation (QC11).
Kinetic study: The results of kinetic study of optimized formulation were illustrated in the (Figure 29 and Table 13).

Figure 29. Higuchi mode.
| Formulation | Zero order | First order | Hixson- Crowell Model |
Higuchi Model | Korsemeyer-Peppas Model | |
|---|---|---|---|---|---|---|
| R2 | R2 | R2 | R2 | R2 | N | |
| QC11 | 0.962 | 0.7372 | 0.9906 | 0.9955 | 0.8059 | 0.8179 |
Table 13: Kinetic study of optimized quercetin nanoparticles formulation.
From the result (Table 13) the best fit release kinetic model was found to be Higuchi model for the optimized formulation, which indicated release from matrix type formulation. Since the value of n is less than 1.0, the optimized formulation follows non- Fickian diffusion mechanism for the transport of the drug.
Quercetin nanoparticles using the prepared low molecular weight chitosan (viscosity average molecular weight of 15 KDa) by ionic gelation method and the formulation was optimized by optimization technique (23 factorial method) using design expert software. The average particle size was found to be 97.5 nm with entrapment efficiency of 50% and zeta potential of +24.7 mv.
The release kinetics study of quercetin nanoparticles was carried out using dialysis technique. The drug release profile showed that there was a burst release of 30.7% in first 5 hrs and 93% was released in 36 hrs. In release kinetic study the release profile had a best fit with Higuchi model with R2 value of 0.995 and hence it was considered that optimized formulation has matrix type release characteristics.