Research & Reviews: Journal of Chemistry
e-ISSN: 2319-9849
e-ISSN: 2319-9849
Noor-Ul-Ain1,*, Martin O Eriksson2, Susann Schmidt2, M Asghar3, Per Olof Holtz2, Syvajarvi M2 and G Reza Yazdi2
1Department of Physics, Government Sadiq College Women University, Bahawalpur, 63100 Bahawalpur, Pakistan.
2Department of Physics, Chemistry and Biology, Linköping University, SE-58183 Linköping, Sweden
3Department of Physics, The Islamia University of Bahawalpur, 63100, Pakistan
Received date: 12/09/2017 Accepted date: 27/09/2017 Published date: 03/10/2017
Visit for more related articles at Research & Reviews: Journal of Chemistry
The influence of substrate on the graphene is an important subject to study as it may alter the properties of graphene. Herein we report the effect/ involvement of substrate on optical properties of un-doped and doped GQDs. Cl doped GQDs was selected for the study wherein Cl doping was done using hydrochloric acid as Cl source. Furthermore, silicon (Si), SiC (SiC) and graphene/SiC (G/SiC) was selected as three different substrates for the study. The graphene/SiC used was grown via thermal decomposition of SiC (SiC) substrates. With the intention to observe the effect of substrate on the optical properties of GQDs, the undoped and Cl-GQDs was drop casted on each substrate. The surface morphology, thickness, structure and optical properties of GQD have been assessed by atomic force microscopy (AFM), scanning electron microscopy (SEM), photoluminescence (PL) and time resolved PL (TRPL). The photoluminescence (PL) measurements of undoped and Cl-GQDs showed no change in emission peaks which demonstrated that substrate have no effect on luminescence of GQDs. Further on, TRPL measurements of undoped and Cl-GQDs revealed the bi-exponential behavior with no observable effect on the short and long lifetime component on each substrate
Graphene, Quantum dots, Raman spectroscopy
A honeycomb lattices of sp2-bonded carbon atoms in two dimensions is known as Graphene. Owing to its outstanding chemical and physical properties, it has become promising nano-material in the field of future electronic devices [1-3]. In view of these graphene-based nano-devices, the interfacial properties of graphene and the substrates are of great importance. Furthermore, the interaction between graphene and substrate is interesting and important subject to study because it may influence the properties of graphene. Much work has been done to observe the effect of substrate on the mechanical and thermal properties of graphene. In this regard, interfacial properties of graphene on various substrates such as SiO2, copper and SiC has been extensively reported [4-8]. Seol et al. and Lindsay et al. suggested that the thermal conductivity in free graphene which was 75% due to phonons were damped when placed on the substrate [9,10] whereas Nika et al. and Kong et al. Showed that thermal conductivity of free graphene is independent of the phonons [11,12]. Apart from thermo-mechanical properties, the calculations of adhesive energies are also reported. Ishigami et al. showed by scanning tunneling microscopy technique/atomic force microscopy that monolayer graphene largely follows the surface morphology of SiO2 by calculating the adhesion energy between them [13]. In comparison to that, Koenig et al. also calculated the adhesion energies and explained that the surface morphology of SiO2 depends upon the surface structure and chemical reactivity [14]. Ong et al. used simulation method to explain the effect of coupling on thermal conductivity of graphene on SiO2 substrate [15]. Ni et al. performed Raman spectroscopy to study the interaction of graphene with SiC substrate. They demonstrated that the blue shift in Raman of graphene on SiC is attributed to the stress induced in graphene by SiC substrate. Also they studied the band structure of graphene on C terminated SiC and Si terminated SiC [16]. Keeping in view the changes in thermal and mechanical properties of graphene, these observations initiated our interest to explore the tunability of properties of GQDs with respect to the substrates. As far as our knowledge is concern, the optical properties of graphene/SiC and graphene quantum dots on different substrates are not reported yet.
In our previous reported work, we have tuned the emission energy of chemically doped GQDs wherein Na-, K-, and B-GQDs exhibited blue-shift in the PL emission as compared to undoped GQDs and Cl- and N-GQDs exhibited red-shift in emission. The detailed XPS study revealed that reduction process was observed in case of Na-, K- and B-GQDs which reduced the mid gap levels/oxygen functional groups, which widened the band gap and was the reason of observed blue shift. Likewise, in Cl- and N-GQDs, the oxidation phenomena was seen, which in turn increased the mid gap levels/ oxygen functional groups, this narrowed the band gap and was the reason of observed red-shift of PL [17]. In this work, the effect of substrate on the optical properties of undoped and Cl-GQDs was observed. The undoped and Cl-GQDs were drop casted on Si, SiC and graphene. The growth of epitaxial graphene was performed via thermal decomposition of SiC (SiC) substrates in an inductively heated furnace. The undoped GQDs showed green emission whereas the Cl-GQDs showed slight red-shift in emission regardless of the substrate used. In optical measurements, PL and TRPL emission of undoped and Cl-GQD have been extensively studied on each substrate to observe the dependence of luminescent properties of GQDs on the substrate used. Furthermore, the surface morphology, thickness, structure and optical properties have been assessed by using atomic force microscopy (AFM), scanning electron microscopy (SEM), reflectance mapping, X-ray photoelectron spectroscopy (XPS). To the best of our knowledge, this study is the first one to understand the optical properties of GQDs with respect to different substrates.
Experimental DetailsPreparation details of chemically doped GQDs: Water soluble green GQDs (2 mg/ml) purchased from ACS Materials Co, were dispersed in a solution containing dimethylformamide (DMF). Cl-GQDs were prepared by chemical doped method using diluted HCl (hydrochloric acid) as Cl source. The doping concentrations used for Cl-GQDs were 2 mol/L and 4 mol/L (represented as 2% and 4% hereafter). After reducing the concentration to 2% and 4%, it was mixed in GQDs using ratio 1:1. The solutions was stirred for 10 seconds, the mixed solution was drop-casted on Si, SiC and G substrates followed by heating at 85°C for 10 minutes on hot plate. The Si and SiC substrates were post cleaned using RCA steps, in order to remove all organic and inorganic contamination from them. Preparation procedure is shown in Figure 1.

Figure 1: Sample preparation method [17].
Preparation of graphene (on SiC) used as substrate: Growth of epitaxial graphene was performed via thermal decomposition of SiC (SiC) substrates in an inductively heated furnace under isothermal conditions at a temperature of 2000°C and at an ambient argon pressure of 1 atm [18]. The Si-terminated of n-type, on axis 4H-SiC (0001) substrates which employed for the growth of graphene were chemo-mechanically polished (CMP). The SiC wafer were cut in rectangular pieces of 7 × 7 mm2 and cleaned in four stages to remove organic, inorganic contaminations, and oxide on the SiC substrate surface. The preparation of epitaxial graphene by the thermal decomposition of SiC has been proposed as a viable route for the synthesis of uniform, wafer-size graphene layers for technological applications. By having full control on the growth conditions we are able to growth large area buffer layer, monolayer (ML) or mixing of ML and bilayer epitaxial graphene with different percentage. For this study we have used samples with large area coverage by ML. Graphene surface morphology, thickness, structure and optical properties have been assessed by using AFM, SEM, reflectance mapping, PL and TRPL.
Characterizations: SEM was performed on the undoped GQDs on Si substrate to determine the presence of GQDs on substrate. Scanning electron microscopy (SEM, LEO 1550 Gemini, Zeiss, Germany) operated at an acceleration voltage of 16.69 kV at a working at in-lens mode. For the PL study, the samples were excited with a laser with a wavelength of 266 nm. The spectrum was recorded with a Jobin Yvon TRIAX 550 spectrometer with a focal length of 550 mm, a 600 gr/mm grating and a liquid nitrogen cooled CCD detector. For the TRPL study, the samples were excited with a 266 nm pulsed laser with a pulse duration of approximately 200 fs and a repetition rate of 75 MHz. The PL transients were recorded by a streak camera from Hamamatsu with a temporal resolution of approximately 10 ps, connected to a spectrometer with a focal length of 500 mm and a 150 gr/mm grating. The TRPL image was recorded by a Peltier cooled CCD. The PL study used a continuous wave 266 nm laser as excitation source, whereas a pulsed 266 nm laser was used for the TRPL study. AFM was performed on Graphene on SiC used as substrate. The micro and nano-scale morphology of graphene layers were determined in air ambient with a Veeco DI Dimension 3100 scanning probe microscope, using taping mode AFM.
Figure 2a and 2b shows SEM images of GQDs on Si substrates. SEM is performed on un-doped GQDs on Si substrate to confirm their attachment on surface.

Figure 2: (a) SEM of undoped GQDs (b) AFM of undoped GQDs on Si substrate [17].
Photoluminescence of the undoped and 2% and 4% Cl-GQDs on Si, SiC and G substrate at room temperature was performed to investigate the effect of substrate on optical properties of GQDs, the PL emission peaks. We randomly selected three different positions for the each sample on each substrate and found no appreciable variation in the results. The characteristics peak of undoped GQDs is at 518 ± 1 nm, which is consistent with the peak value reported for green GQDs.
As shown in Figure 3, The undoped GQDs on Si substrate shows the PL emission peak at 519 nm (green). The PL peak of 2% and 4% Cl-GQDs on Si shows slight red-shift of 10 nm, with PL peaks emission at 527 nm and 529 nm, respectively. Likewise, same trend is observed on SiC substrate wherein the PL peak of undoped GQDs appears at 518 nm whereas for 2% and 4% CLGQDs, the peak slightly red-shift to 530 nm and 523 nm respectively, with the shift of about 12 nm. In the same way, on Graphene substrate, the PL emission peak of undoped GQDs appears at 517 nm whereas for 2% and 4% Cl-GQDs, the PL emission peaks is observed at 528 nm and 529 nm respectively, showing the slight red shift of 10 nm.

Figure 3: PL emission of undoped GQDs, 2% Cl-GQDs and 4% Cl-GQDs on Si, SiC and Graphene substrates respectively.
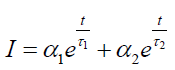
Time Resolved Photoluminescence (TRPL): Time resolved photoluminescence was performed on undoped GQDs and Cl- GQDs on Si and SiC substrates using laser pulsed at 255 nm wavelength and streak camera detector at room temperature. The TRPL decay leads to two lifetime components involved in the relaxation process: One short lifetime component, τ1, ranging from 0.14 ns to 0.15 ns, and other long lifetime component, τ2, ranging from 3.1-4.4 ns (see Table 1). The following equation was fitted to the TRPL decay curve:
| Samples | Short lifetime components (ns) | Long Lifetime components (ns) | ||
|---|---|---|---|---|
| Si | SiC | Si | SiC | |
| GQDs | 0.15 | 0.15 | 3.1 | 3.5 |
| 4% Cl-GQDs | 0.14 | 0.14 | 3.7 | 4.2 |
Table 1: The short and long lifetime components of undoped and 4% Cl-doped GQDs samples.
The parameters α1 and α2 are proportionality constants, and t is the time. With this simplified model, the PL is explained as having two lifetime components (one short, τ1, and one long, τ2). The short lifetime component, τ1, ranges from 0.14 ns to 0.15 ns for the five samples, and other long lifetime component, τ2, ranges from 3.1 ns to 4.2 ns.
In excitation dexcitation phenomena, after absorbance of incident photon, carriers are excited from HOMO (highest occupied molecular orbit) of ground state to LUMO (lowest unoccupied molecular orbit) of the excited states of oxygen groups [17]. During relaxation, the short lifetime component showed almost negligible change for undoped, 4% Cl-doped GQDs on Si and SiC as shown in Table 1. In case of lifetime components of undoped and 4% Cl-doped GQDs, the long lifetime component shows the small change (negligible) for Si and SiC substrate respectively as shown in Figure 4. This is also in good agreement with the observed PL results and justifies that there is no effect of the substrate on the optical properties of GQDs.

Figure 4: Long lifetime components of undoped GQDs and 4% Cl-GQDs on Si and SiC substrates.
In summary, we investigated the effect of substrate on the optical properties of undoped and Cl doped GQDs on Si, SiC and Graphene as substrate. PL emission of Cl-GQDs exhibited the red-shift tendency on all the substrates i.e. on Si, SiC and G with no change in emission energies observed with respect to each substrate. Time resolved photoluminescence (TRPL) on undoped and 4%-Cl-GQDs (on Si and SiC) was also performed wherein the decay curve showed bi-exponential behavior having long and short lifetime component. TRPL of undoped GQDs and 4% Cl-GQDs on Si and SiC showed the same results on each substrate which substantiated that the optical properties of GQDs (undoped and Cl doped GQDs) are independent of the substrate used. These TRPL results are in good agreement with the observed PL results [19].