Research & Reviews: Journal of Chemistry
e-ISSN: 2319-9849
e-ISSN: 2319-9849
Nimibofa Ayawei1, Victoria Bennetta2*
1Department of Chemistry, Medical University, Onopa, Nigeria
2Department of Chemical Sciences, University of Africa, Toru-Orua, Sagbama, Nigeria
*Corresponding author
Victoria Bennetta
Department of Chemical Sciences
University of Africa
Toru-Orua
Sagbama
Nigeria
E-mail: vkalapoi@gmail.com
Received: 01-Mar-2022, Manuscript No. JCHEM-22-51408;
Editor assigned: 03-Mar-2022, Pre QC No. JCHEM-22-51408 (PQ);
Reviewed: 17-Mar-2022, QC No. JCHEM-22-51408;
Revised: 29-Apr-2022, Manuscript No. JCHEM-22-51408 (R);
Published: 09-May-2022, DOI: 10.4172/ 2319-9849.11.5.006.
Visit for more related articles at Research & Reviews: Journal of Chemistry
The objective of this research is to determine the Biochemical Oxygen Demand (BOD) level in water samples from Ntanwoba Creek, Port Harcourt, and Rivers State, Nigeria. Water samples were collected from four locations designated as A, B, C and D, for the determination of Biochemical Oxygen Demand (BOD) using the titration method. The BOD values in the water samples from the four sampling points were higher than the WHO limits for the protection of fish and other aquatic life, indicating high pollution of this portion of Ntanwoba Creek. The high BOD values of the analyzed water samples are attributed to runoff of wastewater from agricultural activities and automobile workshops around the study area. For the well-being of aquatic life in the area of study, there should be a continuous monitoring of agricultural and industrial drainage containing organic materials into the creek.
Keywords: BOD; Water; Pollution; Dilution method
Unlike air, which is normally about 21 % oxygen, water contains only a tiny fraction of a percentage of dissolved oxygen expressed in milligrams per liter (mg/L), parts per million (ppm), or percent of saturation. At sea level, typical dissolved oxygen concentrations in 100 % saturated fresh water ranges from 7.56 mg/L at 30oC-14.62 mg/L at 0 oC. The amount of dissolved oxygen that a given volume of water can hold is a function of atmospheric pressure, water temperature, and the amount of other substances dissolved in the water [Minnesota pollution control agency]. The level of Dissolved Oxygen (DO) in water is one of the most important parameters in determining its quality, because it indirectly indicates whether there is some kind of pollution. Common processes that pollute surface waters include: Discharge of municipal and industrial wastewaters as well as agricultural and industrial drainage containing organic materials in the water [1]. In addition, the release of cool or cold water into warmer water or hot discharges from industrial cooling towers induces thermal pollution. Such discharges decrease the amount of dissolved oxygen in the water, which aquatic life requires, damage larvae and eggs of fish in rivers, killing off some species of fish and macro vertebrates that have a limited tolerance for temperature change. Bottom feeders, crabs, oysters and worms, need minimal amounts of oxygen (1-6 mg/L), while shallow water fish need higher levels (4-15 mg/L) Biochemical Oxygen Demand (BOD) is an empirical parameter that refers to the amount of required oxygen for microorganisms to oxidize organic materials in wastewater, effluent, and polluted water sample [2]. Dilution and manometric methods are the two most conventional methods for measuring the BOD. In these methods, BOD is calculated through the changes in the amount of DO in water samples or by pressure drop, which is the result of oxygen consumption in a bottle containing the sample. In the dilution method, samples are incubated for n-days (5 days as BOD5 in the standard test) at 20oC in a dark bottle and the initial and final amount of oxygen is determined using an amperometric sensor or iodometric titration. Hassan and others, studied the interferences of carbonate turbidimetry on Biochemical Oxygen Demand (BOD) without nutrification and mineral oxidant bacteria. They reported that the results of the BOD analysis were comparable with those of the standard mano metric method. Application of water quality indices and dissolved oxygen as indicators for river water classification and urban impact assessment was carried out by and observed a significant decrease in water quality in the urban areas as well as the rural areas [3]. Jingshui and others, modeled dissolved oxygen depression in an urban river in china, and observed that the daily DO levels within the 11.5 mg/l upstream of the Wangtang wastewater Treatment Plant seriously depleted to 3.6 mg/L downstream. Jin and Jinwoo, applied fluorescence Excitation-Emission Matrices (EEM) with Parallel Factor Analysis (PARAFAC) and UV absorption values at 220 nm and 254 nm to study the extent of pollution of the Gap River in Korea. They reported that among the selected indices, UV220, C3 and C1 exhibited the highest correlation coefficients with BOD, COD, and TN concentrations, respectively, applied the Geographic Information System (GIS) to study the DO and BOD of Dez River basin water [4]. They reported that the average maximum amount of DO at an average of six months is 8.47 mg/L in S1 station and the minimum amount is 1.71 mg/L in S8 station, employed a new approach for rapid assessment of trophic status of Yellow Sea and East China Sea using easy-to-measure parameters, and reported that the model yielded classification accuracy rates of 97.1%, 80.5%, 90.3%, and 89.1% for good, moderate, and poor water qualities [5]. Their results suggested that these easy-to-measure parameters could be used to develop a simple approach for rapid in-situ assessment and monitoring of the eutrophication of estuarine and offshore areas. Rajab and others, (2017) investigated the performance of a new configuration laboratory-scale bioreactor comprising of two regimes (anaerobic and aerobic) in one reactor (IAASER) with physical separation, and reported that the IAASBR exhibited the average removal efficiency of total COD, soluble COD, NH3-N, fat, oil and grease, and total suspended solids (97% ± 2%), (95% ± 3%), (98% ± 1.3%), (90% ± 11%), and (96% ± 3%) respectively, identified an interfering factor on Chemical Oxygen Demand (COD) in piggery wastewater and eliminating the factor by an indigenous pseudomonas stutzeri strain and reported that NO2--N interference is significant when its concentration in piggery wastewater exceeds 100 mg/L. This paper is a research of the Biochemical Oxygen Demand (BOD) values of Ntanwoba Creek in Port Harcourt, Rivers State, Nigeria. In this research, water samples were collected from four designated regions and the BOD investigated using dilution method.
Materials
All chemicals used in the experiments were in the analytical reagent grade and were purchased from acros organics and used without further purification.
Preparations of 0.017 M potassium iodate (KIO3) solution
This was prepared by dissolving 0.89 g of the salt in a 250 cm3 volumetric flask and diluted to the mark.
Preparation of Alkaline Potassium Iodide (KI) Solution
This was prepared by dissolving 5.6 g potassium hydroxide salt in a 100 cm3 volumetric flask, 16.6 g of potassium iodide was added in the same flask and diluted to the mark with distilled water.
Preparation of 0.538 M Manganese (II) Sulphate (MnSO4.4H2O) solution
This was prepared by dissolving 120 g of the salt in a 250 cm3 volumetric flask and diluted to the mark with distilled water.
Preparation of fresh starch solution
This was prepared by dissolving 2.00 g of soluble starch with a little distilled water in a 100 cm3 volumetric flask and poured immediately into 250 cm3 boiling water. The solution was further boiled for 5 minutes, 0.02 g of mercuric iodide was added to the boiling solution and was allowed to cool [6-10].
Preparation of 1:1 H2SO4 solution
This was prepared by transferring 20 cm3 of conc. H2SO4 in a 100 cm3 volumetric flask and 20 cm3 of distilled water was added.
Preparation of 0.1 M Sodium thiosulphate solution
This was prepared by dissolving 12.60 g salt in a 500 mL beaker and made up to the mark with distilled water.
Standardization of sodium thiosulphate with potassium iodate
This was calculated using equations (1) and (2).
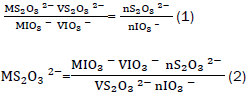
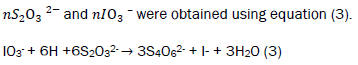
Where s the molarity of sodium thiosulphate, s the molarity of the iodate, s the volume of the iodate, s the volume of thiosulphate, s the number of moles of iodate and s the number of moles of thiosulphate. To obtain, 25 cm3 potassium iodate solution was transferred into a 250 cm3 volumetric flask. To liberate iodine, 15 cm3 of potassium iodide solution, and 5 cm3 of 1:1 sulphuric acid were added in the same flask. The liberated iodine was titrated against sodium thiosulphate. A pale yellow solution was obtained. Three drops of freshly prepared starch solution were added [11]. The colour of the solution changed from pale yellow to blue. The solution was further titrated against sodium thiosulphate until the solution becomes colourless.
Experimental Procedures
250 cm3 sample bottles labeled A-D were used to collect water from four different locations, depth and time. The temperatures of the samples were determined before taken to the laboratory for treatment. To avoid significant errors in the analysis, a minimum time interval of 30 minutes and a maximum of 2 hrs between the time of collection and the time of treatment were maintained [12].
The samples were treated with 2 ml of alkaline KI solution, light brown precipitates were formed. The bottles were thoroughly stoppered to remove all air bubbles. The bottles were agitated manually for 15 minutes for proper mixing and inverted for 3 minutes. 2 ml of 1:1 H2SO4 were added and the bottles were agitated and inverted again for 3 minutes. The precipitates dissolved and a clear yellow solution was obtained. The method was repeated four times and the average titre value calculated. 25 cm3 of treated water was titrated against 0.0975 M Na2S2O3 solution. A pale yellow solution was obtained. 3 drops of freshly prepared starch solution was added and further titrated with the thiosulphate until the solution [13-16]. The method was repeated four times and the average titre value calculated. The number of moles of S2O32- was calculated using equation (4).

The second fraction of the treated samples were stoppered to prevent air penetration and incubated in a dark cupboard for five days at 20oC. The main purpose of the incubation is to avoid further photosynthesis process in the samples. The samples were analyzed to determine the final Dissolved Oxygen (DO). The difference between the initial dissolved oxygen and the final dissolved oxygen gave the investigated Biochemical Oxygen Demand (BOD) of the water samples [17].
The amount of dissolved oxygen in the four locations was calculated using the formula
BOD5 = D1–D2
Where BOD5 is the biochemical oxygen demand after incubation
D1 is the initial dissolved oxygen
D2 is the final dissolved oxygen.
| S/N | Location | Dept (ft) | Time (Central African Time) | D1 mg/L | D2 mg/L | BOD5 mg/L |
|---|---|---|---|---|---|---|
| 1 | A | 1.5 | 0.34375 | 43.68 | 34.32 | 9.36 |
| 2 | B | 1.5 | 0.34375 | 43.67 | 37.44 | 6.23 |
| 3 | C | 2 | 0.666667 | 21.84 | 16.8 | 6.29 |
| 4 | D | 2 | 0.673611 | 24.96 | 19.34 | 5.62 |
Table 1. Summary of the BOD5 values in Ntanwoba Creek.
The results indicate that Biochemical Oxygen Demand (BOD) values vary with location, depth, rate of flow of water current, time and temperature. Location A recorded the highest initial amount of dissolved oxygen, 9.36 mg/L. Sample A was collected from a relatively stagnant region when the sun was just setting at 25oC. Then there was little or no sunlight for photosynthetic processes by the organisms in the water. Previously dissolved oxygen must have been used up by the micro-organisms, hence, the high BOD value. The high BOD values were further attributed to runoff of wastewater from agricultural activities and automobile workshops into the study area [18-20].
BOD value for sample D recorded a lower value, 5.62 mg/L. This was attributed to the location, temperature and time the sample was collected. The sample was collected when there was much sunlight for photosynthetic processes by the organisms. The lower result is further attributed to the high water flow speed that propels sludge deposits away, hence less amount of the bacteria.
Thus, the Biochemical Oxygen Demand (BOD) values of the four locations of Ntanwoba creek are relatively high, and are attributed to the human activities around the creek. But despite the high BOD values, it still supports aquatic life. For the well-being of aquatic life in the area of study, there should be a continuous monitoring of agricultural and industrial drainage containing organic materials into the creek.