Journal of Global Research in Computer Sciences
ISSN: 2229-371X
ISSN: 2229-371X
Katharotiya Grasmit*, Makadiya Akshay
Department of Computer, Shree Swami Atmanand Saraswati Institute of Technology, Gujarat, India
Received Date: 17/09/2021; Accepted Date: 01/10/2021; Published Date: 08/10/2021
Visit for more related articles at Journal of Global Research in Computer Sciences
The k-Nearest Neighbor (kNN) rule is a classical non-parametric classification algorithm in pattern recognition, and has been widely used in many fields due to its simplicity, effectiveness and intuitiveness. However, the classification performance of the kNN algorithm suffers from the choice of a fixed and single value of k for all queries in the search stage and the use of simple majority voting rule in the decision stage.
k-Nearest Neighbor; Algorithm; Neighbours
KNN is a lazy learning, non-parametric algorithm. It uses data with several classes to predict the classification of the new sample point. KNN is non-parametric since it doesn’t make any assumptions on the data being studied, i.e., the model is distributed from the data [1].
What does it mean to say KNN is a lazy algorithm? It means it doesn’t use the training data points to make any generalisation which implies:
•You expect little to no explicit training phase,
• The training phase is pretty fast,
• KNN keeps all the training data since they are needed during the testing phase.
Most data does not obey the typical theoretical assumptions, like when we consider a model like linear regression, which makes KNN crucial when studying data with little or no prior knowledge (Figure 1).

Figure 1. KNN Algorithm.
K-NN Algorithms
As here the value of k is 3 which means we have to consider the 3 nearest neighbours to determine the class of the “STAR” symbol, As shown above, the three nearest neighbours to the “STAR” symbol are “Two Yellow and one Blue” dot. It is easy for us (Humans) to select the nearest neighbour points [2], but how will a machine find the nearest neighbour values? So, here comes the concept of Euclidean Distance and Manhattan Distance.
Euclidean Distance is the least possible distance between two points or straight-line distance between two points. Like here, ‘d’ represents the Euclidean Distance between two points (x1,y1) and (x2,y2) (Figure 2).

Figure 2. Euclidean Distance between two points (x1,y1) and (x2,y2).
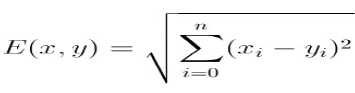
It can be measured by taking the square root of the sum of the square of the distance between two points. e.g. the Euclidean Distance between the point A at (x1,y1) and B at (x2,y2) will be √ (x2−x1)2 + (y2−y1)2.
Now for two points ‘X’ and ‘Y’ with n dimensions the formula to calculate Euclidean Distance will be
Manhattan Distance is the distance between two points measured along the axis at right angles, So it may not be the least distance between the points (Figure 3).

Figure 3. Manhattan distance between two points.
It can be calculated by taking the sum of the absolute distance between two points.
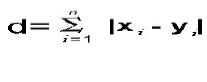
e.g. the Manhattan Distance between the points A at (x1, y1) and B at (x2, y2), will be |x1-x2| + |y1-y2|.
Now for two points ‘X’ and ‘Y’ with n dimensions the formula to calculate Manhattan distance will be
In this figure, Green line represents the Euclidean Distance (least distance between two points) and the Blue line represents the Manhattan Distance (distance between two points on a certain axis at right angles) (Figure 4).

Figure 4. Difference between Euclidean distance and Manhattan distance.
Now a question arises, which distance metric to choose?
This depends upon the data generally; if the data is high dimensional (dataset with a large number of features) then the Manhattan Distance will be a better fit [3]. However, if the data is low dimensional (dataset with less number of features) then the Euclidean Distance will be a better fit. If you still find it unclear, then follow the hit and trial approach.
After finding the shortest distance, find the class of the k nearest neighbours to the “STAR” symbol. Here the 3 nearest neighbours include 2 Yellow dots and 1 Blue dot and as the number of Yellow dots is more the number of Blue dots so the STAR symbol seems more similar to Yellow dots hence it will come under Class B [4]. As the value of k is 6, so we have to take the 6 nearest neighbours to reach a conclusion (Figure 5).

Figure 5. Implementation of the same above problem statement when the value of K is 6.
As shown in the image, when the value of k is 6, then 4 Blue dots and 2 Yellow dots will be the 6 nearest neighbors of the STAR symbol. Clearly, the number of Blue dots is more than the number of Yellow dots then the STAR symbol will lie in Class A.
Summarizing the Algorithm
• Load the data.
• Decide the Features and Target.
• Split the dataset into Training and Testing data.
• Fit the KNN model and find the value of k for which there is minimum Root mean square error.
• Implement the KNN classification model with k as the value we got from the previous step.
• Test it on the testing data and check the accuracy.
‘k’ in KNN algorithm is based on feature similarity choosing the right value of K is a process called parameter tuning and is important for better accuracy. Finding the value of k is not easy.
• There is no structured method to find the best value for “K”. We need to find out with various values by trial and error and assuming that training data is unknown.
• Larger values of K will have smoother decision boundaries which mean lower variance but increased bias. Also, computationally expensive.
• Another way to choose K is though cross-validation. One way to select the cross-validation dataset from the training dataset. Take the small portion from the training dataset and call it a validation dataset, and then use the same to evaluate different possible values of K. This way we are going to predict the label for every instance in the validation set using with K equals to 1, K equals to 2, K equals to 3 and then we look at what value of K gives us the best performance on the validation set and then we can take that value and use that as the final setting of our algorithm so we are minimizing the validation error.
• In general, practice, choosing the value of k is k=sqrt (N)where N stands for the number of sample in your training data.
• Try and keep the value of k odd in order to avoid confusion between two classes of data.
Application OF K-NN
KNN is often used in search applications where you are looking for “similar” items. That is when your task is to “find items similar to this one”.
Recommendation system
If you know a user likes a particular item, then you can recommend a similar type of item for him. KNN algorithm can be used in the recommendation systems [5]. In this, first users have to be classified on the basis of their searching behaviour and if any user searches for something then we can recommend a similar type of item to all the other users of the same class.
Concept search
If you’re searching for semantically similar documents (i.e., documents containing similar topics), this is referred to as Concept Search. This algorithm can be used to classify the documents on the basis of their content in order to make the searching process easy.
Security purposes
KNN Algorithm can be used for security purposes like in facial recognition. This algorithm is implemented over the feature vectors (generated using deep learning techniques) to identify a person by comparing the face to the watchlist.
Working on a big dataset can be an expensive task. Using the condensed nearest neighbour rule, we can clean our data and can sort the important observations out of it. This process can reduce the execution time of the machine learning algorithm. But there is a chance of accuracy reduction.
The steps to condense are to divide data points into these:
• Outliers: Observations that lie at an abnormal distance from all the data points. Most of these are extreme values. Removing these observations will increase the accuracy of the model.
• Prototypes: Minimum points in training set required to recognize non-outlier points.
• Absorbed points: These are points that are correctly identified to be non-outlier points.
I would like to express my special thanks of gratitude to my teacher Prof. Binita Acharya as well who gave me the golden opportunity to do this wonderful project on the topic KDD process in data mining, which also helped me in doing a lot of Research and i came to know about so many new things. I am really thankful to them. Secondly i would also like to thank my parents and friends who helped me a lot in finalizing this project within the limited time frame.