ISSN ONLINE(2319-8753)PRINT(2347-6710)
ISSN ONLINE(2319-8753)PRINT(2347-6710)
S. Sreehari Sastry1,*, K. Lakshmi Sarada2, K. Mallika2, L. Tanuj Kumar2 and Ha Sie Tiong3
|
| Related article at Pubmed, Scholar Google |
Visit for more related articles at International Journal of Innovative Research in Science, Engineering and Technology
Phase transition temperatures of ferroelectric liquid crystals: ((S)-(-)-2-methylbutyl 4’-(4”–nalkanoyloxybenzoyloxy) biphenyl-4-carboxylates (where n = 16 and 18) are identified using of maximum eigen value analysis. The textures of the samples are recorded with the Optical Polarizing Microscope (POM) which has the attachments of hot stage and high resolution camera connected directly to computer system. Eigen values of the recorded textures are computed using MATLAB software. The phase transition temperatures of samples are inferred by the abrupt changes in the computed maximum eigen values. The results of study are in good agreement with those published in earlier literature being made with technique Differential Scanning Calorimetry. The smooth transitions smectic A to Smectic C* which are not resolved in the DSC studies are identified using maximum Eigen value analysis.
Keywords |
| Ferroelectric Liquid crystals, Polarizing Optical Microscope, Phase transitions, Eigen values, Differential Scanning Calorimetry |
INTRODUCTION |
| Ferroelectric Liquid Crystals(FLC) has generated much interest to synthesize and characterize the new FLCs [1-4] due to their wide applications in the use of optical switches, light valves, display and storage devices and also other electrooptic devices. The basic study involved in the characterization of newly synthesized any liquid crystal compound is phase transition temperatures. These are important quantities to characterize mesophase behaviour of the synthesized materials. There are several techniques used to identify the mesophases or phase transitions of liquid crystals, such as Polarizing Optical Microscope (POM), Differential Scanning Calorimetry (DSC), Differential Thermal Analysis (DTA) and X-ray Diffraction (X- RD), etc. The most widely used technique is POM, which reveals that each different liquid crystal phase has a distinct optical texture [5,6]. However, the identification is often difficult due to subtle optical changes which are not perceptible with the naked eye. DSC and DTA are the complementary techniques to POM, but they present some limitations since the transitions with low enthalpy are difficult to be observed and the exact type of liquid crystal phase cannot be identified. The level of enthalpy variation gives some information regarding the degree of molecular ordering within a mesophase. X-RD experiments are useful to identify ordered mesophase and also to obtain the structure parameters [7,8]. The analysis of microscopic textures obtained from the Polarizing microscope can be used to identify the transition temperatures of FLCs. In this communication, we report the Maximum Eigen value analysis of textures in conjunction with POM to obtain transition temperatures of homogeneously aligned chiral ester liquid crystals (S)-(-)-2-methylbutyl 4’-(4” –n-alkanoyloxybenzoyloxy) biphenyl-4-carboxylates (S-MB-nB-BC) where n = 16 and 18 from the solid phase to the isotropic liquid phase. The results of the study are compared with earlier literature being made with technique Differential Scanning Calorimetry [9,10]. This analysis is useful to identify the occurrence of smooth transitions of given FLCs. |
EXPERIMENTAL |
| Ferroelectric liquid crystals: (S)-(-)-2-methylbutyl 4’-(4” –n-alkanoyloxybenzoyloxy) biphenyl-4-carboxylates where n = 16 and 18 possessing different alkyl chain lengths are synthesized [9] and used. The ITO coated homogeneous cell having area of 5mm X 5mm with 8.7ïÃÂÃÂm spacing (tolerance is ± 0.2 μm) are obtained from Instec Inc., USA [11]. Homogeneous alignments were obtained in the sandwich cell with surfaces, which were treated by rubbing method. The chiral ester mesogens are injected into liquid crystal cells through capillary action on heating the sample to the isotropic state. The different phase transitions can be observed nakedly at the time of cooling the liquid crystal cell after injecting the samples and good alignment is achieved by cool down the cell very slowly. The flowing direction of the liquid crystal during cell filling is found to influence the molecular alignment in the resultant liquid crystal layer. Better alignment of liquid crystal layer will achieved when the liquid crystal is allowed to flow into the cell toward the direction in which the surface is aligned and obviously, the appearance will be strictly controlled by the nature of the alignment surface in the cells that are used. Temperature dependent textural investigations are carried out by Meopta polarizing optical microscope (with 40Xmagnification) attached to hot stage as described by Gray [12] and high resolution Canon colour camera. |
| Canon EOS Digital REBEL XS/ EOS1000D is a digital single lens reflex camera with a 10.10 mega pixel image sensor and it also incorporates the EOS integrated cleaning system to eliminate dust spot on images, the self cleaning sensor unit to shake off dust on the sensor. Although the LCD monitor is manufactured with very high precession technology with over 99.99% effective pixels, there might be a few dead pixels among the remaining 0.01% or fewer pixels. They do not affect the images recorded. With 10.10 mega pixel output, the Canon EOS Digital REBEL XS/ EOS1000D has a true colour reproduction, low noise, wide dynamic range and good spatial and spectral resolution. The high maximum frame rate is 3fps. Live images are displayed from a monitor is extremely simple and natural. The characteristic colours of microscope samples can record faithfully with true colour reproduction. The ability to capture the colours observed with the microscope enables high precession colour analysis in all fields of science, medicine and industry. Digital cameras have difficult to balance accurate colours especially against red and yellows; due to this the image shots looks unnatural. To avoiding this, the digital cameras are designed with custom white balance. A custom white balance calibrates the camera to the exact colour temperature of light which illuminates the object [13 - 16]. The texture images detected by the camera has a resolution of 2816 x 1880 pixels and the intensity values of pixels ranges from 0 to 255. The image dimensions are selected to be 256 (image of size: 256 X 256). Captured images are stored in computer for further processing. Gray colour texture images are used for analysis. The program was coded in MATLAB (implemented on P5 1.6GHz with 2GB RAM computer) for computing the Eigen values of textures which is an efficient tool for computational analysis [17,18] |
THEORY: COMPUTATION OF EIGEN VALUES |
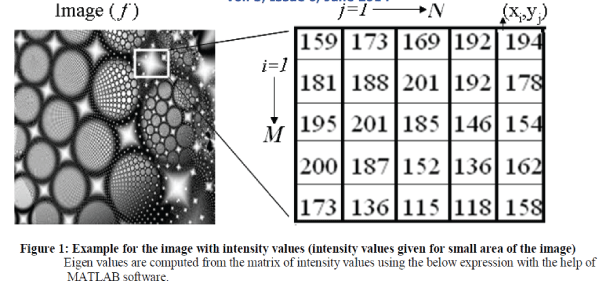
| Eigen value analysis is applied to textures of liquid crystal which in the form of two dimensional matrix and the elements of matrix are image intensity values. As a function of temperature, Maximum Eigen values computed from the textures of FLCs are used to identify the phase transition temperatures [19-21]. This includes the mathematical concepts [22-24]. |
| An image f is of size M-by-N and it is composed of M pixels in the vertical direction and N pixels in the horizontal direction, i, j are horizontal and vertical co- ordinates of the image shown in Figure 1. The total number of pixels in the image is M*N =N. 0 ïÃâã i ïÃâã M,0 ïÃâã j ïÃâã N . Eigen values of the textures are computed as follows. |
 |
 |
RESULTS AND DISCUSSION |
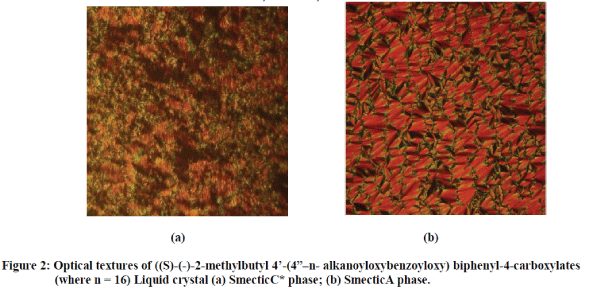
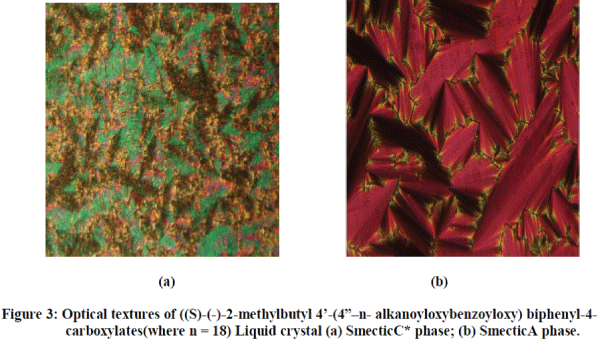
| Textures of the ((S)-(-)-2-methylbutyl 4’-(4”–n-alkanoyloxybenzoyloxy) biphenyl-4-carboxylates (where n = 16 and 18) liquid crystals are recorded using POM as a function of temperature. Ferroelectric liquid crystals exhibited the typical textures of smectic phases (Smectic C*, Smectic A). The textures of the samples are recorded at the heating / cooling rate of 0.20C per minute from the solid phase of the sample to isotropic phase (I) on heating and reverse on cooling from isotropic phase to solid phase. Generally when observing liquid crystals using polarized optical microscopy it is not good practice to examine the samples on heating because the number of paramorphotic defects in the lower temperature phase (collapse of the crystal) will inherited in to the preceding liquid crystal phase. Therefore, textures analysis can easily assign on cooling process when compared with heating from the crystal. |
| On heating and cooling, the samples exhibited the non-tilted (Smectic A) and tilted (Smectic C*) smectic phases. These FLCs undergoes a phase transitions from crystalline phase to the isotropic phase via Smectic C*, Smectic A, i.e., Cr – Smectic C*, Smectic C* - Smectic A, Smectic A – Isotropic (I) on heating and reverse on cooling. But, on cooling with in the crystal phase given FLCs exhibits the two sub phases of Crystal 1 ( Cr1), Crystal 2 (Cr2) , i.e., I – Smectic A, Smectic A – Smectic C*, Smectic C* - Cr2, Cr2 – Cr1. Textures of the samples are shown in Figures 2 and 3. |
 |
 |
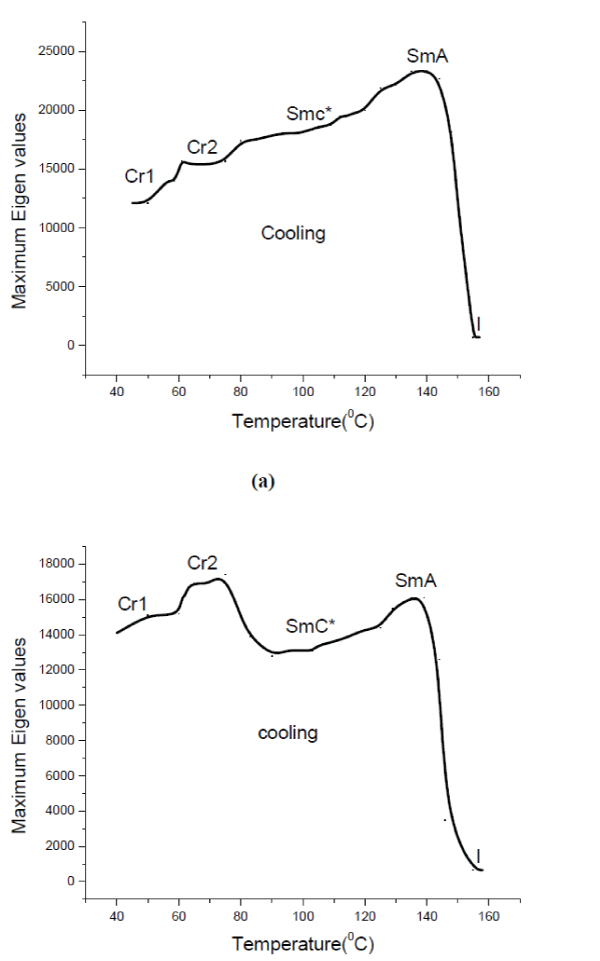
| Transition temperatures of the samples obtained from the POM are confirmed by using Eigen value analysis of liquid crystal textures in addition to the DSC. Eigen value analysis play an important role in situations where the textural transformations takes place. Maximum Eigen values represent the textural feature information effectively [19,20]. As a function of temperature, textures of the compounds are recorded from the solid phase of the sample to the isotropic liquid phase through crossed polarizer’s of POM with hot stage and camera attachment. Eigen values of the textures are computed using MATLAB Software. Once the Eigen values are computed, the plots are drawn for maximum Eigen value of the textures as a function of temperature and are shown in Figure 4. |
 |
| (b) |
| Figure 4: Computed Eigenvalues from the textures of ((S)-(-)-2-methylbutyl 4’-(4”–n-alkanoyloxybenzoyloxy) biphenyl-4-carboxylates as a function of temperature where the phase transitions are indicated. (a) for n = 16; (b) for n =18 |
| The significant variations in the Eigen values indicate the consequent changes in the textural features with respect to temperature due to the phase transition of material. The transformations of image intensity values bring the variations in the textural features roughness, randomness, colour, brightness etc. which are useful to compute the desired parameters. Eigen value of the textures remains approximately constant when there is no change in the textural features like isotropic phase or solid phase, once the phase transformation takes place from solid phase to the liquid crystal phase or liquid crystal phase to the isotropic phase changes in textural features at specific temperature brings the abrupt variations in the eigen value curves. In general, as a function of temperature the changes in the characteristics of the textures occurred while passing a phase transition. Therefore, the temperature corresponds to the distinctive and abrupt change in the Eigen value curve gives the transition temperature of sample [25-29]. The behaviours of the curves are different for different compounds and are shown in Figures 4. This is due to the variations in the textural feature transformations with chain length varying from n = 16 and 18. Transition temperatures and the enthalpies associated with liquid crystal phase transitions are determined by DSC of FLCs support the occurrence of transitions, vice versa obtained from the POM and eigen value studies [9]. |
| In DSC, changes in enthalpy values for the second order transitions was relatively small and are not observable like first order transitions [3,8]. This was shown in Figure 5 for the ferroelectric liquid crystal ((S)-(-)-2- methylbutyl 4’-(4”–n-alkanoyloxybenzoyloxy) biphenyl-4-carboxylates (where n = 16). |
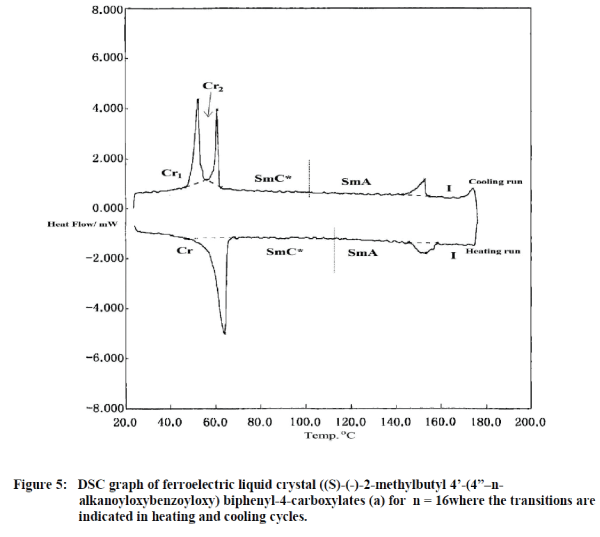 |
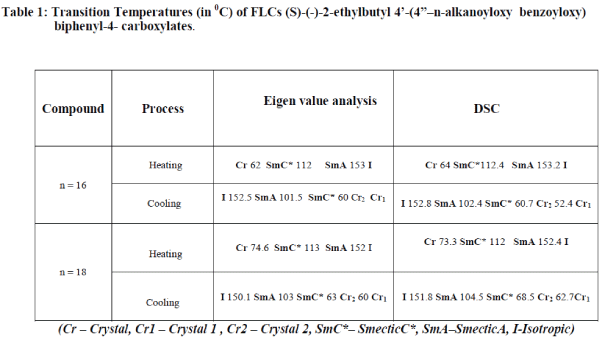
| Compared to the DSC, Eigen value analysis is more sensitive to represent the second order transitions and is shown in figures 4 and 5 . This is due to the fact that while passing the phase transitions including first and second, textural feature information are represented effectively using largest Eigen values. From this we can say that eigen value analysis are useful to investigate the smooth transitions of liquid crystals. The phase transition temperatures obtained from the present study are shown in Table 1 along with the values in the literature for comparison [9,10]. |
 |
CONCLUSION |
| The Eigen value analysis consisting of liquid crystal texture processing is successful in determining the phase transition temperatures of the FLCs. Techniques mentioned in literature are relates to heat energy, heat flow and enthalpy values, but this technique depends on gray level intensity values of the textures and their changes. The results obtained from the present methodology are compared with the other standard technique like DSC and are reasonably in good agreement and second order transitions involved in the lower enthalpies are also identified using eigen value analysis. |
ACKNOWLEDGMENT |
| The authors gratefully acknowledge University Grants Commission Departmental Research Scheme at Level III program No. F.530/1/DRS/2009 (SAP-1), dated 9 February 2009, and Department of Science and Technology -Fund for Improving Science and Technology program No. DST/FIST/PSI –002/2011 dated 20-12-201, New Delhi, to the department of Physics, Acharya Nagarjuna University for providing financial assistance. S.T. Ha wishes to thank Universiti Tunku Abdul Rahman for a grant from the UTAR Research Fund (6200H10). |
References |
|