ISSN ONLINE(2319-8753)PRINT(2347-6710)
ISSN ONLINE(2319-8753)PRINT(2347-6710)
| Dr. Vennapu LakshmanaRao Assistant Professor (C), Department of Meteorology & Oceanography, Andhra University, Visakhapatnam, India |
| Related article at Pubmed, Scholar Google |
Visit for more related articles at International Journal of Innovative Research in Science, Engineering and Technology
An episode of slowest dilution is defined as the continuous period during which no dispersion occurs and mainly depends on the flowing parameters. The aim of this study is the events of meteorological episodes and the atmospheric conditions resulting in slowest dilutions are important, especially over urban areas. In general the occurrence of fog, mist and haze near the coast is very common which an indicator of stagnant conditions is in general. The information may be utilized as a meteorological tool for proper guiding to both residents as well as industrialists. It is interesting and also worth mentioning here that the episode’s of the slowest dilutions were occurred on the month of March and June. The climatology of air flow reveals that the east- south – east in January, south – south – west in April, southwest in August, northwest in October are found in the most predominant wind directions. The highest wind speed is about 6m/s in normal conditions and found to be high in April and August.
Keywords |
| Pollution dispersion, urban area, Fog and Mist, Industrial area, and Climatology. |
INTRODUCTION |
| This information is useful connection with the applications of models of atmospheric transport and dilution that are being developed and used to appraise emission control strategies, including those for achieving air quality standards. This analysis presents data on the slowest dilution that is the worst stagnation episodes lasting 1, 2, 3, 4, and 5days.To achieve this, both the daily afternoon and morning mixing depths and the corresponding wind speeds are considered. According to Holzwarth (1974), episodes of limited dilution were defined as continuous periods of specified minimum duration during which specified values of daily morning (denoted here after as morning) mixing depth (H) and the layer average wind speed (U i.e., the average wind speed within the corresponding mixing layer) were not exceeded the specified limits. Significant precipitation should not occur during the period. Those episodes of more limited dilution were analyzed as described herein to determine the one occurrence of slowest (or most limited) dilution for each time period. |
| The determination of the slowly dilution episode is mainly based on the fact that the product of H x U can be interpreted in square meter per second (m2/s), it represents the volumetric rate per unit distance normal, to the wind direction, that is, m3/s-m at which clean and polluted air within the mixing layer is transported across the upwind and downwind sides of a city. The smaller the values of H x U, the slower is the rate of dilution of pollutants within the urban mixing layer. The synoptic conditions associated with most of these episode’s were high pressure systems at the station region characterized by clear skies, low wind speeds and quite often the condition encouraging subsidence on a wide scale. Such conditions do occur favorably during winter season, December through February. The one day episodes associated with very low ventilation factors seems to be very important in view of the meteorological potential for air pollution provided there are agencies to discharge a large amount of pollutants into the atmosphere. Whereas the episodes of longer duration are generally associated with longer ventilation factors and thus provides situations which may give rise to not those serious pollution episodes even though they may survive for longer periods. In general the occurrence of fog, mist and haze near the coast is very common which an indicator of stagnant conditions is in general. On occasions the intense fog, mist and gaze may react with the existing active pollutants and can create acidic products. |
METHODS AND MATERIALS |
| Daily afternoon and morning mixing depth and the corresponding horizontal wind speed data for a period of five years (August 2008 through 2013) have been analyzed to determine the episodes of slowest dilution lasting 1, 2, 3, 4 and 5 days over Visakhapatnam station. Corresponding dates and meteorological data are given for each episode. The information is useful in modeling and appraising atmospheric transport and diffusion during an episode of extremely slow dilution. An episode of slowest dilution is defined as the continuous period during which no dispersion occurs and mainly depends on the flowing parameters. |
| • All values of H and U, respectively, were less than or equal to Hi= 250, 500, 750, 1000, 1500, 2000 or 3000m. |
| Ui= 2.0, 4.0, 6.0, or 8.0 m/s and Hi x Ui was a minimum. Values of Hi and Ui for such a minimum are designed as Hl, and Ul. |
| • The episode average of individual morning and afternoon values of H x U was the smallest. |
| • Significant precipitation did not occur. |
RESULTS AND DISCUSSION |
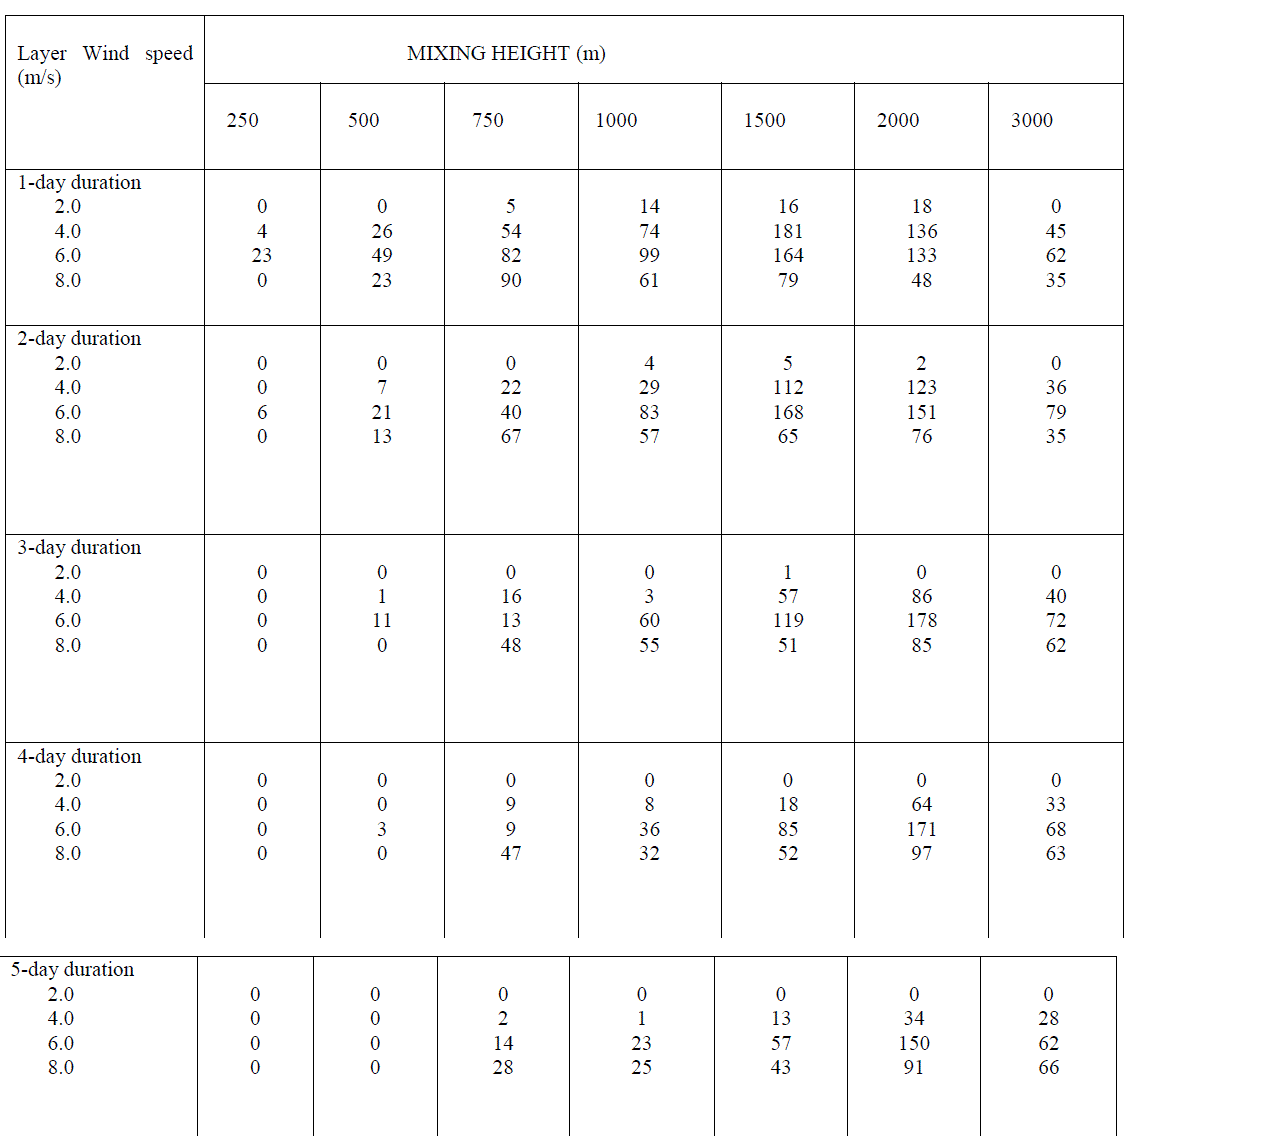
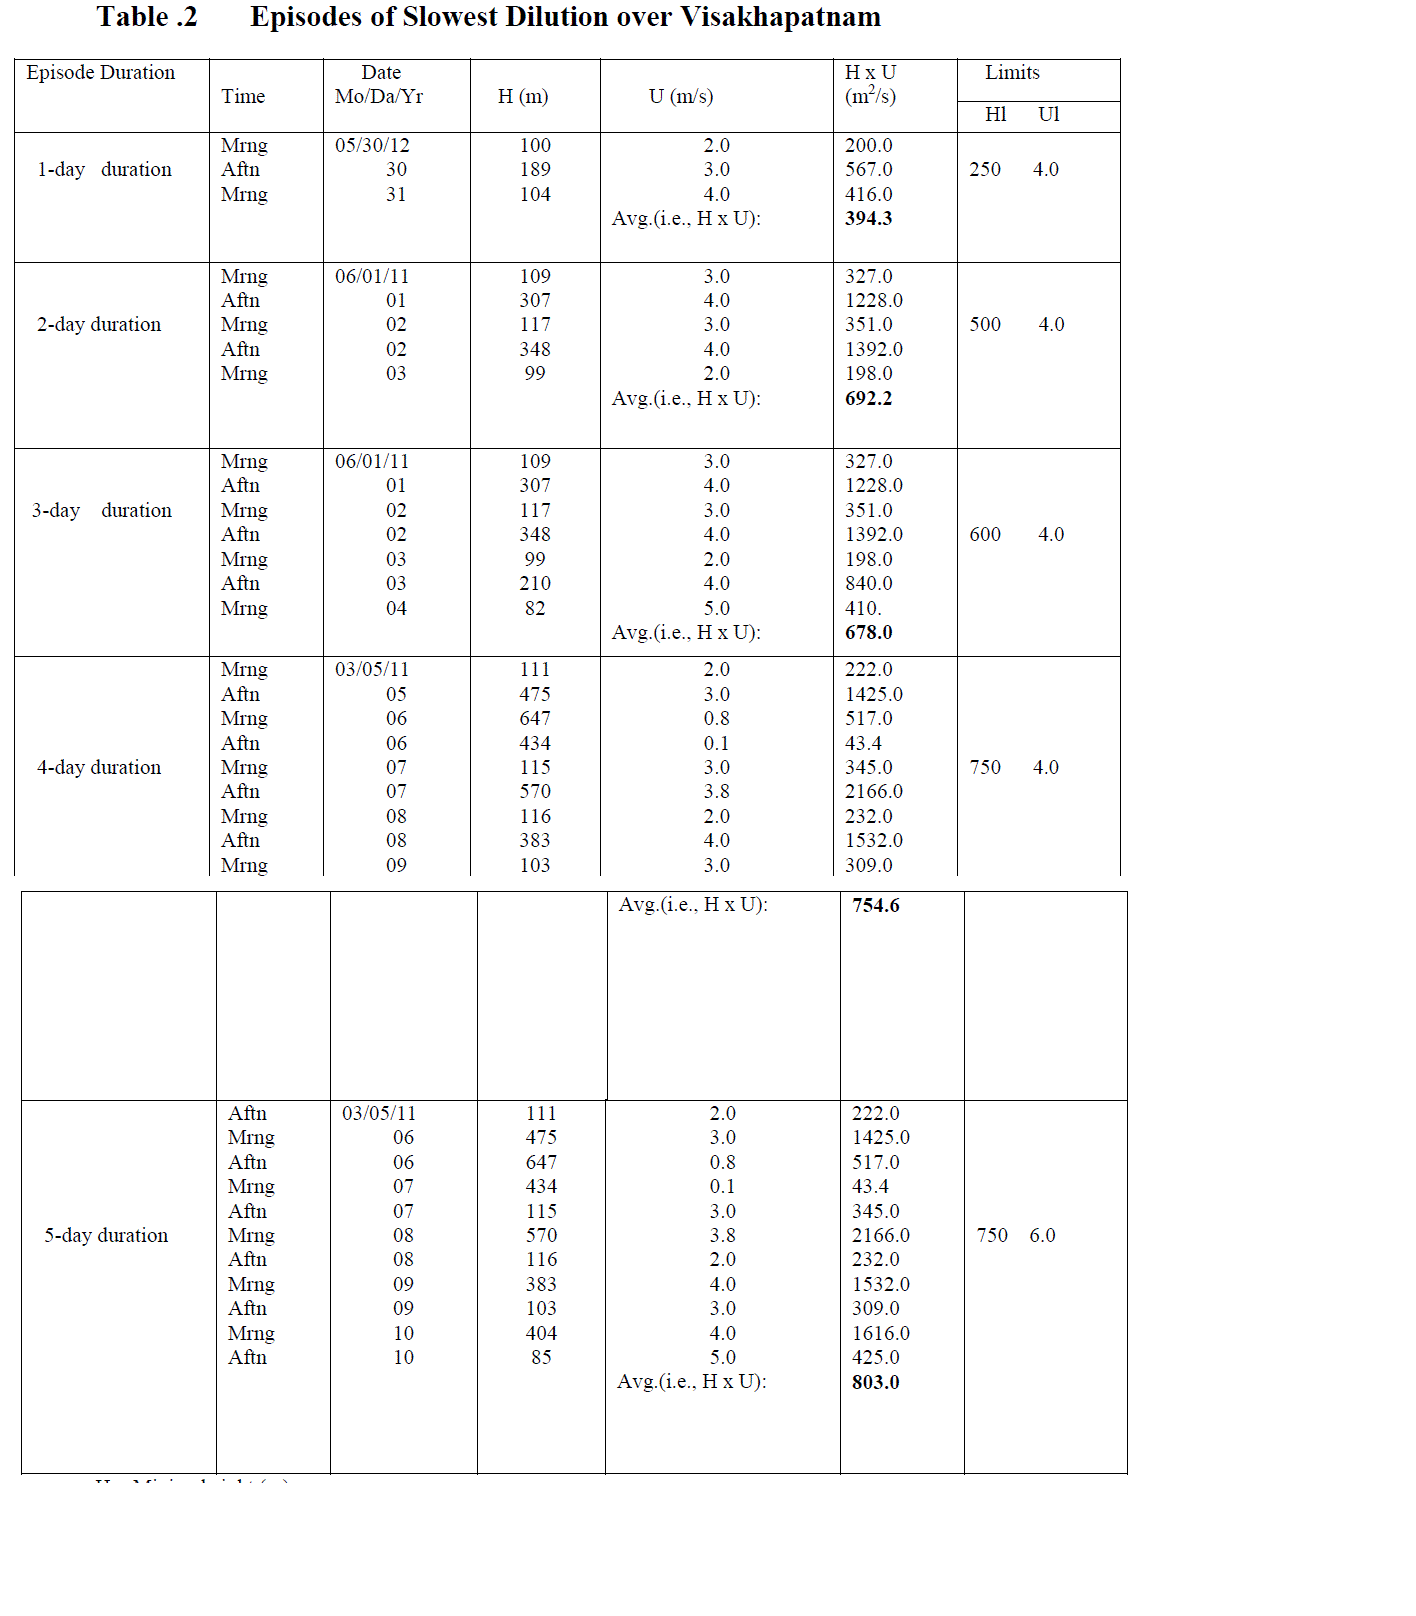
| Daily morning and afternoon mixing depths and the corresponding horizontal wind speeds through the mixing layer from August 2008 through July 2013 calculated in the earlier chapters are consider in this study on the slowest dilution. Further the slowest dilution or the worst stagnation episodes lasting 1, 2, 3, 4 and 5days duration are evaluated and presented in table1 for different limiting values of vertical mixing depth and the horizontal wind speeds through the mixing layer (U). For example, with limiting values of the vertical vigorous mixing depth of 1000m and horizontal wind speed of 4 ms-1 occurred in 74 occasions during the specified 5 years period. Thus the table gives an idea about the occurrence of the total number of episodes within in the designated limiting mixing depths and wind speeds. Holzworth (1974) calculated the episodes of slowest dilution for 62 stations for a period of 5 years in the United States of America and found episodes in the limiting values of Hl, 250m and Ul 2ms-1. Results of Holzworth indicated that 29% of the stations recorded the episode events in these limits. In case of Visakhapatnam during the study period, no episode was found in these limits. In table 2 among the events of episodes specified in table 1, the lowest ventilation (H x V) value with the corresponding mixing depth and the wind speed for all the five episode duration were presented. In this table, column 1 depicts the episode duration. The second column represents episode time. The respective month, date, and year were shown in column 3. With the aid of the table 1 in all the one day through 5-day duration in the lower limit of mixing depth 250m, no episode is found except in 1– day duration with a wind speed limit of 4.0 ms-1 and 6.0ms-1 with 4 and 23 events respectively. It is also worth mentioning here that even though the total numbers of events are 4 and 23 respectively in the lower limits, the mixing depths are above 100m and the average wind speed through the mixing layer is 3 ms-1. |
| In 2 – day duration in the mixing limit of 250m and wind speed of 6.0ms-1, only 6 events were present. However, there are relatively higher ventilation values with more than 443 m2s-1. The total numbers of the individual events were less than 100 for the mixing depths of below 1000m in all categories of wind speeds and duration; Most of the episodes were noticed in the limits of 1500m and 2000m. A gradual decrease in episode events was also found after 2- day duration except in few cases within the mixing limit of 500m. The higher numbers of events of episodes (181) were recorded in 1 – day duration in the limits of mixing depth of 1500m and 4.0ms-1 wind speed. Most of the occasions in all the durations pertaining to 2ms-1 wind speed limit showed zero values. For both 4 day and 5 day duration, no episode were present both in the mixing limits of 250m and 500m with all the wind speed limits except in 4- day duration with Hl, 500m and Ul, 6ms-1.It is an important point to note that the highest numbers of episode events are above the mixing depth limit of 1000m which signifies the non severe episodes over the station. However, it should not be disregarded, and care should be taken while discharging the higher pollutant concentrations even in such episodes. During summer season, 30th May of 2012 bags the worst dilution of one day duration with 394.3 m2 s-1 in the limiting values of 250m and 4.0ms-1. In addition to this, the same day and month of 2011 had shown the ventilation value of 443 m2s-1 in the limiting values of 250m and 4.0ms-1. With these two lowest values of episode days occurred, one may infer that a peculiar phenomenon observed during summer season over Visakhapatnam with lower mixing depths leading to the worst stagnant condition. June 1st, 2011 recorded the second and third worst stagnant conditions occurred with 692.2 m2s-1 respectively. It may be due to the stand still condition prevailed after a significant precipitation. The synoptic wind is such situation inhibits the sea breeze condition. These conditions were also verified with the synoptic conditions from Indian Daily Weather Report (IDWR) published by the Indian Meteorological Department. |
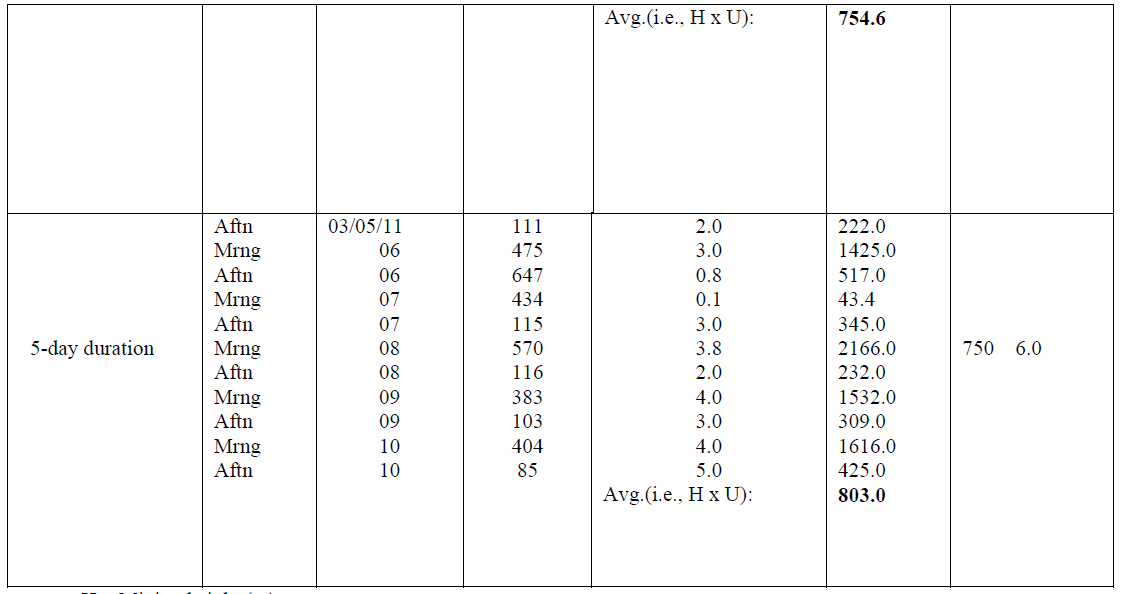
| The synoptic condition from 5th to 10th March 2011 showed clear sky conditions and formation of haze at 0000 GMT over the station representing the stability of the atmosphere. This may result the worst stagnation condition during the period. The same conditions were also noticed on other episode days. The occurrence of haze in the early morning hours can be attributed to the radiative cooling associated with clear night skies. In 1, 2 and 3- day duration, on many occasions the clear skies, severe heat wave conditions and frequent haze formation were also noticed over the station. Hence, it can be concluded that these synoptic situations support the stable atmospheric conditions leading to events of meteorological episodes. The information may be utilized as a meteorological tool for proper guiding to both residents as well as industrialists. The 5th March 2011 has stood since 5 –day episode with 803.0 m2s-1 (H xV) value in the limiting values of mixing depths 750m and wind speed 6.0 m/s. A nearer value of 914.9 m2 s-1 was also noticed on 19th March 2013 (not shown in the table) in the limiting values of mixing depths 750m and wind speed 4.0 ms-1. With this information one can infer that the events of slowest dilution were noticed during March and May in summer season and during of June of monsoon season. In general, during summer pronounced vertical Turbulence is common and in monsoon season convective activity and horizontal dilution are vigorous. But over the station, the lower mixing depths during summer and stable conditions in June may lead to these episode events. Higher ventilation coefficients due to large horizontal winds are common during monsoon season. However it is interesting to note that Visakhapatnam recorded the lowest dilution in summer and monsoon months. This is contrasting feature compared to other inland stations in the country where the days of lowest dilution may occur in winter and the dilution is maximum in summer season (Satyanarayana, 1988). Visakhapatnam has its own identity having lowest dilution in summer season. This may be due to the persisting inversion conditions caused by means of flushing action due to the local circulation. This fact was corroborated even in the study of mixing heights over Visakhapatnam where the lowest mixing depths were recorded during summer season. Further it is important to mention here the months April through August are more favorable for horizontal dispersion and dilution of pollutants that in view of morning and afternoon average wind speeds. But when analysis if the episodes of slowest dilution is made, it is necessary to consider the daily data while concluding the dispersion strategies for short term analysis. |
SUMMARY AND CONCLUSIONS |
| In general March and June are recorded large mixing depth due to intense solar radiation. Further the month of June records significant horizontal dilution caused by large wind speeds. In spite of this general observations found, the slowest dilution was recorded in these months. It is because of the mixing depths which were shallow during summer due to persistence of elevated inversions. Further, in June the stand still condition leaves the atmosphere stable conditions. Thus this region in these two months leads to slowest dilution and air pollution episodes. Such details will not appear in a seasonal or annual average picture. This manifests clearly when the analysis was done daily basis. While discharging higher concentration of pollutants, these months should be considered as peculiar. Winter and post monsoon seasons are favorable for vertical dilutions. Control techniques such as usage of scrubbers, electrostatic precipitators etc. can be applied to reduce the air pollution concentrations at the source itself. When an inversion is prevailed near the ground surface, in order to overcome the downwind concentrations the heat input (energy) to the plume should be raised. In order to evaluate the pollution concentration one has to use daily, hourly data for accurate results. |
| The computational method is found to be easy and accurate in comparison with the T Р̉̉ gram procedure. June through October months are influenced by the southwest monsoon, in this eastern coastal city. So the pollutants will be transported towards north east sector as the prevailing wind is southwesterly. The pollutants are transported directly to highly pollute residential areas as the industries are located in the southwest portion of the city. In conclusion, it can be suggested that the northeastern part of the city seems to be favorable for setting up of new industries, so that the concentrations in the residential sectors will be minimized, as the pollutants will be transported towards the sea. South east part is the second best choice for the establishment of the residential sectors. It is also advisable to establish the new industries in the north east sector so that the pollutants spread, is either in the ocean or in the direction of northeast of the city. |
 |
 |
 |
| H = Mixing height (m). |
| U = Wind speed averaged through H. |
| In calculations of H x U, values of U = 0.0m/sec are treated as 0.1 m/sec. |
| Limits = limiting values of H and U used to define episodes. |
| No = Total number of episodes with these limits. |
References |
|