International Journal of Innovative Research in Science, Engineering and Technology
ISSN ONLINE(2319-8753)PRINT(2347-6710)
ISSN ONLINE(2319-8753)PRINT(2347-6710)
| M. VivekPrabhu, R. Karthick, Dr.G. Senthil Kumar Department of Mechanical Engineering, Anna University, Velammal College of Engineering and Technology Madurai, Tamil Nadu, India |
| Related article at Pubmed, Scholar Google |
Visit for more related articles at International Journal of Innovative Research in Science, Engineering and Technology
Recent developments in engineering optimization allow choosing the best input values thereby enhancing the effectiveness of any equipment. Overall Equipment Effectiveness (OEE) is a performance measure which employs factors such as availability rate, performance rate and quality rate to determine the efficiency of a manufacturing system. In this paper, Overall Equipment Effectiveness (OEE) is optimized using Genetic Algorithm to achieve the best utilization of the plant resources. The availability rate of the machine, performance rate of the machine and quality rate of the products are considered as parameters while maximizing the Overall Equipment Effectiveness (OEE) of a manufacturing system. It is found that the lagging in performance rate contributes more than availability rate and quality rate that deficiency of effectiveness in the system. It is concluded that maintaining the performance rate above 95% will result in effective utilization of the considered manufacturing system.
Keywords |
| Optimization, OEE, MTBF, MTTR, etc. |
INTRODUCTION |
| Efficiency and effectiveness are buzzwords in today’s competitive market. Greater the efficiency and effectiveness, more productive is the organization. Overall equipment effectiveness is such a performance measure, which indicates current status of production with least calculations. It also helps to measure losses and corrective actions can be taken to reduce it. Effective utilization of Man, Machines, Material and Methods will result into higher productivity. |
| Overall Equipment Effectiveness (OEE) is a product of three important parameters, Availability (A), Performance Rate (PR) and Quality Rate (QR). When higher productivity is expected the machine tool which are converting raw state of the product into finish goods, must be reliable. Reliability includes availability of the machines with least down time. If mean time between |
| failures (MTBF) is more, it indicates machines are available for its desired performance. Attempt must be made to reduce mean time to repair (MTTR) and improve MTBF. It requires failure data analysis and root cause analysis. The failure data collected will help us to calculate availability (A) of equipment. |
| OEE = A * PR * QR |
| MTBF = Total breakdown time / Number of occurrence MTTR = Total repair time / Number of occurrences |
| Availability = MTBF / (MTBF + MTTR) |
| Performance Rate = (e * ts) / Actual operating time |
| Quality Rate = (Output - Rejected) / Output |
 |
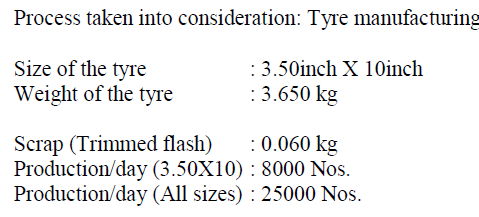
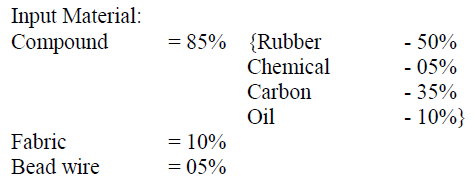
| OEE is a measure of machine capability. It indicates where scope of improvement. Statistical data collected from tyre manufacturing process results into useful information for improvement area. |
| Nakajima (1988) introduces OEE in Total Productive Maintenance. Researchers have noted that this definition varies with different processes. A.J. de Ron and J.E. Roda modified OEE by introducing operational efficiency (OE) and rate efficiency (RE) in performance rate. [2] Tom Pomorski[8] of semiconductor industry, USA defines OEE in terms consistent with SEMI E-10-96. OEE as one element of which measures the performance of equipment, but can OEE measures the performance of the entire manufacturing process. The productive metric standard proposal defines variations of OEE as production OEE, demand OEE, simple OEE and cluster tool OEE. P. Muchiri and L. Pintelon[3] evolve OEE as tool to track improvement and enlarge this tool with different terminologies. Such as at equipment level production equipment effectiveness (PEE) and total equipment effectiveness performance (TEEP) at factory level, overall factory effectiveness (OFE) and overall plant effectiveness (OPE).[2][3] |
II. METHODOLOGY USED |
| It is observed that various parameters of OEE, contribute to overall OEE in a different manner has significant effect on improving the performance. In this paper, Regression modeling of the parameter is done to find the significant contributor. Based on these results, Genetic Algorithm is employed to optimize the Overall Equipment Effectiveness (OEE) of a manufacturing system. |
| Literature review in the field of overall equipment effectiveness shows that there is strong need of performance measurement system. It indicates to reduce down time losses, speed losses for performance improvement. |
 |
| Where |
 |
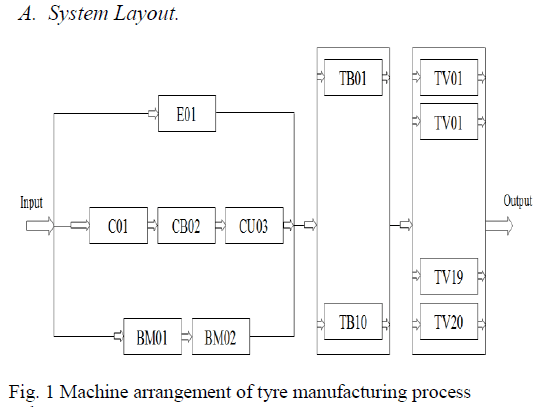
III. DATA COLLECTION |
|
|
IV. CALCULATION OF OEE & OEE FACTOR |
A. Availability Rate Calculations. |
 |
B. Performance Rate Calculations. |
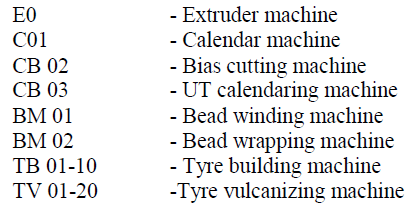
| In performance rate, from processing time of machines, the bottleneck machine has been found to be E-01 (Extruder machine). |
| Here, the actual operating time accounts per day |
| Actual operating time = 8*60*3 = 1440 Minutes |
| Where, 8 mention the number of hours per shift 60 mention the number of minutes per hour 3 mention the number of shifts |
C. Quality Rate Calculations |
| Quality Rate = (Output - Rejected) / Output |
| = (8010 – 7946) / 8010 |
| = 0.9920 |
| Quality Rate = 99.2% |
 |
| TABLE III PERFORMANCE RATE CALCULATION |
 |
 |
| From above OEE calculation, performance rate of all the machines are poor except Extruding machine. That is below 95%. Above 95% is considering as a better performance of a machine. |
V. PROBLEM IDENTIFICATION |
| From above OEE calculation, performance rate of all the machines are poor except Extruding machine. That is below 95%. Above 95% is considering as a better performance of a machine. |
| Here we need to increase the performance rate for each machine. Genetic algorithm is used to optimize the performance rate for each machine. Solve XL an excel Add-Ins for Genetic Algorithm is used to optimize the OEE values. |
| The following are the expected values for each OEE factors |
| Availability ≥ 90 % |
| Performance Rate ≥ 95 % |
| Quality Rate ≥ 99.9 % |
VI. SOLUTION |
A. Genetic Algorithm. |
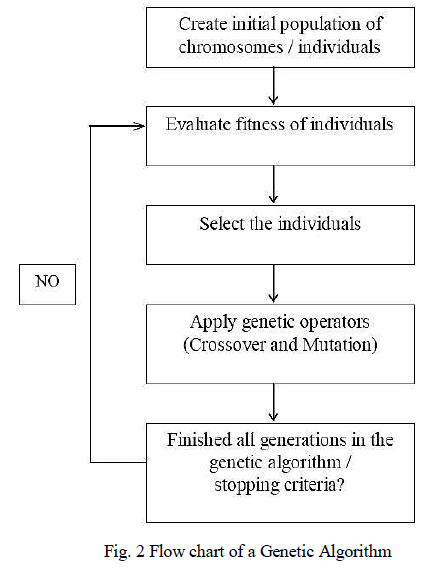
| An algorithm is a set of instructions that is repeated to solve a problem. A genetic algorithm conceptually follows steps inspired by the biological processes of evolution. Genetic Algorithms follow the idea of SURVIVAL OF THE FITTEST- Better and better solutions evolve from previous generations until a near optimal solution is obtained. Also known as evolutionary algorithms, genetic algorithms demonstrate selforganization and adaptation similar to the way that the fittest biological organism survive and reproduce. A genetic algorithm is an iterative procedure that represents its candidate solutions as strings of genes called chromosomes. The basic schematic of Genetic Algorithm is shown in the below flow chart. |
 |
| The solutions are given below for the better performance of an each machine. While optimizing the Overall Equipment Effectiveness (OEE), the calculated values are considered as a minimum value and expected values are considered as a maximum value of OEE. The below table shows the optimized values of OEE. It is done by Solve XL. To optimize the value of OEE, the Genetic Algorithm is used and optimized values are merged in an Excel sheet for each machine. |
B. Optimized values of OEE by GA. |
 |
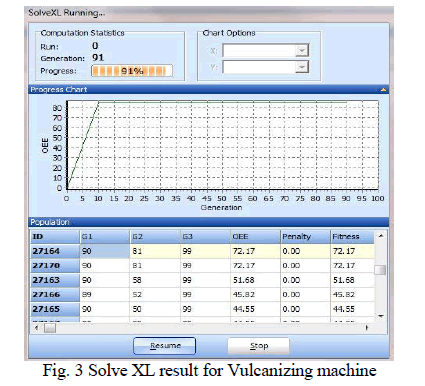 |
| The above is results of Vulcanizing machine done by solve XL. G1, G2 and G3 are Availability rate, performance rate and quality rate. |
VII. CONCLUSION |
| As OEE is an important performance measure for effectiveness of any equipment, careful analysis is required to know the effect of various components. A excel sheet can be used as simplest tool to measure and monitor true data collection. An attempt has been done in this study to optimize the OEE by using Genetic Algorithm (GA). This study indicates that OEE will be significantly improved if focus is given on performance rate improvement. To achieve the OEE of 84.645%, optimized values are Availability 90%, Performance Rate 95% and Quality Rate 99%. Simulated values of above scenario will add more valuable information to industry. |
References |
|