ISSN ONLINE(2319-8753)PRINT(2347-6710)
ISSN ONLINE(2319-8753)PRINT(2347-6710)
D.Mahadevi 1, M.Manikandan2
|
| Related article at Pubmed, Scholar Google |
Visit for more related articles at International Journal of Innovative Research in Science, Engineering and Technology
Tungsten inert gas welding process is a multi-input and output process in which the resultant joint strength is governed by both individual and combination of process parameters. The identification of suitable combination parameter is crucial to get desired quality of welded joint and hence, there is need for optimization of tungsten inert gas welding process to achieve a sound weldment. The present work is based on the TIG welding process parameters on welding of AZ61 magnesium alloy. The design of experiment is done by Response surface methodology techniques to find the desired welding conditions for joining similar AZ61 magnesium alloy material. Analysis of variance methods were applied to understand the TIG welding process parameter. The considered parameters are welding current, welding speed, arc voltage, electrode stick out, while the desired output responses are tensile strength and percentage elongation of the welding joints. From the results of the experiments, mathematical models have been developed to study the effect of process parameters on tensile strength and percentage elongation. Optimization is done to find optimum welding conditions to maximize tensile strength and percentage elongation of welded specimen.
Keywords |
| TIG welding, AZ61 magnesium alloy, analysis of variance, regression analysis. |
INTRODUCTION |
| In recent year, magnesium alloys have attracted great attention in academic, due to their low density and reduction of weight, high specific strength, stiffness, merchantability and recyclability. Especially for the automobile industry, weight saving effect of replacing steel and aluminium parts with magnesium alloy is an important factor in reducing fuel consumption. [1] Magnesium is the lightest of all the engineering metals, having a density of 1.74 g/cm3. It is 35% greater than aluminium (2.7 g/cm3) and over four times lighter then steel (7.86g/cm3) [2]. AZ61 magnesium alloy widely used in automobile parts. Different parts of automobile vehicle such as seat frame, steering column housing, lock body and driver air bag housing are attached together by welding [3]. Therefore several type of welding method such as tungsten inert gas (TIG), arc welding, laser beam welding [LBW], and friction stir welding [FSW] have been applied to the welding of magnesium alloy [4]. Compared with other welding method, TIG welding techniques is the quality and performance of welding parts is highly dependent upon the welding process parameters [5]. Thus, many researchers have already applied DOE to optimize welding parameters, but no efforts is yet made to perform this optimization on gas tungsten arc welding of AZ61 magnesium alloy using RSM. This study is focused on the RSM optimization of some crucial welding parameters namely welding current, welding speed, and arc voltage, to achieve most favorable mechanical properties. |
| In welding processes, the input parameters influence the mechanical properties of welded joints. Various optimization methods can be applied to define the desired output variables through the development of mathematical models to specify the relationship between the input parameters and output variables. One of the widely used methods to solve this problem is the response surface methodology (RSM), in which the experimenter tries to approximate the unknown mechanism with an appropriate empirical model. A few investigation of the effect of TIG welding process parameters and optimization on mechanical and metallurgical properties of aluminium alloy have been reported [5,6]. Very countable number of studies on optimization of pulsed current gas tungsten arc welding process parameters to attain maximum tensile strength in AZ31B magnesium alloy [7]. However there is no information available in open literature on prediction of optimum tungsten inert gas arc welding process parameters to attain maximum tensile strength in AZ61 magnesium alloy joints. Hence, in this investigation an attempt was made to develop an empirical relationship to predict tensile strength of TIG welded AZ61 magnesium alloy joints using statistical tools such as design of experiments, analysis of variance and regression analysis. |
II. MATERIALS AND EXPERIMENTAL PROCEDURES |
A. Material |
| The extrude plate of 6mm thickness, AZ61 magnesium alloy were cut to the required dimension (150mm ×200mm) by power hacksaw cutting and milling. The initial joint configuration was obtained by securing the plates in position to mechanical clamp. The direction of welding was normal to the rolling direction. Argon (purity 99.99%) was used as shielding gas. |
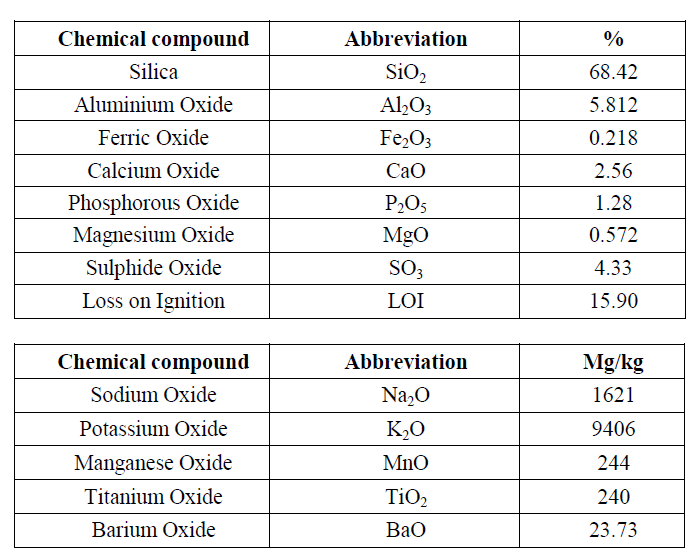
| The welding rod was used an ESAB.SAI, 3.15mm diameter with electrode to be working angle 30o. The chemical composition and mechanical properties of the base metal are listed in Tables 1 and 2, respectively. |
B. Welding procedure |
| Twelve pairs of specimens were TIG arc welded based on parameters designed by software Minitab 16. The welding current and arc voltage were measured by using an ammeter and voltmeter. The setup used during the experiments includes shielding gas regular, welding machine was carried out and weld the part by using welding gun and travels with the desired constant speeds along the plates. Each butt weld was formed by three passes of TIG, one over the other. Single butt weld (welded from both sides) preparation was used. Fig. 1shows a schematic representation of the weld joint preparation that was performed by machining. To calculate travel speed, welding length was divided by the welding duration (cm/min). Direct current electrode negative (DCEN) was used preheating and inter pass temperature were 250C and 3000C, respectively. |
C. Tensile test |
| Tensile test specimen was prepared in according with ASTM standards, shown in Figure 2 [8]. Tensile test were carried out at a strain rate 0.5 s-1 by load capacity up to 100KN tensile test machine. In order to ensure repeatability of 0.005% tensile strength. Four samples for each condition were tested. |
III. RESULTS AND DISCUSSION |
A. Working limits of parameter |
| A small number of trail run were carried out using 6mm thickness extrude plates of AZ61 magnesium alloy to find out feasible working limits of TIG welding parameters. Different combination of welding parameters was used to carry out the trail runs. The weld penetration, and weld quality were inspected to identify the working limits of the welding parameters, leading to the following observations. |
 |
 |
 |
 |
| If the current is less than 140A, there will be incomplete penetration and lack of fusion. For current greater then 150A, then weld dropout occurred. If the welding speed is lower than 5cm/min, undercut will be observed due to increased heat input. For welding speed greater then 9cm/mm, there will be lack of fusion and lack of penetration. Considering all the conditions above, feasible limits of the parameters were chosen in a manner that the AZ61 magnesium alloy is welded without any weld defects. Among a wide range of parameters, three parameters and three levels of Box – Behnken matrix were selected to optimize the experimental conditions. |
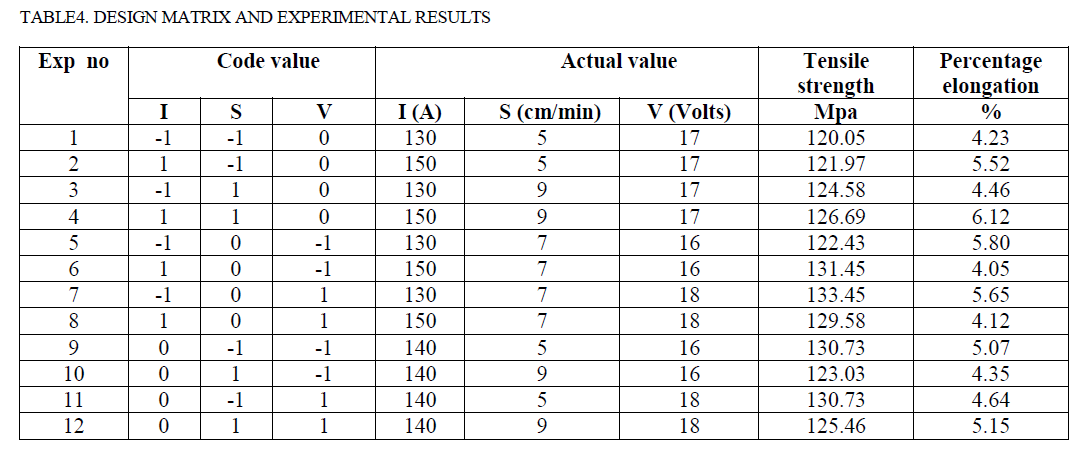
| Table 3 lists the range of selected parameters and Table 4 shows 12 sets of coded conditions used to establish the design matrix. Considering the convenience of recording and processing experimental data, upper and lower levels of the parameters were coded as +1 and -1, respectively. |
 |
| The effects of welding parameters namely welding current, welding speed, arc voltage, tensile strength, percentage elongation. This parameter corresponds to energy by unit of length and is a good parameter that shows the energy transferred during welding. Too low a heat input easily resulted in the presence of welding defects, which seriously decreased the tensile strength of the welded joint. Thus, with an increase of the heat input, the percentage elongation of the welded joints increased. Considering Table 4, an increase of current from 140 to 150 A resulted in an increase of elongation from 4.2 to 5.4 %. Increasing the welding speed results in decreasing the energy transferred and heat input. Consequently, the weld pool is rapidly cooled, in the present study, increasing welding speed from 5 to13 cm/min results in an increase of weld tensile from 120.05 to 133.45 Mpa, as it is shown in Table 4. |
B. Development of an empirical relationship |
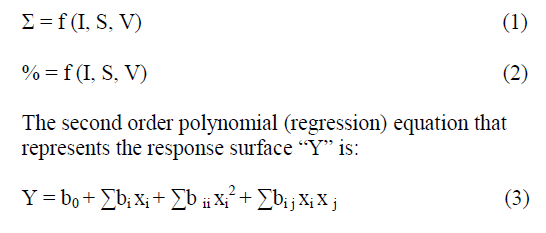
| In this study, the response function of the joint, tensile strength (σ) and percentage elongation (%), are functions of welding current (I), welding speed (S) and arc voltage (v), and it can be expressed as: |
 |
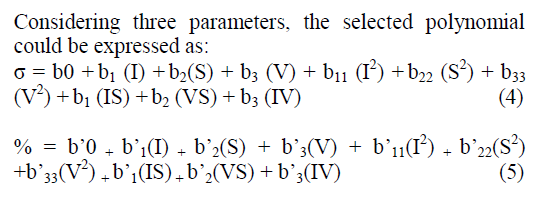 |
| Where b0 and bâÃâ¬ÃŸ0 are the average of responses.bi, bâÃâ¬ÃŸi and bij, bij are the coefficient that depends on the respective main and interaction effects of the parameters. In the present work, Box – Behnken design using the Minitab 16 software package. Following the determination of significant coefficients, the final relationship was developed based on these coefficients. The empirical relationship to predict tensile strength and percentage elongation of tungsten inert gas arc welded AZ61 magnesium alloy was obtained as: |
 |
 |
| Where σ, %, I, V and S are tensile strength (Mpa), percentage elongation (%), welding current (A), welding Speed (cm/min), arc voltage (V), respectively. The interaction of the selected parameters based on Equation (6) – (7) can be summarized as follows: |
| ïÃâ÷ Not only each process parameter influences on the tensile strength and percentage elongation, but also square of each parameter affects the tensile strength. |
| It is noteworthy that all started equations are valid in the ranges mentioned in the section 2.3. This means that putting the values of process parameters into Eqs. (6) and (7), it is possible to predict tensile strength and percentage elongation. |
C. Validation of the developed relationship |
| The adequacy of the developed relationship was tested using analysis of variances (ANOVA). In this technique, if the calculate „FâÃâ¬ÃŸ ratio of developed model is less than the standard „FâÃâ¬ÃŸ ratio (from F – table) at a desired level of confidence (95%), the model is adequate within the confidence limit. The adequate ANOVA test results for one of the response (tensile strength) are presented in table 5 where, DF, Seq SS, Adj SS, Adj MS, F and P Stand for degree of freedom, Sequential sum of squares, adjusted mean square, F – statistic that is a ratio of the between group variance divided by the within group variation, calculated p- value that determines the significance of the test .The purpose of the ANOVA is to investigate which welding process parameters significantly affected the quality characteristics. It is understood that the developed relationship is adequate at 95% confidence level. If values of „prob> F are less than 0.0500, the relationship terms will be considered significant model terms. Values greater than 0.1000 indicate the relationship terms are not significance. |
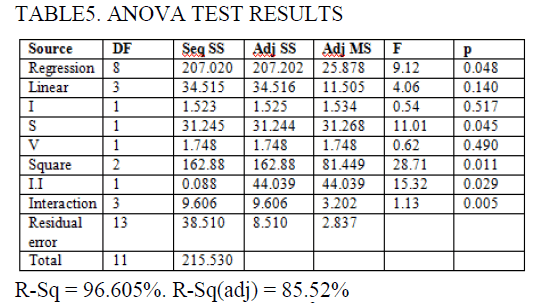 |
| Coefficient of determination „R2 is used to find how close the predicted and experimental values lie. The value of „R2for the weld tensile strength developed relationship is also presented in table 5, which indicates high correlation exists between the experimental and predicted values. The „R-squaredâÃâ¬ÃŸ of 0.9605 is in reasonable agreement with the „adj R-squaredâÃâ¬ÃŸ of 0.8552. Fig.5. (a) Normal probability plot of residuals for tensile strength |
 |
| value and percent is respective cumulative frequency percent. This graph plots the residuals (the difference between the observed and the fitted response value) versus respective cumulative frequency percent. |
 |
| The respective cumulative frequency can be determined as follows: |
 |
| where J is rank order and n is the number of data. If the distribution of residuals is normal, the plot will resemble a straight line. The normal probability plots of the residuals for tensile strength, percentage elongation are shown in fig. 5, which reveals the residuals are falling on the straight line. This indicates that errors are normally distributed and the empirical relationship is correctly developed. |
D. Optimization of GTAW parameters |
| RSM is a technique for the optimization of process parameters. Using RSM plots, it is possible to optimize welding parameters to achieve most favourable percentage elongation and tensile strength. In surface plots, two parameters are shown on X, Y axes and the response is depicted in Z axis, which finally reveals the optimum point. For example, if the maximum value for tensile strength is required, it is demonstrated by the top point of plot. Figs 6-7 show surface plots of tensile strength, percentage elongation, obtained from a regression model at the current of 140 A, arc voltage 7 V, welding speed of 17 cm/min. The top points of surface plots are optimum values. It is maximum value of 133.45MPa can be obtained at the welding, current of 140.75 A, arc voltage 8 V, and welding speed of 9 cm/min. It is interesting to note that empirical experiments under the similar process conditions (table 4) are in good agreement with estimated values. |
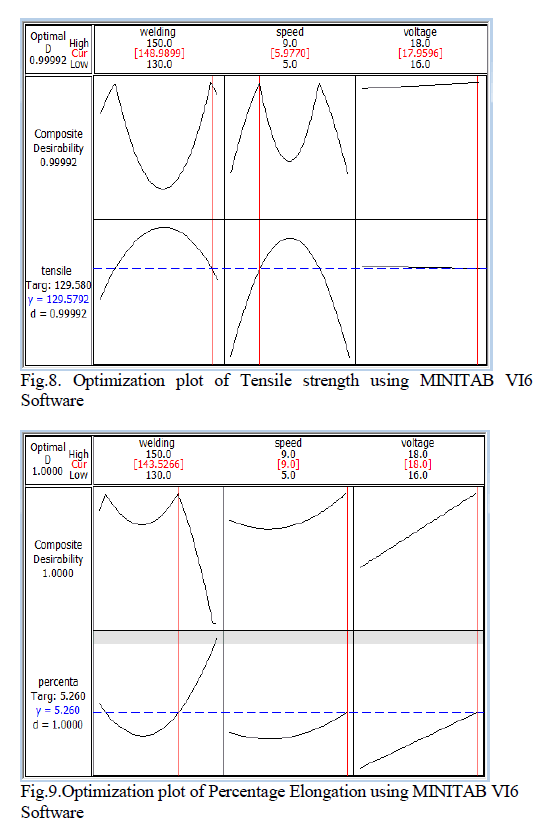
| One of the most important aims of experiments related to welding is to achieve high value of tensile strength and Elongation. The response surface optimization is a technique for determining best welding parameter combination [9-10, 11]. Here the goal is to maximize UTS and % Elongation. RSM optimization result for UTS and % Elongation is shown in Fig 8, 9. Optimum parameters obtained are shown in table |
 |
 |
 |
 |
IV. CONC LUSIONS |
| The effect of TIG welding parameters like welding speed, current and arc voltage, electrode stick out on ultimate tensile strength and percentage elongation in welding of AZ61 magnesium alloy has been studied. Experiments were conducted using central composite design matrix and mathematical models have been developed. From the study it was observed that welding speed has the most significant effect on both UTS and percent Elongation followed by welding current. However gas flow rate has least significant influence on both UTS and percent elongation. Optimization was done to maximize UTS and percent elongation. Predicted properties at optimum condition are verified with a confirmation test and are found within the limits. |
References |
|