ISSN ONLINE(2319-8753)PRINT(2347-6710)
ISSN ONLINE(2319-8753)PRINT(2347-6710)
VIVEKANAND MATHAPATI1, Dr.A R ASWATHA2
|
| Related article at Pubmed, Scholar Google |
Visit for more related articles at International Journal of Innovative Research in Science, Engineering and Technology
Aiming at many monitoring systems focusing on real-time monitoring and so being difficult to more directly and conveniently understand the system performance issues by the data analysis and remote monitoring, this paper presents a system performance monitoring system, as servers being the core position in network, server monitors to the resources of systems and use multi-threading technology to collect data and process them, which can improve the collection efficiency. From the collected data of the system resources, the analysis has been done based on its usage and work load carried out in the system.
Keywords |
| Server Monitoring, Efficiency, Real time monitoring, Remote monitoring. |
INTRODUCTION |
| A resource, or system resource, is any physical or virtual component of limited availability within a computer system. Every device connected to a computer system is a resource. Every internal system component is a resource. Virtual system resources include files, network connections and memory areas, CPU time, Hard disk spaces etc. Proper security and performance monitoring of modern systems farms is a difficult task. While most commercial monitoring solutions do scale to the capacities required for capturing large amount of status data being generated by high throughput server banks, they are weak on the analytic capabilities required to interpret the data in such a way as to implement automatic behaviour. This resource performance analysis is significantly more scalable approach to monitoring system processes. This approach allows us to easily integrate multiple sensor sources and human system administrator analysis to obtain accurate result. Human system administrators often only monitors a small portion of available system data, such as server load, network load, I/O load and intrusion detection data. By combining this information, a human analyst may decide to further investigate the behaviour of any one system/server. Resource data analysis system is a technology that allows quick and easy integration of sensor resources and uses custom build models to detect evidence of occurring processes in the observed environment. There are many conceptual and operational challenges in implementing a scalable and effective server monitoring framework. It is useful to first redefine the issue of scalability in the context of the Resource performance analysis. |
| The scalability at multiple levels in a monitored system must consist of the following qualities: 1. Detection performance 2. Runtime performance of analysis system 3. Sensor performance These qualities should not degrade with increases in the following parameters such as 1. Total number of monitored hosts, 2. Total number and complexity of monitored services per host. |
II. RELATED WORK |
| Christopher Roblee et. al., [1] presents a new server monitoring method based on a new and powerful approach to dynamic data analysis: Process Query Systems (PQS). PQS enables user space monitoring of servers and, by using advanced behavioral models, makes accurate and fast decisions regarding server and service state. The PQS system we use is a generic process detection software platform. It builds on the wide variety of system-level information. Liu Yucheng et. al., [2] focuses on real-time monitoring and so being difficult to more directly and conveniently understand the software performance issues by the historical data analysis and remote monitoring, this presents a server performance monitoring system program based on B/S mode. That system uses B/S mode enables administrators to view the server-side situation in the performance testing and network maintenance. Wenxian Zeng et. al., [3] introduces how to monitor servers through simple network management protocol (SNMP). We expand MIB resources by defining MIB objects to monitor the resources of sever, and use multi-threading technology to collect data and process them, which can improve the collection efficiency. there are two types of network management protocol in computer network management field, which occupy the dominated position. One is common management information protocol and service (CMIP/CMIS), which is proposed by OSI organization. And the other is SNMP, which is put forward by IETF. Forrest et. al., [4] reports a preliminary results aimed at establishing such a definition of self for Unix processes, one in which self is treated synonymously with normal behavior. They showed that short sequences of system calls in running processes generate a stable signature for normal behavior. Nim soft monitor, [5] delivers the essential capabilities that need to proactively monitor and Manage performance. This is a single platform with an extensible architecture that can help in monitoring every system and service that matters. It is an efficient, scalable platform that is use to monitor and manage the following systems and services. Servers such as Windows, Linux, UNIX. Jeffrey et. al., [6] proposed a Autonomic computing is a grand-challenge vision of the future in which computing systems will manage themselves in accordance with high-level objectives specified by humans. Technologies associated with system-level self-configuration, self healing, self-optimization, and self-protection tend to entail interactions among multiple autonomic elements. Bohra et. al.,[7] proposed a remote monitoring and recovery/repair of the software state of a computer system without using its processors or relying on its OS resources. It can be used to detect and repair damage to the OS state of a computer system. Two case studies of remote repair of an OS subject to resource depletion to the point where it cannot perform useful work and local repair is impossible. |
III. System Architecture |
 |
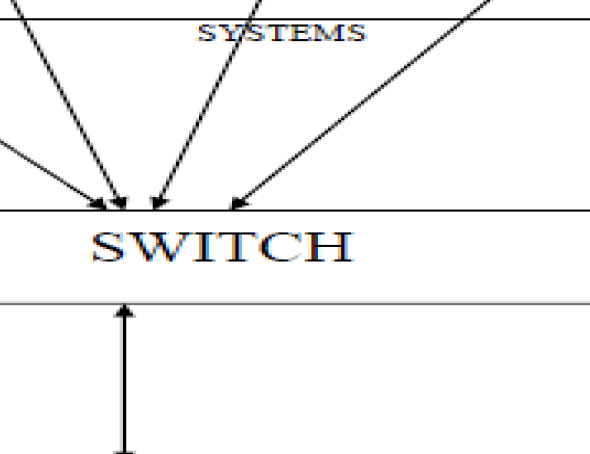
| Figure 1. Architectural Block Diagram |
| Each system has the host level component called user space sensor, which monitors the system and publishes significant events to the monitoring server. This approach correlates host generated events with events from other spaces, such as network sensors, that pertain to network-level indicators of host failure. The purpose of the user space sensor is to collect and pre-process host-level state data and to generate sufficient events in order to enable host verification at higher levels in the system. The user space sensor comprises 2 modules: a state extractor and an evaluator. The state extractor must acquire the following metrics: each process should have its process ID(PID), process state, percent memory utilization, percent process CPU utilization, process parent name, process parent ID(PPID). Similarly entire system should have information about percent total system memory utilization, percent total system CPU utilization, total number of processes, total bytes sent and received over network interface, total number of disk IO operation. This system design governs the following general scenarios: Analyze in change of host behaviour after the network-level event relevant to that host has occurred. Also, diagnoses of the host failure caused by system or service configurations and application flaws. Many computers systems are connected over a network, where in the systems can be a single CPU or multiple CPU’s, these systems are connected to the Server. The server can be a single CPU or multiple CPU’s, connected to all the systems over a network (switch). Resources of the system such as Memory, CPU, Network, Processes, I/O disks etc, the data of these resources are collected from the individual system at the server which can be said as the master system. The resources of the systems are analyzed at different time intervals. The time interval is designed configurable such that the performance of the different systems connected to the main server are being analyzed. Monitoring: System performance monitoring is the act of collecting system performance parameters such as node’s CPU utilization, memory usage, I/O and interrupts rate, and present them in a form that can be easily understood by the system administrator. This service is important for the stable operation of large clusters because it allows the system administrator to spot potential problems earlier. Moreover, other parts of the systems software can also benefit from the information provided. |
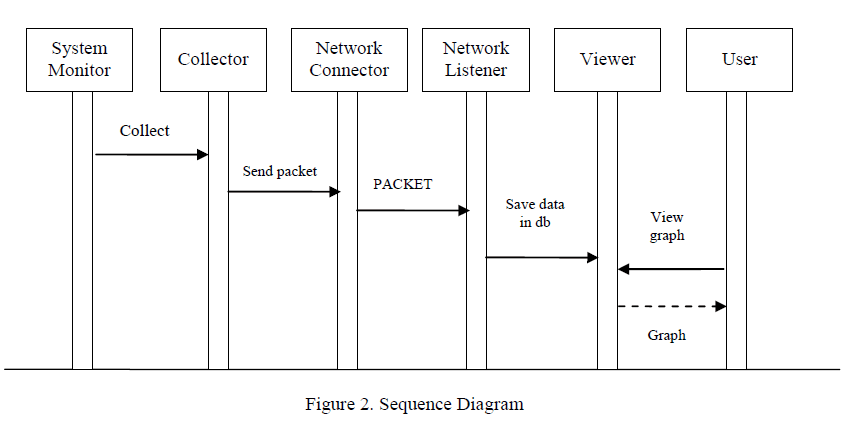
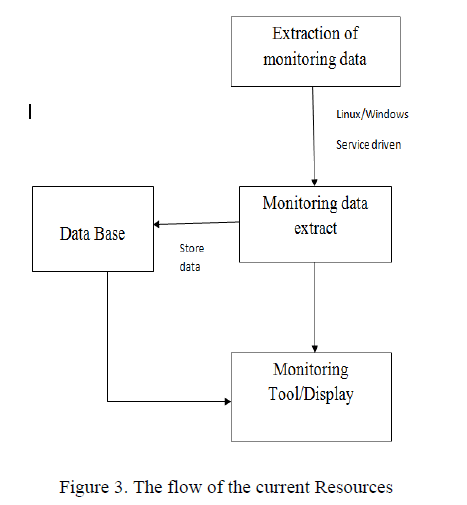
| System Design: System’s main function is to realize the server monitoring, to extract several performance indicators of being monitored process from the computer system and at the same time to display them during the operation process of being monitored process of being set. System can demonstrate these performance indicators in front of the test staff in the real-time waveform way according to choose and put together the same performance indicators of the different processes for the waveform comparison. In the same time of monitoring and displaying, it stores the monitor data to be needed into the database, which is neither a waste of system resources and can remove the helpless situation of the testers long sitting in front of a computer to monitor. The testers may be based on need at any time to view the data stored in the database and can show all monitoring data of the monitoring process at a monitored time period in the waveform diagram or in tabular form. |
 |
 |
| Database Design: The focus of the system is that you can choose whether or not to store the monitoring data down for testing staff and managers to view the situation monitored. The monitoring of the system is generally long Running tests in the performance testing process, which will certainly generate a lot of monitoring data. To store the monitoring data into a database can more conveniently and more intuitively extract these monitoring data to viewing and to analysis. Pm Info table and Pm Record table be used to record monitoring data of the process. When the system began to record the monitoring data for the monitoring process, a record is added into the Pm Record table in the database with recording the current monitoring ID, the monitoring information of the recording starting time. When the recording ended, the monitoring information of the recording ending time is recorded. Throughout the recording monitoring data time period, every one set time interval, a data is added into the Pm Info table in the database with the record of CPU utilization rate, physical memory usage, virtual memory usage, etc. monitoring information of the current monitoring sampling time. At the same time, to use RID column attributes of the Pm Info table to record that this article records corresponds to which performance sampling of the process in the Pm Record table. |
IV. SIMULATED RESULTS |
 |
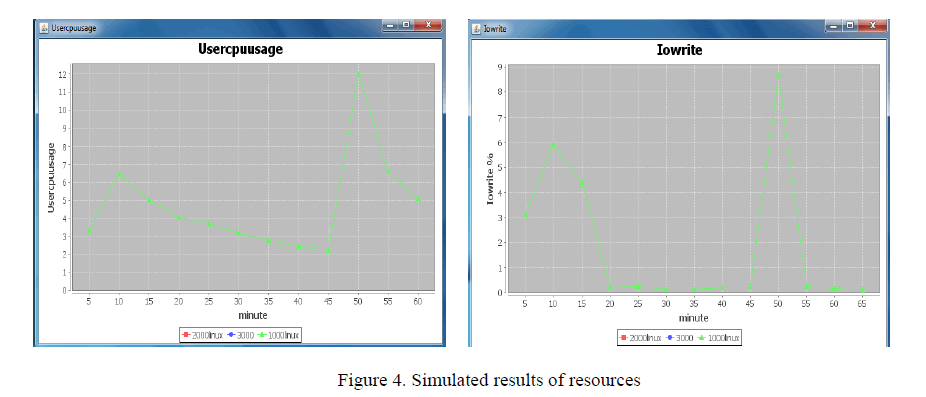
| The figure 4 shows the simulated results of the system resources. It indicates that the system resources are plotted in regular time interval of 5 minutes. The analysis is made on the basis of the individual resource performance. Based on the performance graph and it’s analysis, the server decides whether the system needs service or some modifications at the client end. |
V. CONCLUSIONS |
| Theoretical analysis and simulation results show that this system proposes the design program of the server performance monitoring system. It is an important step forward towards more automated server and service awareness in large networks. However, more work remains to be done to fully assess the scalability of the system’s runtime and detection performance in much longer environments. |
References |
|