ISSN ONLINE(2319-8753)PRINT(2347-6710)
ISSN ONLINE(2319-8753)PRINT(2347-6710)
| Dr. Rehan A. Khan Associate Professor, Department of Civil Engg, Z.H.College of Engineering and Technology, Aligarh Muslim University, Aligarh (U.P.) – 202002, India |
| Related article at Pubmed, Scholar Google |
Visit for more related articles at International Journal of Innovative Research in Science, Engineering and Technology
The basic concept of Performance Based Seismic Design is to provide engineers with the capability to design buildings that have a predictable and reliable performance in earthquakes. Performance based Seismic design is an elastic design methodology done on the probable performance of the building under input ground motions. The present study is an effort to understand Performance Based Design Approach. In this, a five storey symmetrical building is designed using STAAD.Pro and the performance based seismic design is performed by N2 method using a simple computer-based pushover analysis technique using SAP2000, a product of Computers and Structures International. The procedure compares the capacity of the structure (in the form of a pushover curve) of a MDOF system with the demands on the structure (in the form of inelastic response spectra of a single degree freedom system). The method is formulated in acceleration displacement format. The graphical intersection of the two curves approximates the performance point of the structure. The proposed method is illustrated by finding the seismic performance point for a five storey reinforced concrete framed building located in Zone-IV, symmetrical in plan (designed according to IS 456:2002) subjected to three different PGA levels as input ground motion. An extensive parametric study is conducted to investigate the effect of many important parameters on the Performance point. The parameters include effect of input ground motion on performance point, changing percentage of reinforcement in columns, size of columns, beams individually.The results of analysis are compared in terms of base shear and storey displacements.
Keywords |
| Performance based seismic design, elastic response spectrum, inelastic response spectrum, N2 method, pushover analysis |
INTRODUCTION |
| Amongst the natural hazards, earthquakes have the potential for causing the greatest damages. Since earthquake forces are random in nature & unpredictable, the engineering tools needs to be sharpened for analyzing structures under the action of these forces. Performance based design is gaining a new dimension in the seismic design philosophy wherein the near field ground motion (usually acceleration) is to be considered. Earthquake loads are to be carefully modeled so as to assess the real behavior of structure with a clear understanding that damage is expected but it should be regulated. In this context pushover analysis which is an iterative procedure shall be looked upon as an alternative for the orthodox analysis procedures. This study focuses on pushover analysis of multistory RC framed buildings subjecting them to monotonically increasing lateral forces with an invariant height wise distribution until the preset performance level (target displacement) is reached. The promise of performance-based seismic engineering (PBSE) is to produce structures with predictable seismic performance. To turn this promise into a reality, a comprehensive and well-coordinated effort by professionals from several disciplines is required. |
| Performance based engineering is not new. Automobiles, airplanes, and turbines have been designed and manufactured using this approach for many decades. Generally in such applications one or more full-scale prototypes of the structure are built and subjected to extensive testing. The design and manufacturing process is then revised to incorporate the lessons learned from the experimental evaluations. Once the cycle of design, prototype manufacturing, testing and redesign is successfully completed, the product is manufactured in a massive scale. In the automotive industry, for example, millions of automobiles which are virtually identical in their mechanical characteristics are produced following each performance-based design exercise. |
| What makes performance-based seismic engineering (PBSE) different and more complicated is that in general this massive payoff of performance-based design is not available. That is, except for large-scale developments of identical buildings, each building designed by this process is virtually unique and the experience obtained is not directly transferable to buildings of other types, sizes, and performance objectives. Therefore, up to now PBSE has not been an economically feasible alternative to conventional prescriptive code design practices. Due to the recent advances in seismic hazard assessment, PBSE methodologies, experimental facilities, and computer applications, PBSE has become increasing more attractive to developers and engineers of buildings in seismic regions. It is safe to say that within just a few years PBSE will become the standard method for design and delivery of earthquake resistant structures. In order to utilize PBSE effectively and intelligently, one need to be aware of the uncertainties involved in both structural performance and seismic hazard estimations. |
| The recent advent of performance based design has brought the nonlinear static pushover analysis procedure to the forefront. Pushover analysis is a static, nonlinear procedure in which the magnitude of the structural loading is incrementally increased in accordance with a certain predefined pattern. With the increase in the magnitude of the loading, weak links and failure modes of the structure are identified. The loading is monotonic with the effects of the cyclic behavior and load reversals being estimated by using a modified monotonic force-deformation criteria and with damping approximations. Static pushover analysis is an attempt by the structural engineering profession to evaluate the real strength of the structure and it promises to be a useful and effective tool for performance based design. |
LITERATURE SURVEY |
| A brief review of the earlier works on PBSD is presented below in order to highlight the need for the present work. Detailed review of relevant literature is separately in the next chapter. Performance-based design of buildings has been practiced since early in the twentieth century, England, New Zealand, and Australia had performance based building codes in place for decades [1]. The International Code Council (ICC) [2] in the United States had a performance code available for voluntary adoption since 2001 (ICC, 2001). The Inter-Jurisdictional Regulatory Collaboration Committee (IRCC) is an international group representing the lead building regulatory organizations of 10 countries formed to facilitate international discussion of performance-based regulatory systems with a focus on identifying public policies, regulatory infrastructure, education, and technology issues related to implementing and managing these systems. |
| In 1989, the FEMA-funded project was launched to develop formal engineering guidelines for retrofit of existing buildings began (ATC, 1989), it was recommended that the rules and guidelines be sufficiently flexible to accommodate a much wider variety of local or even building-specific seismic risk reduction policies than has been traditional for new building construction. The initial design document, [3] NEHRP Guidelines for the Seismic Rehabilitation of Existing Buildings, FEMA 273, therefore contained a range of formal performance objectives that corresponded to specified levels of seismic shaking. The performance levels were generalized with descriptions of overall damage states with titles of Operational, Immediate Occupancy, Life Safety, and Collapse Prevention. These levels were intended to identify limiting performance states important to a broad range of stakeholders by measuring: the ability to use the building after the event; the traditional protection of life safety provided by building codes; and, in the worst case, the avoidance of collapse. Following the Northridge event, the Structural Engineers Association of California (SEAOC, 1995) developed a PBSD process, known as Vision 2000 [4], which was more generalized than that contained in FEMA 273 but used similarly defined performance objectives. |
| Over the 10-year period after publication of FEMA 273, its procedures were reviewed and refined and eventually published in 2006 as an American Society of Civil Engineers (ASCE) national standard - Seismic Rehabilitation of Existing Buildings, ASCE 41. Although intended for rehabilitation of existing buildings, the performance objectives and accompanying technical data in ASCE 41 responded to the general interest in PBSD and have been used for the design of new buildings to achieve higher or more reliable performance objectives than perceived available from prescriptive code provisions. ASCE 41 is considered to represent the first generation of performance-based seismic design procedures. |
MODELING APPROACH |
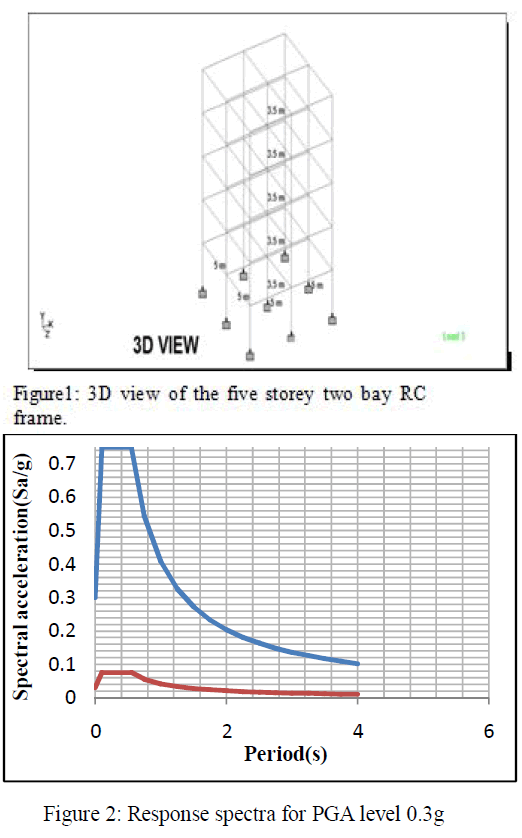
| A 3-D model of five storeyRCC building shown in Fig.1 has been created using finite element package SAP 2000 to undertake the non linear analysis. Beams and columns are modeled as nonlinear frame elements with lumped plasticity at the start and the end of each element. SAP 2000 provides default-hinge properties and recommends PMM hinges for columns and M3 hinges for beams as described in FEMA-356. |
ASSUMPTIONS |
| a. The material is homogeneous, isotropic and linearly elastic. |
| b. All columns supports are considered as fixed at the foundation. |
| c. Tensile strength of concrete is ignored in sections subjected to bending. |
| d. The super structure is analyzed independently from foundation and soil medium, on the assumptions that foundations are fixed. |
| e. The floor acts as diaphragms, which are rigid in the horizontal plane. |
| f. Pushover hinges are assigned to all the member ends. In case of columns PMM hinges (i.e. Axial Force and Biaxial Moment Hinge) are provided at both the ends, while in case of beams M3 hinges (i.e. Bending Moment hinge) are provided at both the ends. |
| g. The maximum target displacement of the structure is kept at 4.0% of the height of the building = (4.0/100) x 17.5= 0.7m = 700mm. |
SEISMIC INPUT |
| The elastic response spectra with PGA levels of 0.1g, 0.3g and 0.4g are used as per IS Code 1893: 2002. The elastic response spectra are changed to inelastic response spectra which are taken as seismic input. The response spectra for elastic and inelastic response for PGA levels of 0.3g is shown Fig.2. |
PUSH OVER ANALYSIS |
| In Pushover analysis, a static horizontal force profile, usually proportional to the design force profiles specified in the codes, is applied to the structure. The force profile is then incremented in small steps and the structure is analyzed at each step. As the loads are increased, the building undergoes yielding at a few locations. Every time such yielding takes place, the structural properties are modified approximately to reflect the yielding. The analysis is continued till the structure collapses, or the building reaches certain level of lateral displacement. |
PERFORMANCE BASED SEISMIC DESIGN |
| Performance-based seismic design explicitly evaluates how a building is likely to perform; given the potential hazard it is likely to experience, considering uncertainties inherent in the quantification of potential hazard and uncertainties in assessment of the actual building response [5],[6]. In performance-based design, identifying and assessing the performance capability of a building is an integral part of the design process, and guides the many design decisions that must be made. It is an iterative process that begins with the selection of performance objectives, followed by the development of a preliminary design, an assessment as to whether or not the design meets the performance objectives, and finally redesign and reassessment, if required, until the desired performance level is achieved.Performance-based design begins with the selection of design criteria stated in the form of one or more performance objectives. Each performance objective is a statement of the acceptable risk of incurring specific levels of damage, and the consequential losses that occur as a result of this damage, at a specified level of seismic hazard. Losses can be associated with structural damage, nonstructural damage, or both. They can be expressed in the form of casualties, direct economic costs, and downtime (time out of service), resulting from damage. Methods for estimating losses and communicating these losses to stakeholders are at the heart of the evolution of performance-based design. Once the performance objectives are set, a series of simulations (analyses of building response to loading) are performed to estimate the probable performance of the building under various design scenario events. In the case of extreme loading, as would be imparted by a severe earthquake, simulations may be performed using nonlinear analysis techniques. If the simulated performance meets or exceeds the performance objectives, the design is complete. If not, the design is revised in an iterative process until the performance objectives are met. In some cases it may not be possible to meet the stated objective at reasonable cost, in which case, some relaxation of the original objectives may be appropriate. PBSD permits design of new buildings or upgrade of existing buildings with a realistic understanding of the risk of casualties, occupancy interruption, and economic loss that may occur as a result of future earthquakes. The goal of performance-based seismic design is to ensure that performance objectives are satisfied. That is, the structure will perform in a desired manner under various intensity of earthquake loading. According to the framework of performance-based design (SEAOC 2000 [7]), single or multiple performance objectives are selected at first according to seismic design code and the requirement of the owner in the conceptual design phase. When implementing a direct displacement-based approach, displacement parameters such as the top displacement or inter-story drift ratio of a building, the plastic rotation of the hinge at the base of a column, displacement ductility ratio etc. can be employed to describe the target performance. Acceptable limits of these parameters regarding each level of seismic hazard corresponding to each performance objective are quantified. In the conceptual design step, layout of the structure is then determined without numerical analysis. Conceptual design guide [8] and energy balanced equation may be useful for engineering judgment. A successful conceptual design could hopefully reduce the impact of uncertainties on the real structural behavior. After the conceptual design phase is completed, the numerical design phase is proceeded to determine the structural detailing, which satisfy the pre-quantified performance objectives. Preliminary design can be conducted through two different approaches: |
| (1)Traditional force-based design method followed by the check of performance objectives. |
| (2) Direct design method starting from the pre-quantified performance objectives. |
| The result obtained by the latter is believed to be closer to the final design and requires less computational effort. Verification of performance objectives employing non-linear pushover or non-linear time-history analysis is finally carried out to reach the final design. The performance objectives are satisfied if the calculated performance parameters do not exceed the acceptance limits. Since the numerical phase of performance-based design is an iterative procedure between design and verification, in order to save computational effort, it is suggested to select fewer performance objectives in the preliminary design and check all performance objectives in the final design. The decision as to how many and which performance objectives need to be selected depends on if that performance objective is the main concern of the users and owners and if quantification of the performance acceptable limit is reliable. |
CAPACITY SPECTRUM METHOD |
| The nonlinear method used here to perform seismic analysis is known as N2 method [9]. It combines the pushover analysis of a multi degree of freedom (MDOF) system with the response spectrum of equivalent single degree of freedom (SDOF) system. The method is formulated in the acceleration- displacement format, which enables the visual interpretation of the procedure and of the relations between the basic quantities controlling the seismic response. Inelastic spectra rather than elastic spectra with equivalent damping and period are applied. This feature represents the major difference with respect to the capacity spectrum method [10]. It characterizes the seismic demand initially using a 5% damped linear-inelastic response spectrum and reduces the spectrum to reflect the effects of energy dissipation to estimate the inelastic displacement demand. The point at which the Capacity curve intersects the reduced demand curve represents the performance point at which capacity and demand are equal. |
PUSHOVER ANALYSIS: CONSTRUCTING CAPACITY SPECTRUM |
| Using a pushover analysis, a characteristic nonlinear force - displacement relationship of the MDOF system can be determined. In principle, any force and displacement can be chosen. In this study, base shear and roof (top) displacement have been used as representative of force and displacement, respectively. |
| The capacity spectrum can be developed from the pushover curve by a point by point conversion to the first mode spectral coordinates. Any point Vi(Base Shear), δi (Roof Displacement) on the capacity (pushover) curve is converted to the corresponding point Sai, Sdi on the capacity spectrum using the equations: |
 |
| Where α1 and PF1, are the modal mass coefficients and participation factors for the first natural mode of the structure respectively.φ1roof is the roof level amplitude of the first mode. |
| The modal participation factors and modal coefficient are calculated as: |
 |
| Where wi is the weight at any level i. As displacement increase, the period of the structure lengthens. This is reflected directly in the capacity spectrum. Inelastic displacements increase damping and reduce demand. The Capacity Spectrum Method reduces the demand to find an intersection with the capacity spectrum, where the displacement is consistent with the implied damping. |
SIMULATION AND RESULTS |
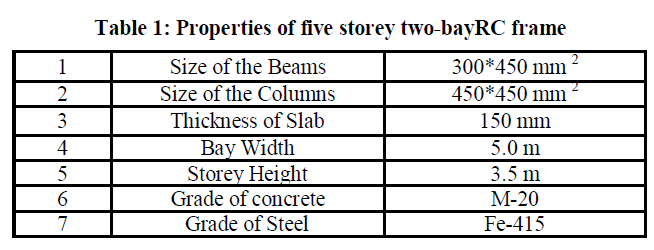
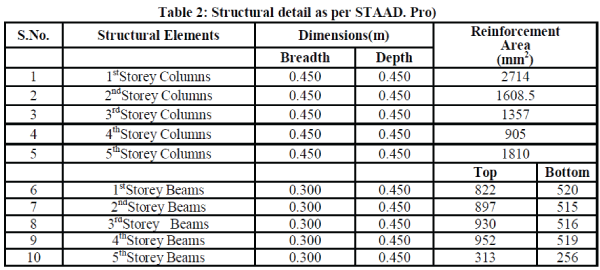
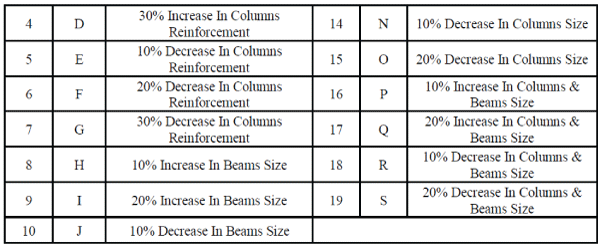
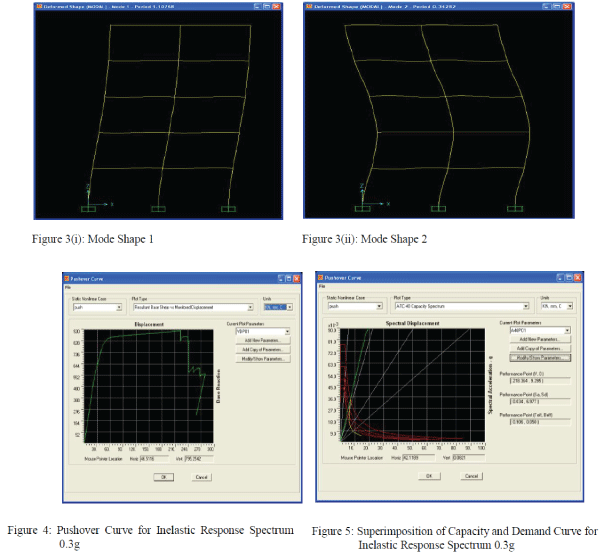
| To illustrate the PBD procedure for finding the performance point, a five storey concrete frame as shown in Fig.1 is taken as an example. The properties of the concrete frame are shown in Table1. The frame is designed according to IS 456: 2000 (with the superimposed vertical loads) using STAAD Pro. Structural details and natural frequencies of the concrete frame are given in Table 2 and 3 respectively. It is seen from the Table 3 that the natural frequencies of the frame are quite widely spaced, which means that the dynamic response will be dominated by the first mode only and the contribution due to response of the higher modes can be neglected. The first twomode shapes are shown in Fig.3(i) to 3(ii). The frame is subjected to inelastic response spectrum as per IS Code 1893: 2002 for 5% damping (for medium soil) for PGA levels of 0.1g, 0.3g and 0.4g obtained from elastic response spectra. The pushover analysis is performed on the RC building (designed according to IS 456: 2000) and redesigning by changing the main reinforcement of various frame elements and again analyzing. The performance based seismic engineering technique known as N2 procedure has been effectively used in this regard. The pushover analysis has been carried out using SAP2000, a product of Computers and Structures International. For parametric studies, a total of 19 cases as per Table 4, for a particular five storey building frame located in Zone-IV have been analyzed, changing reinforcement and sizes of different structural elements, i.e. beams and columns, in different combinations as well as at different storey levels. A comparison between response obtained using elastic and inelastic response spectra for PGA level 0.4g is also obtained. |
1. EFFECT OF PGA LEVELS ON PERFORMANCE OF THE BUILDING FOR ELASTIC AND IN-ELASTIC RESPONSE SPECTRA. |
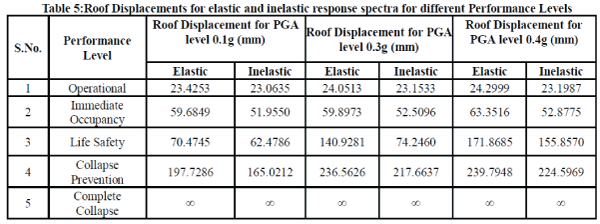
| Pushover analysis of the five storey RC framed building subjected to monotonically increasing lateral forces with an invariant height wise distribution is performed using SAP2000. The pushover curve i.e. curve between Displacement and Base shear is obtained for inelastic response spectra of 0.1g, 0.3g and 0.4g. The pushover curve for inelastic response spectra of 0.3g is shown in Fig. 4. It is observed that as the PGA level increases base shear and roof displacement also increases. Table5 show the roof displacements for the frame for different PGA levels at different performance levels for elastic and inelastic response spectra respectively. Table6 show the ductility demands for the frame for different PGA levels at different performance levels for elastic and inelastic response spectra respectively. As is obvious the roof displacement and ductility demand increases as the performance level goes from operational to collapse prevention level for each PGA level. It is also seen that as input PGA level increases, the roof displacement and ductility demand also increases. |
2. BASE shear and displacement variation on performance point of the building for elastic and in-elastic response spectra. |
| The performance point of the structure is determined by using the Acceleration-Displacement Response Spectra method (ADRS) pushover curves obtained. The performance point is the point where the capacity and demand of the structure are equal. Superimposition of the capacity spectrum curve and demand curve are obtained for inelastic response of different PGA levels. The capacity and Demand curve for inelastic response spectra of 0.3g is shown in Fig.5. The base shear and displacement variation at performance point is shown in Table7 for elastic and inelastic response spectra respectively, for different PGA levels. It can be concluded that as g level increases, performance point increases. |
3. EFFECT OF CHANGE IN VARIOUS PARAMETERS ON THE PERFORMANCE OF THE BUILDING. |
3.1 EFFECT OF CHANGE OF REINFORCEMENT IN COLUMNS (CASE B- CASE G) |
| Table 8 shows the effect of change of reinforcement in columns on the performance point. It is seen that as the reinforcement increases, the base shear increases and the roof displacement decreases and vice versa. |
3.2 EFFECT OF CHANGE OF SIZE OF THE COLUMNS AND BEAMS SIMULTANEOUSLY (CASE PCASE S) |
| Table 9 shows the effect of change of size of columns on the performance point. It is seen that as the size increases, the base shear increases and the roof displacement decreases. |
3.3 Effect of change of Response Reduction Factor (R) |
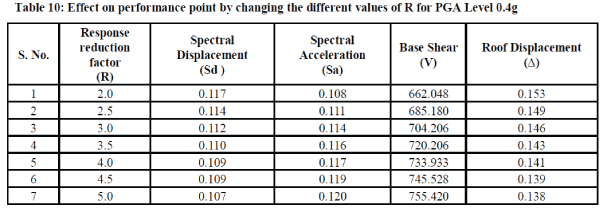
| Table 10 shows that the performance point is slightly affected by variation of Response Reduction Factor (R). |
3.4 EFFECT OF SOIL BEHAVIOUR ON DIFFERENT PERFORMANCE LEVELS |
| Table 11 shows comparison of elastic and inelastic response, there is decrease in response due to non-linearity of soil damping. |
4. COMPARISON OF TARGET ROOF DISPLACEMENT AND ACTUAL DISPLACEMENT AT VARIOUS PERFORMANCE LEVELS OF THE BUILDING. |
| Specified deformation states are often taken as a measure of building performance at corresponding load levels. For example, the US Federal Emergency Management Agency identifies operational, immediate-occupancy, life-safety and collapse-prevention performance levels, and adopts roof-level lateral drift at the corresponding load levels as a measure of the associated behavior states of the building. The increasing degrees of damage that a building experiences at the various performance levels are associated with earthquakes having increasing intensities of horizontal ground motion. Table 11 shows the comparisons of target roof displacement and actual displacement observed at operational, immediate-occupancy, life-safety and collapse-prevention performance levels for elastic and inelastic response for PGA level 0.4g. Performance based design is obtained by increasing the main reinforcement of various frame elements by hit and trail method, so that the building performance level, (after performing Pushover Analysis) lies in Immediate |
| Occupancy level i.e., roof displacement of building is 0.7% of total height of building (122.5mm). It is seen that the actual roof displacement is less than the target displacement and so the design is safe. Further when the design thus obtained is subjected to triangular loading corresponding to MCE, (Maximum Considered Earthquake) i.e., roof displacement of building obtained is less than 2.5% of total height of building (437.5mm) and thus the structural damage is limited to Grade 3 (moderate structural damage, heavy nonstructural damage) in order to ensure life safety. |
 |
 |
 |
 |
 |
 |
 |
 |
 |
 |
 |
| Table 11: Comparison of target roof displacement and actual displacement observed at various performance levels for PGA Level 0.4g |
 |
 |
 |
CONCLUSIONS |
| Based on the present study, the following conclusions can be drawn: |
| 1. Pushover Analysis is an elegant tool to visualize the performance level of a building under a given earthquake. It provides valuable information for the performance based seismic design of building frame. |
| 2. Since frequencies are wide apart, thus for pushover analysis higher modes are neglected. |
| 3. Roof displacements increase as the frame is pushed forward for different PGA levels of earthquake. |
| 4. Ductility demand increases as the frame is pushed towards plastic range and ultimately at ∞ demand the structure collapses due to plastic mechanism for different PGA levels. |
| 5. As the response changes from elastic to inelastic, roof displacements and ductility demands decrease for different PGA levels. |
| 6. The performance point obtained satisfies the acceptance criteria for immediate occupancy and life safety limit states for various intensities of earthquake. |
| 7. The increase in reinforcement of columns results in nominal change in base shear and displacement. |
| 8. As the size increases, the roof displacement decreases whereas base shear increases. |
| 9. As the size decreases, the roof displacement increases whereas base shear decreases. |
| 10. Performance point is slightly affected by variation of Response Reduction Factor (R). |
| 11. Due to increased damping of soil, maximum response reduces when elastic behaviour changes to inelastic. |
| 12. Roof displacements increase as the frame is pushed forward for different PGA levels of earthquake. |
References |
|