ISSN ONLINE(2319-8753)PRINT(2347-6710)
ISSN ONLINE(2319-8753)PRINT(2347-6710)
| RP Pathak1, Sameer Vyas2, Pankaj Sharma3, NV Mahure4, SL Gupta5 Scientist B, Concrete Chemistry Division, CSMRS, HauzKhas, New Delhi, India1 Assistant Research Officer, Concrete Chemistry Division, CSMRS, HauzKhas, New Delhi, India2 Scientist C, Concrete Chemistry Division, CSMRS, HauzKhas, New Delhi, India3 Scientist D, Concrete Diagnostic Division, CSMRS, HauzKhas, New Delhi, India4 Scientist E/Group Head, Concrete Group, CSMRS, HauzKhas, New Delhi, India5 |
| Related article at Pubmed, Scholar Google |
Visit for more related articles at International Journal of Innovative Research in Science, Engineering and Technology
The hydro projects envisage various concrete structure viz. dam body, foundation galleries, inspection galleries, power house complex, headrace tunnel, tail race tunnel etc. which are constructed using concrete linings of different grades. Its durability is determined by various factors viz. aggressivity of surrounding water, temperatures fluctuations etc. If the water happens to be soft it is injurious to the useful life of concrete as it leads to leaching of lime. Leaching is a phenomenon that is caused by water migrating through the permeable concrete. The permeated water causes corrosion of reinforcement leading to weakening of structure. Once such phenomenon is observed in any such structures a vigilant periodic monitoring approach becomes mandatory. The suitable remedial measure to be adopted will depend on the observed degree of deterioration. In this paper effort has been made to diagnose degree of corrosion of reinforcement at different locations in the power house complex and dam foundation gallery of one of the projects in the state of Himachal Pradesh, India using Half Cell Potentiometer.
Keywords |
| Keywords:Corrosion, galleries, reinforcement, rebar, half cell potentiometer |
INTRODUCTION |
| Corrosion problems are very common in almost all aspects of technology resulting in cropping of variety of problems. Post construction corrosion damage in the reinforcement is an enormous economic liability. Various elements in any hydroelectric project are constructed using concrete linings of different grades. The water in Himalayan Rivers is generally soft which causes leaching of lime (Fig. 1, 2). |
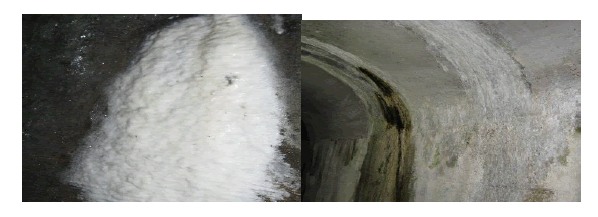 |
| Fig. 1 White Leachate deposit in the Power House ComplexFig. 2 White, Black and BrownLeachate deposit in Dam Gallery |
| The permeated water causes corrosion of reinforcement leading to weakening of structure [1]. Diagnosis of the intensity of corrosion and its constant monitoring will provide useful information for adopting suitable preventive measures [2]. In this paper effort has been made to diagnose degree of corrosion of reinforcement at different locations in the power house complex and dam foundation gallery of one of the projects in the state of Himachal Pradesh, India using Half Cell Potentiometer. |
II LITERATURE SURVEY |
| Half-cell potential measurements are simple, inexpensive and virtually non-destructivetechniques [1] to assess thecorrosion risk of steels in concrete. These measurements can be usedto estimate the corrosion risk of steels even if there are no signs of corrosion on the concretesurface, which is a significant advantage for inspecting existing concrete structures. However,different organizations have different recommendations on half-cell potential measurements.ASTM C 876 [2] suggests numerical criteria for assessing the corrosion risk of steels basedon a survey of concrete bridge decks [5]. Meanwhile, RILEM TC 154-EMC [3] suggests thatnumerical criteria, such as ASTM C 876, lead to misinterpretation because the measuredvalues of the potential fluctuate due to various factors. RILEM also recommends focusing onthe potential gradient or difference rather than the measured value of the potential. |
III.METHOD ADOPTED |
| A Half – Cell Electrical Potential Method to Measure Corrosion of Reinforcement in Concrete (ASTM C 876-91) |
| The Half Cell Potential Testing method is a technique, used for assessment of the durability of reinforced concrete and helps in diagnosing reinforcement corrosion [2, 3]. The method of half cell potential measurements normally involves measuring the potential of an embedded reinforcing bar relative to a reference half cell placed on the concrete surface. The half cell is usually Copper/ Copper Sulphate or Silver/ Silver Chloride cell but other combinations are used. The concrete functions as an electrolyte and the risk of corrosion of reinforcement in immediate region of the test location may be related empirically to the measured potential difference. The typical layout of the equipment is shown fig. 2. |
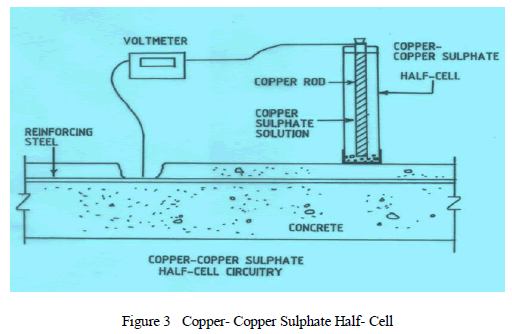 |
| The half cell consist a rigid tube composed of dielectric material that is non-reactive with copper or copper sulphate, a porous wooden or plastic plug that remains wet by capillary action, and a copper rod that is immersed within the tube in a saturated solution of copper sulphate. The solution is prepared using reagent grade copper sulphate dissolved to saturation in a distilled or deionized water. An electrical junction device is used to provide a low electrical resistance liquid bridge between the surface and the half cell, is normally a sponge. Electrical contact solution is made from normal house hold detergent. Measurements are made in either a grid or random pattern. The potential risks of corrosion based on potential difference readings [3] are presented in Table 1. |
 |
| Table 1 The potential risks of corrosion based on potential difference readings |
IV.EQUIPMENT USED |
| Following equipments were deployed for the corrosion monitoring of reinforcement in concrete (Fig. 4) |
| - Micro cover meter- R Meter MKIII |
| - Half Cell Surveyor- CORMAP II |
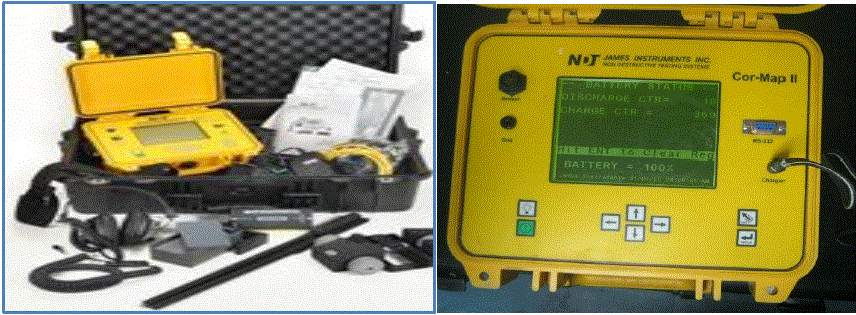 |
| Figure 4.Equipments Deployed for Investigation |
| The micro cover meter has been used to locate the rebar [4]. The concrete surface was examined for the exposed rebars/or got exposed to get a reference point. Surface was made wet and observation locations were marked on the surface [5]. The pre -activated Cu-CuSO4 Half Cell was used to take observation. |
| The test results are categorized in 7 categories from A to G category in the typical map recorded on CORMAP II, their interpretation is given below. |
 |
| Table 2 Categories of Corrosion Activity |
V. TEST LOCATIONS |
| The corrosion monitoring and pulse wave tests were carried out at selected locations (Table 3) in the power house complex and dam underground gallery. |
 |
| Table-3: Details of Test Locations |
VI. OBSERVATIONS |
| Investigation were carried out at certain fixed locations selected on the basis of heavy leaching patches (Table 3). The observed values for the tests done at power house complex and dam foundation gallery are presented in fig. 5-10 and 11-14 respectively in the form of contour map and pie chart [6, 7, 8]. |
VII.RESULT AND DISCUSSION |
| APower House Complex |
| 1) Location: (Unit IV Main Inlet Valve, Front Wall) |
| The Test results are presented as contour map (Fig. 5) and pie chart (Fig. 6). It is observed that 4% area falls under category „DâÃâ¬ÃŸ, 71% area falls under category „EâÃâ¬ÃŸ and remaining 25% area falls under category „FâÃâ¬ÃŸ. |
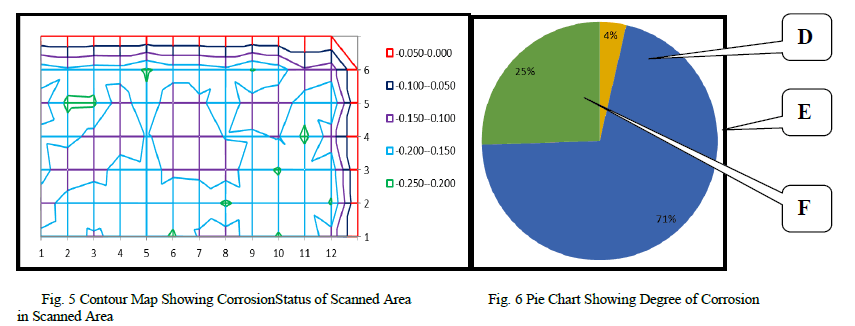 |
| Referring Table 1 it is observed that in 4% area status of corrosion is uncertain while in remaining 96% area, 90% chances are that there is no corrosion activity at present. |
| 2) Location: (Unit IV Main Inlet Valve, Left Wall) |
| The Test results are presented as contour map (Fig. 12) and pie chart (Fig. 13). It is observed that 4% area falls under category „CâÃâ¬ÃŸ, 31% area falls under category „DâÃâ¬ÃŸ, 50% area falls under category „EâÃâ¬ÃŸ and remaining 15% area falls under category „FâÃâ¬ÃŸ. |
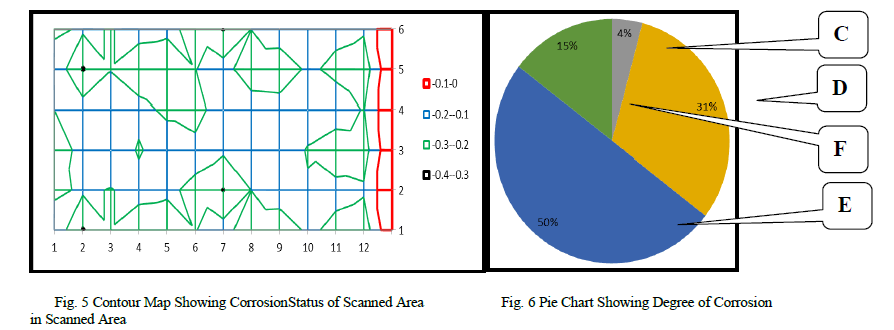 |
| Referring Table 1 it is observed that in 35% area status of corrosion is uncertain while in remaining 65% area, 90% chances are that there is no corrosion activity at present. |
| 3) Location: (Unit III Main Inlet Valve, Front Wall) |
| The Test results are presented as contour map (Fig. 14) and pie chart (Fig. 15). It is observed that 8% area falls under category „DâÃâ¬ÃŸ, 15% area falls under category „EâÃâ¬ÃŸ and remaining 77% area falls under category „FâÃâ¬ÃŸ. |
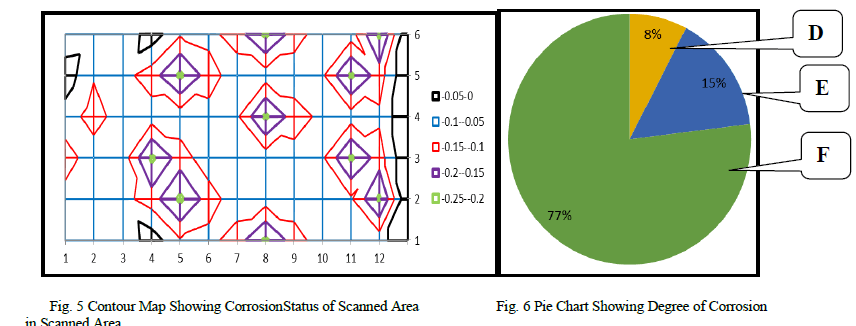 |
| Referring Table 1 it is observed that in 8% area status of corrosion is uncertain while in remaining 92% area, 90% chances are that there is no corrosion activity at present. |
| BDam Foundation Gallery |
| 1) Location: (Upstream Wall, EL 1441m Block No. 8) |
| The Test results are presented as contour map (Fig. 16) and pie chart (Fig. 17). It is observed that 25% area falls under category „DâÃâ¬ÃŸ, 62% area falls under category „EâÃâ¬ÃŸ and remaining 13% area falls under category „FâÃâ¬ÃŸ. |
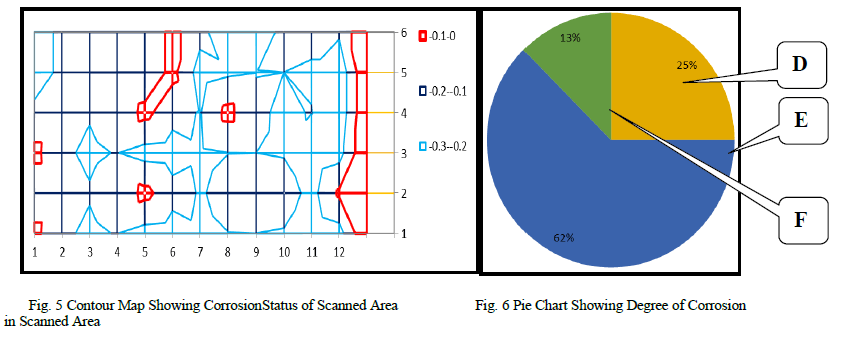 |
| Referring Table 1 it is observed that in 25% area status of corrosion is uncertain while in remaining 75% area, 90% chances are that there is no corrosion activity at present. |
| 2) Location (Upstream Wall, EL 1441m Block No. 4) |
| The Test results are presented as contour map (Fig. 18) and pie chart (Fig. 19). It is observed that 4% area falls under category „CâÃâ¬ÃŸ, 37% area falls under category „DâÃâ¬ÃŸ, 37% area falls under category „EâÃâ¬ÃŸ, 15% area falls under category „FâÃâ¬ÃŸ and remaining 7% area falls under category „GâÃâ¬ÃŸ. |
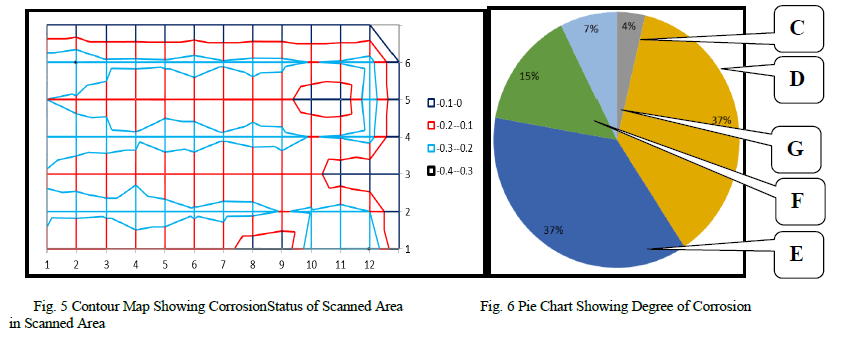 |
| Referring Table 1 it is observed that in 41% area status of corrosion is uncertain while in remaining 59% area, 90% chances are that there is no corrosion activity at present. |
VIII.CONCLUSION |
| The Half Cell Potential Testing method is a technique, used for assessment of the durability of reinforced concrete and helps in diagnosing reinforcement corrosion. |
| A Power House Complex |
| As per standard practices stated above, the test results of corrosion monitoring test conducted at three locations in the power house complex shows the traces of corrosion activity has initiated. |
| B Dam Foundation Gallery |
| As per standard practices stated above, the test results of corrosion monitoring test conducted at two locations in the dam foundation gallery shows signs of initiation of corrosion activity. |
VIII.RECOMMENDATION |
| Since indications of deterioration of concrete and reinforcement have been observed it is recommended that periodical monitoring of both the sites should be carried out using Non Destructive Tests. |
ACKNOWLEDGEMENT |
| The authors extend their sincere thanks to Director CSMRS for his constant inspiration. We also extend our sincere gratitude to Sh. AK.Rustagi and Sh. Devender Singh of CSMRS for their valuable efforts. We also extend our sincere gratitude to all the authors whose publications provided us directional information from time to time. |
References |
|