ISSN ONLINE(2319-8753)PRINT(2347-6710)
ISSN ONLINE(2319-8753)PRINT(2347-6710)
| V. Kumar, S. K. Gawre, T. Kumar Department of Electrical Engineering, MANIT, Bhopal, India. |
| Related article at Pubmed, Scholar Google |
Visit for more related articles at International Journal of Innovative Research in Science, Engineering and Technology
With an increased use of nonlinear loads, sensitive electronic equipments and variable frequency drives power quality has become a prominent issue these days. The development of new methods for detection classification and analysis of power quality is a major concern now a day. This paper presents a literature review of the application of wavelet transforms in the detection and analysis of power quality. The signal under analysis is often polluted by noises, under this situation the extraction of features becomes a difficult task, especially when the noise present in signal has high frequency spectrum which overlap with the frequency of fault. In this paper the de-noising methods are discussed. This review also presents the use of wavelet in other fields of power system and advantages of wavelet transform over other signal processing tools
Keywords |
| power quality; wavelet transform; multiresolution analysis; de-noising; discrete wavelet transform |
INTRODUCTION |
| In the industrialized world, due to continuous increase in sources of disturbance which occurs in interconnected power grids, the electric power system suffers from unwanted variation in the voltage and current signals [1, 48-51]. These unwanted variations in current and voltage signal leads to poor power quality [2]. The sources of disturbances in any power system network are large number power sources, power electronic devices such as inverters and converters, and nonlinear loads. Electric power has poor power quality if it has voltage sag, voltage swell, harmonics, transients etc. Power quality is the set of constraints of electrical properties that allows electrical system to function in intended manner without significant loss of its performance or life. The power quality problem causes system equipment‘s malfunctioning (partial or complete failure of power system equipments) [39,40] which can be very costly for end users so in order to minimize power quality events, it necessary to identify the events through power quality detection and classification system. Non-stationary disturbances are the major cause of malfunctioning of electrical equipments. Power quality detection requires the feature extraction from the input disturbance signal .Feature extraction is very important part of power quality analysis. |
| A brief survey on the methods for power quality events classification is done in [3, 4] New and powerful tools for analysis are currently available. Signal processing tools is used for the feature extraction of power signal. Wavelet analysis has been proven to be an effective signal processing tool for the detection and analysis of power signals but other signal processing tools such as Fourier transform, S-transform, time-time transform, higher-order statistics have also been used to find out other salient features. Traditionally, Fourier transform is used for mapping signal from time domain to frequency domain by decomposing the signal into various frequency components, but in Fourier transform the time information of transients is completely lost [5]. To overcome this limitation of Fourier transform shorttime Fourier transform (STFT) technique is used [6]. STFT is the technique which can be used only for stationary signal where the frequency does not changes with time but due to limitation of fixed window width STFT cannot recognize the signal dynamics property of a non-stationary signal. These drawbacks of Fourier transform and STFT is overcome by wavelet transform. Wavelet transform can be applied for stationary as well as non-stationary signals and provides time-frequency information of signal simultaneously [25, 44]. In [26,13] method for the detection and localization of PQ disturbances in both time and frequency domain was proposed. |
II. POWER QUALITY PROBLEMS AND CAUSES |
| Power quality is a critical issue in power system [28]. There are the various causes of power quality problems in power system network which having multiple sources of supply, non linear loads and electronic equipments [36, 38]. The rectification of power quality problem will reduce the risk of interruption and failures of power supply. The utilization of a combination of advanced signal processing techniques and real-time monitoring process for identification of failing of components facilitates maintenance and reduces unscheduled outages. In [37] DSP tool is implemented for the improvement of power quality in distribution system. |
| The important steps which are to be used for mitigation, of power quality problems, are as follows. |
| 1) Continuous monitoring of different power system quantities, |
| 2) Detection, identification and categorization of power quality related disturbances. |
| 3) Finding out probable causes of the identified problems. |
| 4) Automatic rectification of the probable causes |
| Following figure shows the various power quality problems and their causes. |
III. SIGNAL PROCESSING TOOLS |
| A. Short-Time Fourier Transforms |
| In many applications especially in time frequency analysis of signal, standard Fourier transform is not adequate because Fourier transform of the signal does not contain any of the local information. In order to eliminate this weakness of Fourier transform, in 1946 Dennis Gabor (physicist and engineer) first introduced windowed Fourier transform also known as Short Time Fourier transform (STFT). The power system generally takes a rough estimate of the non-periodic and time-varying variations. Also for information such as evaluating duration, severity and localization of disturbance propagation, there is a demand for both time and frequency analysis methods. Short-time Fourier transform (STFT) is a signal processing tool used for analysis, in frequency domain, of signals but it is most suitable for the signals which are stationary and periodic. It can be used for non stationary signal but operate in fixed window size to focus a certain period of time, which can trace the magnitude variations only up to some extent so non- stationary signals are difficult to analyze with shorttime Fourier transform [7, 8, 9,10] although it can extract the spectral information from the signal. In [11] author used both Fourier transform as well as wavelet transform for characterizing the events. Even though the STFT has a fixed frequency resolution for all frequencies once the size of window is chosen, it gives an easier interpretation in terms of harmonics. In [12] author has used hybrid of wavelet-Fourier algorithm for harmonic analysis of signal. In [7] author has done the analysis of voltage disturbance in time and frequency domain and with the experimental result proved that wavelet transform is better than shorttime Fourier transform. |
| B. Discrete STFT |
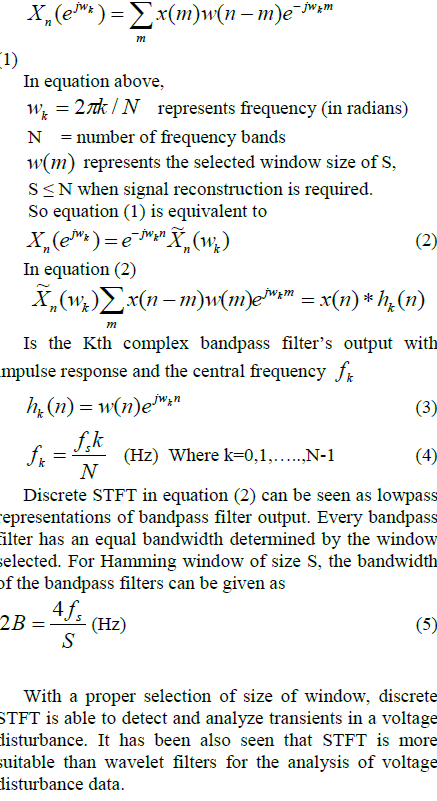
| For the time-frequency analysis of non-stationary signals Discrete Short-Time Fourier Transform (STFT) is applied. Discrete STFT decomposes time-varying signal into time-frequency domain components hence it provides the time-evolution of each signal components. Given a signal the discrete STFT for frequency band at time is defined as |
 |
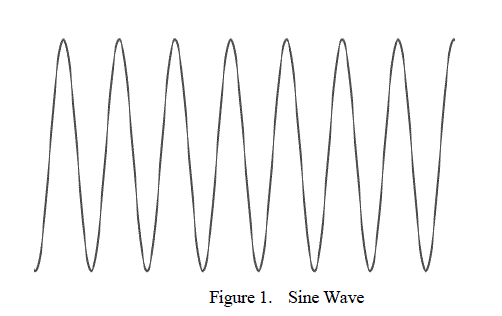
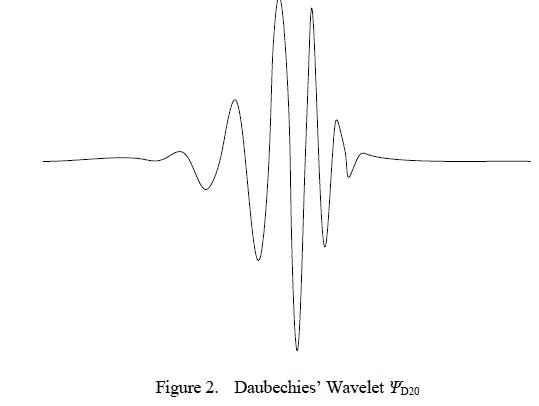
| C. Wavelet Transform Concept of wavelet started to appear in early 1980‘s as a signal processing tool. Wavelet theory provided new method for decomposing a function or signal into various frequency components, and then study each component with a resolution match to its scale. A wavelet is a âÃâ¬Ãâ¢small waveâÃâ¬Ãâ, its energy is concentrated in time to give a tool for analysis of transients, non stationary, time varying phenomenon which generally occurs in the power system network. Wavelet has ability to allow simultaneous time and frequency analysis of a signal with a flexible mathematical foundation [47]. Fig 1 shows the wave (sinusoid) oscillating with constant amplitude in time interval ïÃâ¬ÃÂïÃâÃ¥ïÃâãt ïÃâãïÃâÃÂ¥, thus this wave will posses infinite energy and in case of wavelet as the Fig 2 shows the energy is finite and concentrated around a point. |
 |
 |
| This is not a new idea. Approximation using superposition of functions has existing for a long time. In early 1800's J. Fourier gave the concept of Fourier transform to superpose sine and cosines to represent other functions. However, in wavelet analysis, the scale we use plays a very important role[11]. Wavelet algorithms process data at different scale. If we observe a signal with a large window, we can notice gross features. Similarly, if we look a signal with a small window, we could notice small features. The result in wavelet analysis is to see both the small as well as large features of a signal or function. This makes wavelet a more useful and interesting tool in signal analysis. For approximation of irregular signals, sines and cosines which comprise the bases of Fourier analysis was not very satisfactory. These sines and cosines functions are non-local (stretch over infinite interval). Therefore they give poor result in approximation of sharp spikes. Wavelets are well suited for approximation of data with sharp discontinuities. In wavelet analysis, signal broken into a series of local basis functions called wavelets, which are scaled and shifted versions of the original (or Mother) wavelet [5]. Wavelet transform can be classified in three different ways known as the wavelet series, continuous Wavelet Transform and discrete Wavelet Transform. In wavelet series method mapping, of a function of continuous variable into a sequence of coefficients, is done. In continuous WT, each wavelet is created by performing scaling and translation operations in a mother wavelet. Mother wavelets are oscillating function with a finite energy and average |
| mother wavelet [45], many wavelet functions named as mother wavelets. The wrong choice of mother wavelet may lead to poor results as they have different properties. Some of the popular wavelets are Haar, Morlet, Coiflet, Symlet and Daubechies. These wavelet functions are used according to the application, db4 is frequently adopted wavelet in power quality applications [28]. In [46] series of wavelet application in numerical analysis has been performed. The signal can be represented in terms of wavelet function and scaling function as |
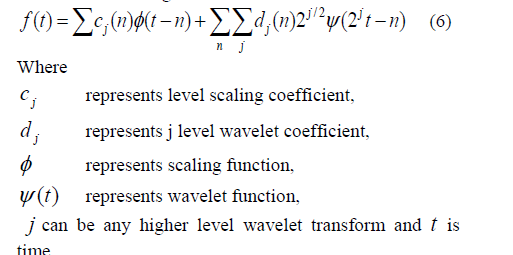 |
| The wavelet coefficients represent the information which is contained in various frequency bands of a signal. The peak magnitude, the mean value, square magnitude, the standard deviation, the entropy of these coefficients at the different resolution levels are commonly used magnitudes proposed in the literature as characteristic features for the detection and analysis of power quality events in power systems [13]. |
| Peak and square magnitude, standard deviation and mean value of wavelet coefficients are proposed for analysis of voltage event [14-23]. The coefficients of the CWT with the Morlet wavelet function for detection and localization purposes are used in [16,17]. In [30, 31] wavelet transform and SVM is used for development of algorithm for automatic classification of power quality events. In [32] an approach for power quality disturbance classification using Wavelet Transform (WT) and Hidden Markov Model (HMM) is proposed. In [26, 33] by using wavelet transform and S-transform the disturbances in grid connected distributed generation system is analyzed. In [35] adjusted Haar wavelet function is used for analysis of power system disturbances. In [60] wavelet transform has been used for recognizing overvoltage in a power system network. |
| D. Continuous wavelet transforms |
| The continuous wavelet transform (CWT) of a continuous signal can be expressed as |
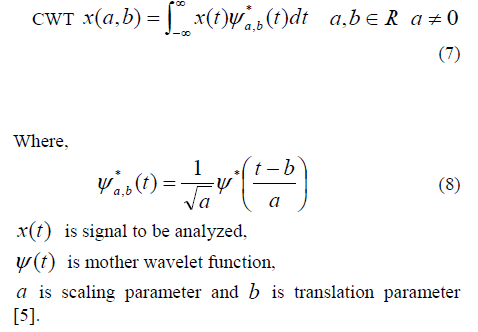 |
| The mother wavelet is chosen to provide a prototype for all windows in the process. All the windows used for the dilated, compressed and shifted are the versions of the mother wavelet. unlike Fourier Transform, CWT has an ability to create a time- frequency representation of a signal which offers very good time and frequency localization. In other words, CWT divides a continuoustime signal into an equal time intervals and equalfrequency intervals. In CWT, signal is multiplied with wavelets, same as STFT and the transform is computed individually for different parts of the time-domain signal. In [18] CWT and Morlet wavelet function are used for the noise rejection, in combination with multiresolution signal decomposition and reconstruction with db16 are used for detection and estimation of the duration and amplitude respectively of the power disturbance. Visual detection of power quality events in the time–frequency plane is done in [19-20]. CWT is not frequently used because of its computation complexity [42]. |
| E. Discrete Wavelet Transforms Discrete wavelet transform (DWT) uses the discrete values of the signal in time domain. Mathematically the expression for DWT can be given as |
 (9) (9) |
| Where m and n are the integers which controls the wavelet dilation and translation respectively, o a is a fixed dilation step parameter which should be always greater than one and o b is the position parameter, it‘s value should be more than zero. Parameters m and n contain the set of positive and negative integers. The scale-location of the signal in the time-frequency-domain is determined by using equation (10) given below |
 (10) (10) |
| Where, the values of T are the scale-location grid of the signal in time frequency domain according to indexes m and n. In power quality analysis, the discrete wavelet transform is sufficient to classify the power quality problems. It converts a time domain discrete signal to its corresponding wavelet domain. This process is called âÃâ¬Ãâ¢sub-band codificationâÃâ¬Ãâ, which is done by applying digital filter techniques. In theory signal processing, filtering a given signal n f means making a convolution of this signal. DWT evaluation has two stages shown in Fig 3 |
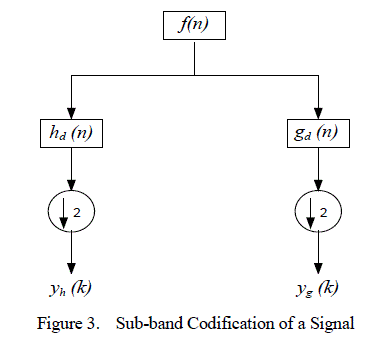 |
| The n f signal is passed through a low-pass and a highpass digital filter h (n) d and g (n) d respectively. Half of the signal samples are then eliminated which is indicated by . DWT evaluation involves two steps. In first step the âÃâ¬Ãâ¢wavelet coefficients‘‘ are determined. These obtained coefficients represent the signal in the wavelet domain. In the next step, the obtained wavelet coefficients are used for calculating âÃâ¬Ãâapproximation‘ as well as the âÃâ¬Ãâdetailed‘ version of original signal, in different levels of resolutions, in the time domain are done. Output of first level decomposition of signal is first level wavelet coefficient of approximation and of detailed version, which are y (k) h and y (k) g respectively. These coefficients are known as ( ) 1 cA n and ( ) 1 cD n respectively. And can be stated as following |
 |
| When these signals pass through another low pass digital filter then second level wavelet coefficient of approximation and of detailed version can be obtained they can be written as ( ) 2 cA n and ( ) 2 cD n respectively. This process will continued up to âÃâ¬ÃââÃâ¬Ãân-1‘‘ in order to calculate to calculate the âÃâ¬Ãâ¢nâÃâ¬Ãâ level approximated and detailed wavelet coefficients. Wavelet transform in time domain can be determined only after calculation of all wavelet coefficients. This is obtained by the process known as âÃâ¬Ãâ¢rebuildingâÃâ¬Ãâ the corresponding wavelet coefficients, along the different resolution levels. Thus we get the approximated and the detailed version of the signal, cA (n) j and cD (n) j respectively, and corresponding wavelet spectrum is also obtained [23]. In [24] author has presents an approach, using the discrete wavelet transform (DWT) analysis, which is able to provide the detection and time location of power quality problems.[41] presents DWT based power quality index. In [43] the use of DWT in low frequency application of power system has been proposed. The low frequency in power system may lead to blackout. In [24] DWT is used presents an approach which is able to provide the detection, time location and the identification of power quality problem in which the signal is first decomposed in wavelet transform. Later, using the obtained wavelet coefficients, feature extraction is done and an Artificial Neural Network is developed for classification of the power quality disturbances. |
| F. Multiresolution analysis |
| Multiresolution analysis technique of wavelet is used in analysis of waveforms and images [52-56]. Wavelet functions and scaling functions are used as building blocks to decompose and reconstruct the signal at different resolutions in Multi Resolution Analysis (MRA). In MRA two filters scheme is utilized in each level, in which one is low pass filter and another is high pass filter shown in figure below, |
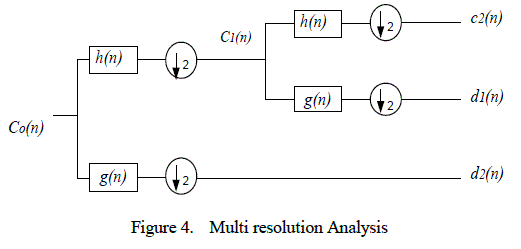 |
| Let the signal ( ) 0 c n is discrete time signal scattered in two levels. This signal is filtered into low frequency component level 1( ( ) 1 c n ) by using low pass filter ( h(n) ) and into high frequency component level 1( ( ) 1 d n ) by using high pass filter ( g(n) ). This signal is then passed through down sampling this can be shown by the relation given in eq.(13)-(14). |
 (13) (13) |
 (14) (14) |
| g(n) and h(n) are high pass and low pass filters respectively. |
| The component obtained after level MRA analysis level 1 will be initial signal for MRA level 2. This signal is then passed through low pass filter and high pass filter. The filter‘s output are the high frequency component in level 2 as relation in eq.(15)-(16). |
 (15) (15) |
 (16) (16) |
| In [23] the author proposed a wavelet Multi-Resolution Analysis (MRA) technique based model which was used to decompose the signal into various details and approximation signals, and unique features from the 1st , 4th, 7th and 8th level detail are obtained as criteria for classifying the type of disturbance occurred. |
| G. Application of wavelet transform in other fields of power system |
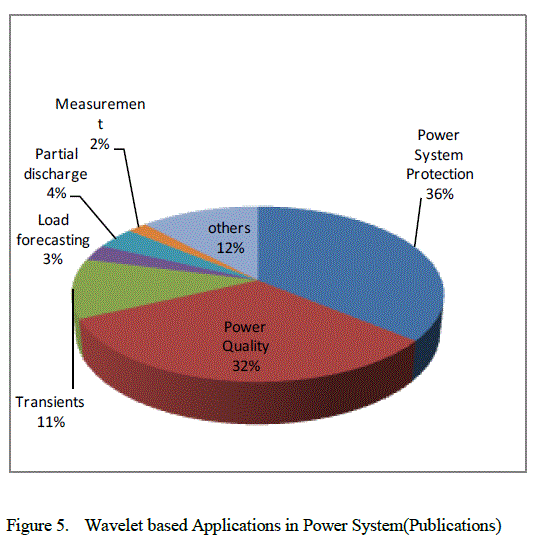
| Wavelet transform has been implemented in following several fields of power system in last few years |
| • Power quality |
| • Power system protection |
| • Power system transients |
| • Partial discharge |
| • Load forecasting |
| • Power system measurements. |
 |
IV. DE-NOISING |
| In power quality analysis, the signal captured, for identifying the types of disturbance, is often polluted by harmonics and noises. The presence of noises in the signal creates a problem in the feature extraction of the signal and it becomes a very difficult task when the existing noise has high frequency spectrum. Generally the disturbances in power system has high frequency spectrum therefore if the noises present in the signal also has high frequency spectrum then the frequency of both, the noise and the fault or disturbance, will overlap with each other and it become difficult to identify the disturbance. To overcome this difficulty and to improve the performance of the system a suitable de-noising scheme to be incorporated into the system so that the classification system become workable even in a noisy environment [33, 34]. In [29] the author tested the performance of his proposed method in different noisy environments, different levels of noises with the signal to noise ratio (SNR). The overall accuracy of classification capability of proposed method was found 95.81%. In [34], it is clear that if the signals are cleared from noises, the start and end of the disturbances can be easily detected due to variation in amplitude of the DWT coefficients about those particular points and the duration of occurrence can then be determined. In [57] author has given an overview of wavelet based threshold methods for de-noising of power signal. In [58] author has proposed two standard statistical hypotheses test-based de-noising procedures for power quality improvement. In [59] author has proposed a de-noising approach to detection of transient disturbances in a noisy environment in power quality monitoring system. |
V. CONCLUSION |
| This paper presents comprehensive survey on the development of technologies used in power quality analysis, which is the major area of research in the field of power system. For detecting and characterizing power system disturbances wavelet based systems have been found to be more robust and effective. From the analysis of the literature it may be concluded; |
| • One of the promising issues in field of power quality is development of high speed automatic system for the identification, detection and classification of disturbance. |
| • The different techniques of wavelet are used to build new models for analysis of power quality events. |
| Thus the scope for future applications includes online monitoring, fault classification and real time control system. |
References |
|