ISSN ONLINE(2319-8753)PRINT(2347-6710)
ISSN ONLINE(2319-8753)PRINT(2347-6710)
Sunilsing Rajput, Dr. D.S. Deshmukh
|
| Related article at Pubmed, Scholar Google |
Visit for more related articles at International Journal of Innovative Research in Science, Engineering and Technology
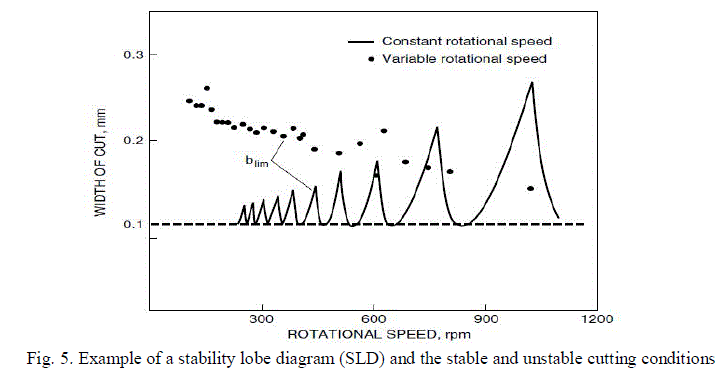
Chatter is a self-excited vibration which occurs in milling machines while operating at high speed. This is an undesirable phenomenon which has negative effects, such as poor surface finish, unacceptable accuracy, excess noise, tool wear and lower Material Removal Rate (MRR). Chatter is self-excited vibration which can occur by various phenomenon’s like Frictional chatter, thermo-mechanical chatter, Mode Coupling Chatter and very importantly regenerative chatter. Prediction and detection of chatter is very important in milling machine tool, which gives guidance to the machine tool user for an optimal selection of depth of cut and spindle speed, which results in higher material removal rate with high accuracy, with less vibrations. Chatter prediction is very complicated phenomenon in machine for its avoidance. In this paper, various methods are presented for the prediction of chatter. Analytical and experimental methods are presented in this paper for the chatter control which gives idea for the selection of optimal speed and depth of cut from the stability lobe diagram (SLD) and easiest method for chatter prediction is suggested. Stability lobe diagram is an effective tool which helps the operator to select specific spindle speeds for avoidance of chatter in machine. Stability lobes are plotted against axial depth of cut vs. spindle speed, which shows a boundary between stable and unstable regions.
Keywords |
| Chatter, Chatter frequency |
INTRODUCTION |
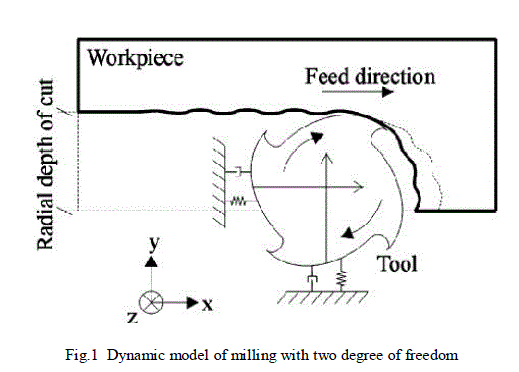
| Vibrations in the machine-tool system are a well-known fact in causing a number of machining problems, including tool wear, tool breakage, machine spindle bearings wear and failure, poor surface finish, inferior product quality and higher energy consumption. Vibrations can be classified in a number of ways according to a number of possible factors. For instance, vibrations can be classified as free vibrations, forced vibrations and self-excited vibrations based on external energy sources. It is useful to identify vibrations types in machine tools. The basic principles of the three vibrations above can be found in most textbooks in the subject area [1-2], but the contents discussed below are a vibration control in machine tools and provide fundamental concepts for avoidance of regenerative chatter. The machine tool chatter vibrations occur due to a self-excitation mechanism in the generation of chip thickness during machining operations. In milling one of the structural modes of machine tool-work piece system is excited by cutting forces initially. An oscillatory surface finish left by one of the tooth is removed by the succeeding oscillatory tooth due to structural vibrations. The resulting chip thickness becomes also oscillatory, which in turn produces oscillatory cutting forces whose magnitudes are proportional to the time varying chip load. The self-excited cutting system becomes unstable, and chatter vibrations grow until the tool jump out of the cut or breaks under the excessive cutting forces. Thus the chatter vibrations continue which reduces the material removal rate. This theory is presented by Tobias&Tlusty [2]. Chatter cannot be easily detected. Various methods are available for its detection and avoidance. Some of the methods are presented in this paper for the chatter prediction. |
II. ANALYTICAL METHOD |
| An analytical method of predicting stability limits is firstly presented by Tobias and Tlusty [2]. Then new method for the analytical prediction of stability lobes in milling is presented by Altintas and Budak [3] The prediction of chatter vibrations between the cutter and workpiece is important as a guidance to the machine tool user for an optimal selection of depth of cut and spindle rotation, resulting in maximum chip removal rate without this undesirable vibration. This can be done by some approaches. In this, an analytical method is applied in which the time-varying directional dynamic milling forces coefficients are expanded in Fourier series and integrated in the width of cut bound by entry and exit angles. The forces in the contact zone between cutter and workpiece during the cut are evaluated by an algorithm using a mathematical model derived from several experimental tests with a dynamometer located between the workpiece and machine table. The algorithm results depend of the physical properties of the workpiece material and the cutter geometry. The modal parameters of the machine-workpiece-tool system like natural frequencies, damping and residues must also be identified experimentally. At this point, it is possible to plot the stability lobes to this dynamic system. These curves relates the spindle speed with axial depth of cut, separating stable and unstable areas, allowing the selection of cutting parameters resulting maximum productivity, with acceptable surface roughness and absence of chatter vibrations. |
 |
III. EXPERIMENTAL METHOD |
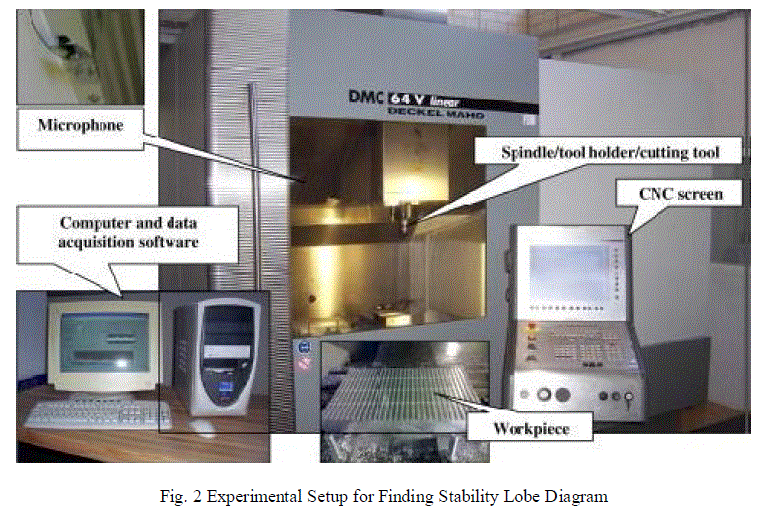
| Experimental method aims to obtain stability lobe diagram by conducting a series of experiments on work piece by machining it using a milling machine tool. Tonshoff [8] showed that, while machining at a certain depth of cut along the tool path, forced vibrations turn into self-excited vibrations and the milling process becomes unstable. This principle is used in various experiments to determine chatter. Guillem Quintana proposed a method of obtaining stability lobe diagram completely by experimental method as shown in figure 2. A tapered work piece was machined in a milling machine tool. While machining at a particular speed, the axial depth of cut increases owing to the tapered geometry and after certain point, chatter occurs. Chatter is detected if the energy of the measured signal exceeds a certain threshold value. The signals from microphone were recorded in PC and analyzed for chatter frequency. Various software such as labview, cutpro [11], metalmax [9], and Harmonizer [10]are used in monitoring and recording the data from microphone. A suitable DAQ assist was used for acquiring the sound signal during machining. The Fast Fourier Transform (FFT) was calculated from audio signal to obtain frequency domain. The graph shows high sound level during chatter period and low amplitudes for chatter free operations. The critical frequency levels are noted in all experiment cases and stability lobe diagram is plotted based on the experimental results. This procedure is repeated for various depth of cut and spindle speed combinations. |
 |
IV. HARMONIZER FOR MOBILE |
| Metalmax Harmonizer [9] is available for mobile now for the chatter prediction. This software records vibration sounds from milling machines using the built-in microphone on android or iOS platform. In this it analyses the sound file for chatter vibration, and if chatter is present, it recommends a new spindle speed which reduces the chatter. |
 |
V. PORTABLE DIGITAL ASSISTANT |
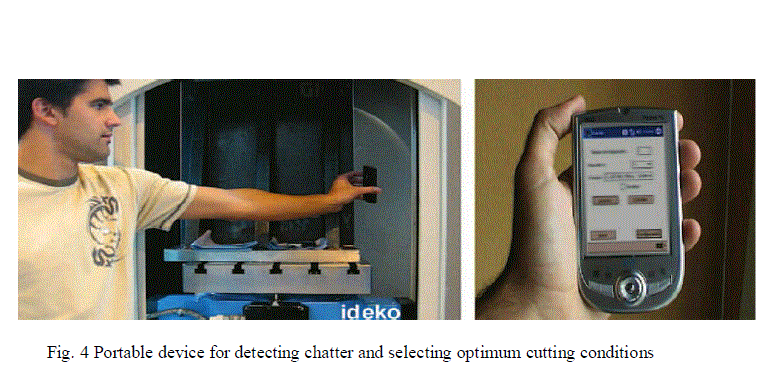
| The automatic spindle speed selection strategy [6] and the chatterdetection and diagnosis algorithmwere implemented in a portabledigital assistant (PDA) using the PDA’s high-impedance microphoneUsing a microphone in an industrial environment, however, can prove problematic, and so the apparatus must be inclose proximity to the noise source (the machine in question).Furthermore, the low sensitivity of the transducer (microphone),non-flat response over the dynamic range and its low resolution atlow frequencies can slightly distort the magnitude of chatter.One of the major advantages of a portable device is themobility it provides, and this makes it easy to go straight to amachine with no need to take along computers or sensors in orderto analyse the process. These devices also provide an immediateresponse, since the right speed to prevent chatter vibration issupplied in a matter of seconds. The acquisition and analysisprogram is also operator-friendly. The application was designed to be used by people with no knowledge of signalanalysis, the apparatus is extremely intuitive, and it may be usedby any shop employee with no additional training. Finally, the factthat it requires no external sensors or data acquisition cards, using only its built-in microphone, makes the automatic spindle speedselection platform much cheaper. |
 |
VI. STABILITY LOBE DIAGRAM (SLD) |
| The two-dimensional stability lobe theory deals with the stability of solutions for dynamical cutting systems, which usually stands for the spindle speed and axial depth. Fig.1 shows an example of stability lobe diagram. As a function of these two cutting parameters, the border between a stable cut (i.e., chatter-free) and an unstable one (i.e., with chatter) can be visualized in a chart called stability lobes diagram (SLD). In the middle of the 1990s, Altintas and Budak [9] presented a analytical form of the stability lobe theory for milling. Both of these stability lobe theories can help to select the appropriate cutting parameters of the spindle speed and axial depth to avoid chatter in machining processes. Stability studies have two important research approaches. On the one hand, many authors have studied it through machine behaviour, assuming a rigid work piece. The tool tip transfer function is elaborated through models or experimental approaches. On the other hand, most of the previous models made the assumption that spindle-tool set dynamics do not change over the full spindle speed range. This assumption needs to be reconsidered in HSM, where gyroscopic moments and centrifugal forces on both bearings and spindle shaft induce spindle speed dependent dynamics changes. Few studies were also done considering the flexibility of work piece. For accurate dynamics prediction, spindle speed-dependent dynamics must be evaluated. Figure 5, shows the SLD curve for stable and unstable zones. |
 |
| The steps involved in the prediction of stability lobe diagram are given below: Initially, the dynamic characteristics and milling process parameters of the machine-tool-workpiece system are obtained using experimental analysis. Then the frequency response function is determined after selecting the natural frequency and exciting frequency. Using FRF, stability milling limits are estimated and the stability lobe diagram is obtained. Prediction of lobes can be done by analytical method, semi analytical method and experimental method. |
VII.CONCLUSION |
| The vibrations in milling machines should be minimized for higher material removal rate (MRR). Chatter is the instability phenomenon must be avoided in milling machines by using stability lobe diagram. The main advantage of the chatter prediction through the stability lobes diagram is the metal removal rate maximization, at the same time avoiding the adverse effects of chatter vibrations like the poor surface finish, noise and breakage of tools. |
References |
|