ISSN ONLINE(2319-8753)PRINT(2347-6710)
ISSN ONLINE(2319-8753)PRINT(2347-6710)
Kirubakaran.B1, Raghupathy.U.S2
|
| Related article at Pubmed, Scholar Google |
Visit for more related articles at International Journal of Innovative Research in Science, Engineering and Technology
Lung cancer causes 1.4 million deaths per year worldwide. Lung cancer is usually diagnosed at advanced stage which is not curable. The lung cancer can be cured if diagnosed at an early stage. The current diagnostic methods like Computed Tomography, Biopsy are invasive and expansive. The Volatile Organic Compounds (VOC) present in the exhaled breath acts as biomarker of lung cancer. The VOC’s are produced as result of metabolism of cells present in the lungs. The measurement of VOCs in exhaled breath will provide a noninvasive technique for assessing lung pathology, and some of which are associated with Lung Cancer. The VOC’s can be analyzed using gas sensors. Here an array of gas sensor consisting of six sensors capable of detecting VOC is used to analyze the exhaled breath of human for the prediction of possibility of lung cancer.
Keywords |
| Exhaled breath, VOC, Lung Cancer, Gas sensor |
INTRODUCTION |
| Lung cancer causes the most of death from cancer, next followed by colorectal cancer, breast cancer, and stomach cancer. The most common cause of lung cancer is long-term exposure to tobacco smoke, which causes 80–90% of lung cancers. Nonsmokers account for 10–15% of lung cancer cases, and these cases are often attributed to a combination of genetic factors and exposure to asbestos and other pollutions .Lung cancer can be classified into two main subtypes, small cell lung cancer (SCLC) and non-small cell lung cancer (NSCLC). Regardless of subtype, the survival of people affected with lung cancer is partly related to clinical diagnosis. The lung cancer is frequently diagnosed at an advanced stage when treatment is less effective. The diagnosis of lung cancer is made from a biopsy taken of a lung nodule or mass found during the evaluation of symptoms or found during the imaging. The advancement in computed tomography (CT) imaging has led to detection of small lung nodules. The evaluation of these nodules is costly, typically requiring serial imaging. A simple to use, inexpensive, noninvasive, and accurate lung cancer test would be a major advance in the management of lung cancer and the evaluation of lung nodules. The VOC present in the exhaled breath acts as the biomarker of lung cancer. Exhaled breath is largely composed of nitrogen, oxygen, carbon dioxide, water, and inert gases. Volatile substances that are generated in the body or absorbed from the environment make up the rest of the breath. Several classes of VOCs can be measured in the exhaled breath. The VOC’s include saturated and unsaturated hydrocarbons, sulfur-containing and nitrogen-containing compounds. Saturated hydrocarbons are formed during lipid peroxidation of fatty acid components of cell membranes, triggered by Reactive Oxygen Species. They are felt to be markers of oxidative stress. Smaller quantities may be produced by protein oxidation and colonic bacterial metabolism. They have a low solubility in the blood and hence are excreted in the breath within minutes of their formation. Unsaturated hydrocarbons are also detected in the exhaled breath.In total 3481 different VOCs were identified, in that 27 are common to all humans. The quantity of VOCs varies oxygen administered differs in smokers versus nonsmokers and differs with age. There was also a significant difference in the concentration VOC content between the healthy and cancer patients. Hence the analysis of VOC content will be useful in the prediction of possibility of occurrence of lung cancer. |
LITERATURE SURVEY |
| Y. Broza et al., proposed the feasibility of nanomaterial-based sensors for identifying the breath-print of early-stage lung cancer and for short-term follow-up after LC-resection. LC breath prints could possibly be utilized in a diagnostic breath test for LC to complement the current diagnostic methods and to increase the sensitivity f LC prediction prior to surgery, making swifter treatment decision possible. Susan C. van’t Westeinde et al., proposed that the biomarker analysis of lung cancer can be used as adjunct with the computerized tomography to reduce the false test positive results associated CT scans. It is also proposed that the exhaled breath analysis can be used as short term follow-up after lung tumor resection. Simeng Chen et al., proposed that sensor-based electronic noses can be used as clinical diagnostic tool which will be noninvasive but they generally suffer from significant weaknesses that limit their widespread application in clinical diagnosis such as sensitivity to temperature, humidity, interference with other gases. |
EXHALED BREATH ANALYSIS |
| The exhaled breath can be analysis can be done in two phases. First one is in gaseous phase and second one is in liquid phase as exhaled breath condensate. IN the gaseous phase the exhaled breath can be analysed using one of the following methods such as Chemiluminescence analyser, Gas chromatography and Electronic nose system. The electronic nose system consists of array of gas sensors which are capable to detect the VOC’s. Data obtained from the sensor array can then be analyzed by statistical or structural algorithms to discriminate and identify volatile patterns. The electronic nose system is finding an important role in the analysis of exhaled breath and found to be an accurate system. |
METHODOLOGY |
| The proposed method uses gas sensor array to detect the VOC’s present in the exhaled breath. The signal from the sensors is acquired using Data Acquisition Card and given to LabVIEW for further processing. The process flow of the proposed method is shown in the Figure 1 |
 |
| The proposed method uses six sensors manufactured Figaro sensors. These sensors have sensitivity towards the various biomarker VOC’s of Lung cancer. The sensors conductivity changes according to the concentration of the gas they are sensitive. The Table 1 shows the sensors used and the target gases they are used to identify. |
 |
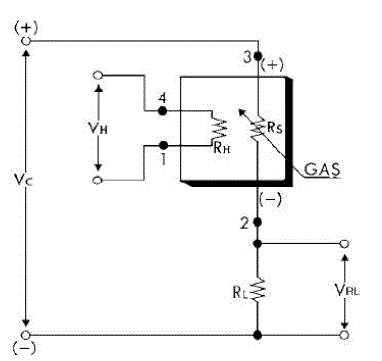
| A simple signal conditioning circuit can convert the change in conductivity to an output signal which corresponds to the gas concentration. The signal conditioning circuit used to convert change in conductivity to voltage is shown in the Figure 2 |
 |
| The signal from the sensors is in the terms of voltage and it is acquired using LabVIEW. The signal from the sensor consists of noise and hence lowpass filter is used in LabVIEW to eliminate the noise. The signal analysis tool box is then used to obtain the features of interest from the signal which is useful in the prediction of lung cancer. The features considered are given below |
| 1) Rate to Peak Value: |
| It is the measure of rate at which the signal reaches its maximum or peak value and is given in the units of millivolt per second (mV/s). |
| 2) Peak Value: |
| It is the maximum value of the signal from the sensor and it is given in the units of millivolt (mV). |
| 3) Mean Value: |
| It is the average value of the signal over the period of acquisition of the signal and it’s unit is millivolt (mV). |
RESULTS AND DISCUSSIONS |
| The breath analysis was done using the proposed system to a total of 36 subjects which includes three classes. The subject details is shown in the Table 2 |
 |
| The features of interest mentioned above were extracted from the signal acquired from the subjects using sensors. There was significant difference in the features extracted from the signal of the sensors TGS 2600, 2602 and 2620 when compared to others. The features of the above sensors were plotted for the all 36 subjects. |
| 1) TGS 2600: |
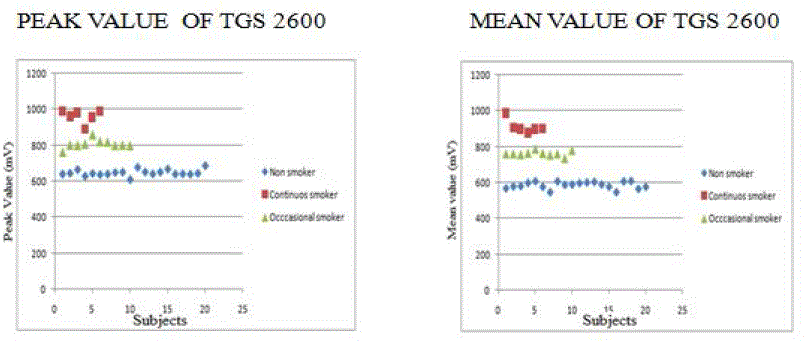
| The voltage from the TGS-2600 showed significant difference in Peak value and Mean value between the three classes. The plot of mean and peak value of TGS 2600 is shown in Figure 3 |
 |
| The peak value of continuous smoker (975±23 mv) is higher than Non smoker (630± 15 mV) and the mean value of continuous smoker (900±30 mV) is higher than Non smoker (590±10 mV) |
| 2) TGS 2602: |
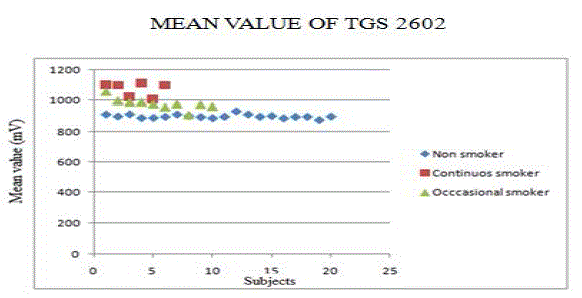
| The voltage from the TGS 2602 showed significant difference in mean value between the three classes. The plot of mean value of TGS 2602 is shown in Figure 4 |
 |
| The Mean value of Continuous smoker (1100±60) is higher than Non smoker (900±20 mV) |
| 3) TGS 2620: |
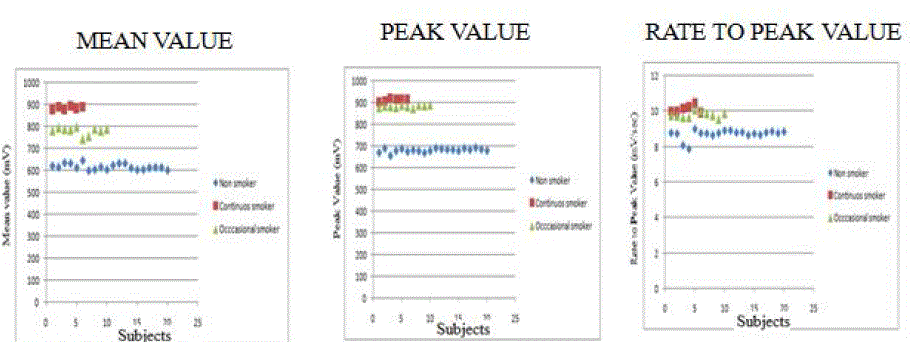
| The voltage from the TGS 2620 showed significant difference in Peak value, Mean value and Rate to Peak Value between the three classes. The plot of mean and peak value of TGS 2600 is shown in Figure 5 |
 |
| The mean value of continuous smoker (890±15 mV) is higher than Non-smoker (650±20mV). The peak value of continuous smoker (920±25mV) is higher than Non smoker (670±15 mV). The Rate of rise to peak value is higher for continuous smoker (10±0.5mV/s) than Non smoker (8.5±0.4mV/s The above observations show that the concentration levels of Iso-Butane, Ethanol and Carbon-Monoxide differs between smokers and Non-smokers. The Iso-Butane, Ethanol and Carbon-Monoxide are the important biomarker VOC’s , hence the continuous smoking subjects have more possibility of cancer occurrence. |
CONCLUSION |
| The exhaled breath analysis system using gas sensors was able to detect the VOC’s present in the exhaled breath of human. The output of the system showed significant difference in the features of interest between the various classes of subjects. The smoking subjects showed higher concentration of VOC’s hence there is an higher possibility of occurance of Lung cancer for them. According to the literature it can be further developed to identify the Lung cancer at its early stage and it will be non-invasive method. |
References |
|