ISSN ONLINE(2319-8753)PRINT(2347-6710)
ISSN ONLINE(2319-8753)PRINT(2347-6710)
| Hina Fathima.A, Priya. K, Sudakar Babu.T, Devabalaji.K.R, Rekha.M, Rajalakshmi.K and Shilaja.C School of Electrical Engineering, VIT University, Vellore, India. |
| Related article at Pubmed, Scholar Google |
Visit for more related articles at International Journal of Innovative Research in Science, Engineering and Technology
This paper accounts for the problems existing in conventional methods for generating electricity and presents an overview of various renewable energy generation technologies that are being developed to promote green energy. A brief insight into the Indian power scenario is given and the advantages and disadvantages of conventional generation are outlined. A statistical analysis is carried out by using ANOVA and other statistical tools to verify the extent of greenhouse gas emissions by power sector. In addition the development of renewable energies in India has been analyzed. Also a brief overview of the world scenario on current and future scope of development in renewable energy is outlined.
Keywords |
| Power Generation, Thermal Power, Solar power, Wind power, Green energy, Hydrogen Energy, Pollution. |
INTRODUCTION |
| Humankind has been blinded by its need for power to acknowledge the havoc it’s creating on the earth’s ecosystem. The resulting fuel depletions and climate changes have driven us to an energy crisis. This has made us realize the urgency for finding alternative sources for quenching the ever growing demand for energy. The conventional sources of energy are all mostly non-renewable sources of energy. Their extensive usage has caused their known reserves to be depleted rapidly. In India alone the known deposits of petroleum are envisaged to last only a few decades, whereas coal reserves will last for just another hundred years. Solving this energy crisis needs combined efforts from economies all over the world, which is possible only with universal supports from the ruling governments. The rising costs of energy have started to force global leaders to realize the importance of research on alternative sources of energy. Hopefully this will drive the power hungry nations to find ways to stop further deterioration of our planet. |
| Generally, Renewable sources of energy refer to those sources that are naturally replenished in a continues manner. They are also referred to as Green Energy or Clean Energy as they do not emit carbon-di-oxide or other greenhouse gases. The world’s total electricity consumption in 2012 was a whopping 3,044.4468 KWh per capita [1]. India alone generated about 880 billion units of power in 2012 of which 66% came from fossil fuels and 12% from renewable sources [2]. India ranks third in the world in Carbon-di-oxide emissions with an aggregate of 1745.1 million tons in 2011. The country’s nuclear generation is about 4,780 MW which contributes about 3% of nation’s power generation. India is planning to increase this to 10% by 2022 which requires an investment of $65 billions. After the Fukushima Daiichi nuclear disaster in 2011 many concerns have come up regarding safety of such plants in case of natural disasters. This drives home another fact that Renewable Sources of energies need to be researched and implemented to meet the power demands as they have no such environmental effects. |
| The objective of this paper is to explore the current energy scenario of the World and India in particular, and the various problems due to use of conventional energy sources. An effort is made here to conduct a diagnostic study on the situation of problems in current energy scenario. It lists out the alternative sources of energy now sought to promote the concept of green energy. This paper is structured as follows: Section II gives the overview of Indian power scenario which expounds the role of conventional energy in power generation. It also entails the problem faced due to excessive consumption of fossil fuels and other conventional energy sources. Section III gives a brief account of the various sources of Green Energies now explored for power generation. Section IV has two parts. In the first part a data analysis is done on the secondary data obtained on carbon emissions from the developed countries to signalize the role of power generation in green house emissions. The second part is an assessment on the research works carried on in India on Green Energy to gain an overall perspective regarding promotion of renewable energies. Section V gives the world scenario on current and future development in green energy. The paper concludes with an overall assessment of results gained from data analysis and future scope for Green Energy. |
II INDIAN POWER SCENARIO AND PROBLEMS IN CONVENTIONAL ENERGY |
| The total electricity produced in India as on 31-10- 13 is 2,29,251.74 MW. Electricity produced by renewable energy sources in the country is 28,184.35 MW excluding Hydro power which contributes 39,818.40 MW. But since we are discussing conventional generation Hydro power is here shown separately. Fig.1 depicts the power generation by the various sectors graphically. The conventional energies are nonrenewable in nature and are used since long time. These energies are used extensively such that their reserves have been depleted to a large extent. It is very difficult to exploit their new deposits. Coal reserves are decaying slowly. The conventional energy sources for generation of electricity are coal, petroleum, natural gas and nuclear reactors. The main conventional energy sources used in India for generation in large scale are Thermal power (burning coal, gas and oil) and Nuclear power. |
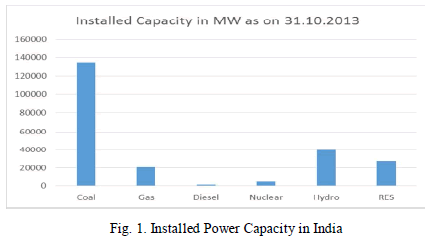 |
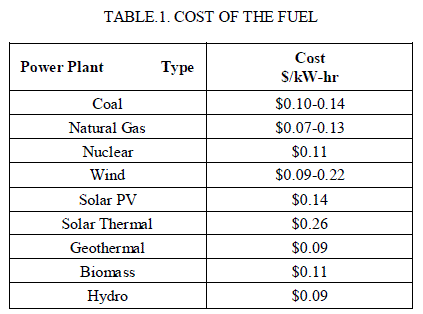
| i. Thermal power plant: Thermal power generation is the largest contributor to electric power generated in India. The fuels used in thermal power plants are Coal, Natural Gas and Diesel etc. The power generated by the thermal power plant in India as on 31-10-13 is 156468.99 MW. In the thermal power plant the steam is used to drive a steam turbine. This turbine is connected to an electrical generator. Coal is the most important source of energy for generation of electricity in thermal plants [3]. Use of conventional energy produces air pollution, which is a major source of health problems worldwide. Thermal power plants cause greenhouse gas emission such as CO2, SO2 and NO2 which contribute to global warming directly. The other problems in thermal power plants include obtaining fuels from mines, using the fuels and dealing with the wastes. Cost of the fuel and the maintenance and operating costs are high as shown in Table.1 and these cost increases rapidly due to demand. |
| Nuclear power plant: Nuclear power plants give only 4,780 MW of total power generated in the country (as on 31-10-13). The amount of fuel required is very less when compared to conventional thermal power plant and operational cost is also cheaper. Nuclear power plant does not emit greenhouse gases into atmosphere. The major disadvantage of the nuclear power plant is that the nuclear fuel itself is highly dangerous and disposal of radioactive waste is very expensive. Radioactive gases like krypton and Xenon are stored for 40-50 years till they decay to 1% and then are disposed in deep sea [3]. The radioactive rays cause skin disease and cancer to humans. Large quantity of water is required for cooling of reactors. Accidents occurring due to improper cooling can be disastrous leading to disasters like in Fukushima Daiichi nuclear disaster in 2011. Chernobyl like incidents have proved that proper improper operation and maintenance of nuclear reactors. |
| Some other main disadvantages of the conventional energy are Ozone depletion, Global warming and Acid rain. The ozone layer has historically protected the Earth from the harmful UV rays, although in recent decades this protection has diminished due to stratospheric ozone depletion [3]. This "ozone hole" has extended to as large as 10.5 million square miles in September 1998 (NASA). Global warming has caused extensive climatic changes with super typhoons, cold waves etc. occurring more frequently everywhere. Acid rain refers to a mixture of wet and dry deposition from the atmosphere containing higher than normal amounts of nitric and sulphuric acids. Its caused by both natural sources, such as volcanoes and decaying vegetation, and man-made sources, primarily emissions of sulphur dioxide (SO2) and nitrogen oxides (NOx) resulting from fossil fuel combustion. |
III. GREEN ENERGY |
| Growing climatic changes and rapid depletion of fossil fuels is the reality of today’s world. Our ever increasing need for energy has altered the planet in a way that it may become uninhabitable in less than a billion years. It’s high time we realize our responsibility to redeem our planet for it to be sustainable by our future generations. Events like the most |
 |
| powerful “super typhoon” in Philippines in November and a devastating “Airpolycapse” in Chinese city of Harbin in October this year are clear indications of the deteriorating atmosphere. Scientists all over the world have repeatedly voiced their concerns on occurrence of such disasters due to transformation of planet as a result of massive consumption of fossil fuels |
| India is the first country in the world to form a separate Ministry for promoting and implementing nonconventional and renewable energy generation. The MNRE has projected a capacity addition of about 29,800 MW from renewable energy sources during 12th Plan period. It is expected that by the end of the 12th Five Year Plan the contribution of renewable power in the total installed capacity would be in the range of 16 to 17% [2]. |
| Green energy sources which can be used for energy generation are wind energy, solar energy, hydrogen energy, hydro energy (including small hydro and tidal), geothermal energy, biomass and agricultural waste energy. |
| The first three types of energies are receiving increasing amount of interests among researchers. Hence they have been detailed and compared below |
1. Wind Energy : |
| Wind Energy is the most matured energy of all renewable energies. The worldwide installed capacity has touched 282 GW of which 44 GW were added in 2012 alone[4]. Renewable Energy Capacity installed in India as on Mar 2013 was 28 GW, of which Wind Energy claims nearly 70% with an installed capacity of 19.05 GW. The forecasted wind potential in India in 2032 are estimated to be of 45 GW[2]. Industry sources estimate India’s wind potential at 1,00,000 MW. Wind is by far the most viable source of renewable energy and is emerging as the largest source in the renewable energy generation sector. China and USA are the leaders in installed wind capacity and India is ranked 5th in this category. Though we are in a competitive position we are lagging behind in a sense that we are dependent on imported technology for Wind generation. The main reason for failure of Wind turbines viewed recently is due to this fact that these imported machines are not compatible with Indian conditions. So a lot of research needs to be done to bring forward an indigenous technology for Wind power which suits the Indian demand, conditions and Grid codes. |
| India is now one of the Global Manufacturing hubs for Wind Turbines with about 23 large wind turbine manufacturers, capacity ranging from 225 kW to 2.5 MW. India may install more wind capacity than the U.S during 2013 for the first time. The Indian government has initiated many incentives namely the Accelerated Depreciation (AD), the Generation Based Incentive GBI) since 2009 and the Renewable Energy Certificates (REC) since 2010 to promote wind energy. |
| Some concerns of Wind Energy are |
| ïÃÂö Quantity is limited as it depends on vagaries of nature.• Low power quality problems.• Power Evacuation Schemes need to be implemented with proper strengthening of grids.• Expensive and increased tariff. |
| But in combination with other, more reliable sources, wind energy should be used extensively to supplement the demand for energy. So a lot of research is carried on in this area all over the world to enable wind power to emerge as a reliable and economical solution to power the world. |
2. Solar Energy |
| Among the various renewable energy sources, solar energy has attained worldwide recognition; because its plenty of availability, clean energy environment friendly, maintenance lesser, noise less and more reliable. India is most suitable for solar energy receiving highest solar insolation, with 300 sunny days India can generate 600TW of power. 17% of power generated from solar out of total renewable energy sources in installed capacity in India. Solar energy can be produce mainly in two ways of commercial process. 1. Concentrated solar thermal plants (CSP) and 2. Photo voltaic. |
| CSP is most suitable in case of centralized applications, PV cell can used in all decentralized applications. a) Solar power generation: Solar cell is nothing but a PN junction diode, whenever light falls on the solar cell energy absorbed by electrons in the form of heat and moves towards the positive electrode which causes the movement of electrons once circuit closes current flows through it. b) Challenges: solar energy system having some drawbacks, these are initial cost of solar energy system is high, space required more for installation of plant, and life span of the solar cell is less. c) Govt. Support: to overcome the above challenges and to improve the solar energy Government has provided support these are given below. 1) 51 Solar Radiation Resource Assessment stations have been installed across India by the Ministry of New and Renewable Energy(MNRE) to monitor the availability of solar energy. 2) The Ministry of New and Renewable Energy provides 70 percent subsidy on the installation cost of a solar photovoltaic power plant in North-East states and 30 percentage subsidy on other regions. |
3. Hydrogen Energy : |
| Every day hasty increase in fuel cost and depleting nature of fossil fuels has flourished the research on renewable energy sources. Recently, fuel cell technology has been accepted as one of the promising, environment friendly alternative energy resources. In principle, it converts chemical energy to electrical energy with nearly zero emission of greenhouse gases, since there is no combustion process involved in the fuel cell and it involves only electrochemical reaction [5,6]. Fuel cell technology has been remarkably utilized for driving electric vehicle and portable applications, since it replaces the battery technology. The advantages of fuel cell technology include high efficiency, low/zero emissions, high quality reliable power output, light weight and ease of construction. Unlike batteries, fuel cell does not require any charging, but it involves electrochemical reaction to produce electrical current [5- 8]. It supplies the output power continuously as long as it receives the input. It does not emit any harmful gas to the environment and hence fuel cell technology is considered as green technology. A fuel cell converts the input chemical energy to the output electrical energy. In general, the fuel cell has two electrodes and useful electricity; also anode, a cathode and an electrolyte in common. Based on the electrolytes used, operating temperature an it produces water and heat as a reaction by products. The output is in the form of and the kind of fuel used in the fuel cells and other factors determines the fuel cell types [5-8]. Typically fuel cells are classified into the following types such as Polymer Electrolyte Membrane Fuel Cells (PEMFC), Direct Methanol Fuel Cells (DMFC), Alkaline Fuel Cells (AFC), Phosphoric Acid Fuel Cells (PAFC), Molten Carbonate Fuel Cells (MCFC), Solid Oxide Fuel Cells (SOFC) and Regenerative Fuel Cells (RFC). Based on the fuel cell power generation range, it can be used in portable (5 W to 20 kW), transport (0.5 kW to 400 kW) and stationary applications (1 kW to 100 kW) [9,10]. |
IV. SIMULATED RESULTS |
| An effort is made here to conduct a diagnostic study on the situation of problems in current energy scenario. This section has two parts. In the first part a data analysis is done on the secondary data obtained on carbon emissions from the developed countries to signalize the role of power generation in greenhouse emissions. The second part is an assessment on the research works carried on in India on Green Energy to gain an overall perspective regarding promotion of renewable energies. |
A. Analysis of Carbon Di Oxide Emissions |
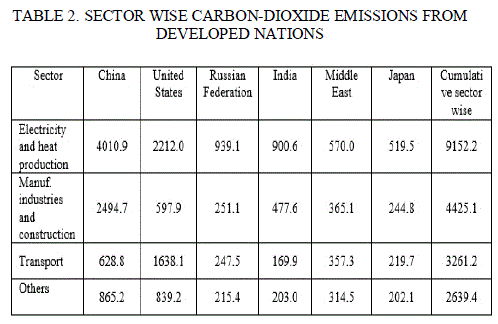
| In this part an analytical study has been conducted on carbon-di-oxide quantities emitted into the atmosphere. Carbon dioxide is an important greenhouse gas, absorbing heat radiation from Earth's surface. The International Energy Agency (IEA) is a Paris-based autonomous intergovernmental organization which serves as an information source on statistics about the international oil market and other energy sectors. According to IEA statistics in 2011 global CO2 emissions were 31.3 GT with a significant 4.9% increase contributed by coal usage alone. Electricity and heat generation accounted for 42% of emissions while transport contributed about 22%. Together these sectors make up for nearly two-thirds of the CO2 emitted. It is noted that between 2010 and 2011, CO2 emissions from electricity and heat increased by 4.4%, faster than total emissions. Hence there is a necessity to replace fossil fuel usage in these sectors. To emphasis this point an analysis has been done below. The amounts of CO2 that were emitted by top 5 developed countries of the world have been collected. This data has then been segregated based on the emitting source into sectors as shown in Table.2. below. The countries included in the sample data are the world’s highest emitters of CO2. This data has been collected from IEA’s annual statistics which accounts for its reliability and accuracy. |
 |
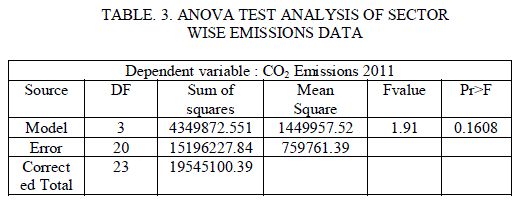
| The above data was subjected to ANOVA (Analysis of Variance) test. This is a statistical test that is intended to analyze variability in data in order to infer inequality among population means. The ANOVA technique extends what an independent-samples t test can do to multiple means. The tests in ANOVA are based on F-ratio. An observed Pr>F value is determined and is checked with an alpha value which is the level of significance. If Pr < α, then it is concluded that the F value is statistically significant indicating that the model accounts for a significant amount of variation in the dependent variable. It means the difference between group means is large enough to not be due to chance [11]. In this case α is kept at 20% and the null hypothesis is that ‘there is no significant difference between emissions by different categories”. The results are shown below in Table.3. |
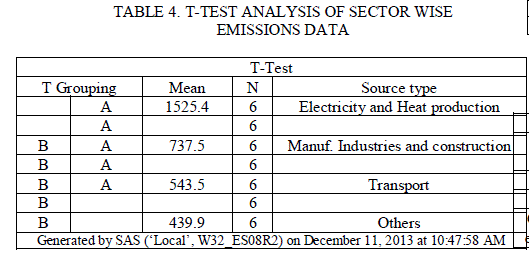
| Inferences from tests: The Pr value generated is 0.1608 and hence Pr<α and null hypothesis is rejected. So we conclude that there is significant difference between emissions by different categories. Further analyses with T-tests were conducted among the sectors to identify which is the highest contributor of CO2. Results are given in Table.4. As shown if the letters in the ‘T Grouping’ are same then there is no significant difference. It is to be noted that T-tests were run on combination of sets and the results prove that Electricity and Heat Production is the major contributor towards CO2 emissions. |
 |
 |
| This reemphasizes the fact that it is necessary to find alternative renewable sources of energy for power generation purposes which will thus reduce green house gas emissions. Works carried on in India on Green Energy to gain an overall perspective regarding promotion of renewable energies |
B. Analysis of Research in development of Green Energy in India |
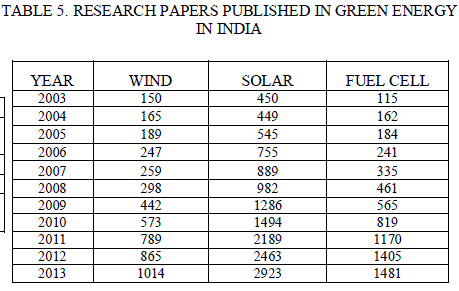
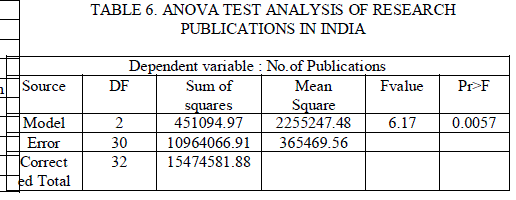
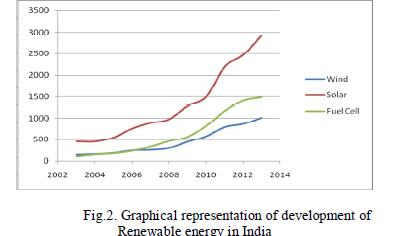
| In this part a descriptive study has been conducted on the research work that is carried out in India on Green Energy. For the purpose of analysis here three sources of green energy namely, Solar, Wind and Hydrogen Energy (Fuel Cells) have been targeted. This is because Solar and Hydro are the most sought after areas in research and rapidly growing in India. Also we have a lot of research work going on in Fuel cells not only for energy generation (as storage systems in Hybrid systems) but also in transport and other sectors to reduce greenhouse gas emissions. The data collected spans over a period of 10 years from 2003-2013. Table.5. gives the data which shows the number of research papers published by Indian researchers under each area. The data was collected from Scopus which is a bibliographic database containing abstracts and citations for academic journal articles. The data in Table.5. was subjected to ANOVA (Analysis of Variance) test. In this case α is kept at 5% and the null hypothesis is that ‘there is no significant difference |
 |
 |
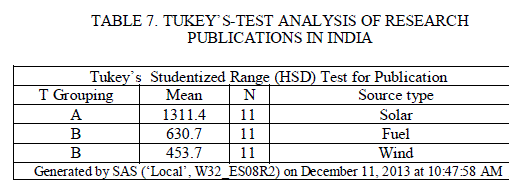 |
| between research categories”. The results are as shown below in Table.6. Inferences from tests: The Pr value generated is 0.0057 and hence Pr < α and null hypothesis is rejected. So we conclude that there is significant difference between the numbers of research papers published in the areas selected. Further analyses with Tukey's Studentized Range (HSD) Test is conducted among the sectors to identify which is the most sought after research area in green energy generation (See Table.7). It is a single-step multiple comparison procedure and statistical test. It is used in conjunction with an ANOVA to find means that are significantly different from each other. The difference in letters in results proves that there is significant difference between Solar and Wind and Solar and Fuel Cell Technology. Fig.2 elaborates this fact. It can be seen that lot of research work is on in developing Solar energy in India. A significant increase can be noted after 2010 when the MNRE launched the Jawaharlal Nehru National Solar Mission which has fuelled the solar research in India. Though wind energy is now the highest contributor to renewable energy in India we are lagging behind in a sense that we are dependent on imported technology for Wind generation. So the Indian Government is taking steps to further this development by providing incentives and REC’s. |
 |
V. WORLD SCENARIO ON GREEN ENERGY |
| From the earlier sections the need for the renewable energy has been established. The renewable generation all over the world varies depending on their resources and demand. This section attempts to give a brief scenario of the current and future developments in Renewable energy worldwide. For the analysis aspect a few countries like United Kingdom, United States of America, Australia and China are considered. United Kingdom - Office for Renewable Energy Deployment in DECC (The Department of Energy and Climate Change) started their condition from a low level as to meet the target to deliver 15% of the UK’s energy consumption from renewable sources by 2020. They also have the potential to put them on a track to deliver a total of 29 GW of operational capacity by 2020[12]. Renewable energy generations obtained in UK are up to 234 TWh (15 %) through separated installations. Where wind thermal comprises more than any other generations. . According to the current information, 90% of Renewable Energy we need for 2020 will be delivered by eight technologies. Some of the government’s targets on renewable energy generation are listed here.• By 2020, The Scottish government will deliver 100% of Renewable Energy.• By 2020, The Northern Ireland Executive has a target of 40% renewable electricity delivered and 10% of renewable heat.• By 2025, The Welsh Government has indicated to produce twice the amount of electricity, and delivers 4 GW of marine energy. |
| The total consumption of renewable energy is also increased effectively from 2005[13]. This implies that renewable energy has started its key role in the power generation field. The target is set for 12.5% by 2020, which is already on its way so there is an aspiration of 20% by 2020. |
| United States of America - USA strongly believes that there is a deep irony at work in the intersection of energy and the environment. The biggest solutions are to decarbonize our electricity system by building renewable energy projects, linked to cities and large urban centres with new transmission lines. The renewable energy in USA is emerging into the power generation field due to the increase in outages [14]. Due to the consumption of energy increases the demand and generation ratio has been affected badly. The outages are increased in a past 2 decades comparatively. The target is established by the government of An America powered by 80 percent lowcost, reliable renewable energy is within our technological reach. Australia - The Australia Renewable Energy Agency (ARENA) developed different hub for generation of renewable energy. Solar energy project involved CSIRO (The Commonwealth Scientific and Industrial Research Organization) constructing Australia’s largest solar thermal research hub at the CSIRO National Solar Energy Centre in Newcastle, New South Wales. The hub comprises a 30 meter high solar tower surrounded by a 4000 m2 field of 450 locally-manufactured customdesign mirrors (heliostats), capable of generating temperatures of up to 1500°C [15]. Some innovations are also going to take place by CSIRO. They are also using the facility to develop and test solar air turbines that generate electricity from air and sunshine alone. This is a new area of solar research [16]. With ARENA’s support, a 1MW wave energy device has designed and constructed by Oceanlinx to convert the ocean’s power into electricity and is now preparing to commission and test how well it can feed this into the national electricity grid for 12 months. Apart from this generation three different techniques were also obtained [17]. |
| China - China’s total energy supply from renewable energy is demonstrated an average annual growth rate of about 12% between 2000 and 2010 and substituted 293 million tonnes of coal equivalents by the end of that period. China became the world's biggest wind-using country in 2010-12 when its market share reached 21.8% for cumulative installations and 46.1% for new wind power installations [18]. By that time, the wind power industry entailed about 260,000 jobs. Other renewable energy sectors grew as well, such as solar PV, solar water heater or biomass. The production of photovoltaic cells, for example, reached 8 GW in 2010, and the annual growth rate consistently exceeded 100 per cent in the preceding five years.13 its global market share reached nearly 50 per cent, and approximately 93 per cent of the cells were exported to the European Union and other countries. Renewable energy strengthened the Chinese economy. In 2010 the total amount of GDP produced by the renewable energy industry was close to 417 billion Yuan (US$63 billion), accounting for 1 per cent of the total GDP. Additionally, the growth in renewable energies created more than 4 million jobs in China by 2010. China has established and attained half way through their target China’s leadership has increased its target for domestic solar power capacity 8 times over in the past couple years, from 5 GW to 40 GW by 2015. |
VI. CONCLUSION |
| In this paper the power generation scenario of the world has been studied and the implications of usage of conventional sources on the atmosphere outlined. A quantitative analysis was conducted on the CO2 emissions into the atmosphere and it was proved with statistical tests that electrical power and heat generation is the major contributor all over the world. This clearly emphasizes the need for finding and implementing alternative sources of energy for production of electric power to save further deterioration of the environment. Some green energy sources have been explored and compared and their development in India has been analysed based on statistical tests. The paper concluded with an overview of green energy developments and their future estimated potentials in countries all over the world. |
References |
|