International Journal of Innovative Research in Science, Engineering and Technology
ISSN ONLINE(2319-8753)PRINT(2347-6710)
ISSN ONLINE(2319-8753)PRINT(2347-6710)
Jeniffer Sylvia D1, Jhansi Lakshmi V2, Renuka Devi P3
|
| Related article at Pubmed, Scholar Google |
Visit for more related articles at International Journal of Innovative Research in Science, Engineering and Technology
Various applications of Manganese Peroxidase such as transformation of dyes, biobleaching, biopulping, treating wastewater contaminated with phenols, chlorinated phenol & cresols enhances the interest for further study on the enzyme. The present aim of the study is to purify Manganese peroxidase from plant source Musa acuminata stem, an agro waste and to monitor its effect on effluent degradation. Manganese peroxidase was extracted from Musa acuminata stem juice using 0.1M Phosphate buffer, Ammonium Sulphate precipitation & Dialysis techniques were carried out to partially purify the enzyme. Column chromatography was packed with silica gel and chloroform with 0.1M Phosphate Buffer as elution buffer to achieve 10.8 fold purification with 32% enzyme yield, specific activity was found to be 24.5 U/mg. The Km and Vmax value with MnSO4 as variable substrate were calculated from MM and double reciprocal plots. The pH and temperature of the enzyme were optimized. The FTIR analysis of the degraded effluents was analyzed.
Keywords |
| Manganese Peroxidase, Column chromatography, FTIR |
INTRODUCTION |
| Musa acuminata, [Banana] is the mostly consumed fruits in the world and India produces banana wastes like fruit peel, pseudo stem and stalks in abundance. Fermentation is the major step for enzyme production from banana stalks [Asgher et al., 2013]. Manganese Peroxidase (MnP; EC 1.11.1.13), was an extra cellular glycosylated enzyme, greatly produced from Phanerochaete chrysosporium and a variety of lignin degrading white-rot fungi. Many Mn peroxidases have been purified from extra-cellular medium of a wide variety of fungal species including Dichomitus squalens, Ceriporiopsis subvermispora, Lentinus edodes, Trametes versicolor, Phlebia radiata, Pleurotus ostreatus, Panus tigrinus [Jha et al., 2011]. Recently, manganese peroxidase (MnP) have been applied to numerous processes such as in biopulping, biobleaching, bioremediation, delignification, oxidation of organic pollutants, stabilization of fruit juices, biosensors development, biofuels cells, textile bio finishing, beverage processing, animal feed stuffs, cosmetics, detergent manufacturing and transformation of antibiotics and steroids. |
II.MATERIALS AND METHODS |
MnP EXTRACTION & PURIFICATION |
| The banana (Musa acuminata) stem was crushed in mortar with pestle with the addition of phosphate buffer and the juice was extracted using a sterile four layered muslin cloth. To partially purify the enzyme, enzyme extract was subjected to 60% Ammonium Sulphate precipitation to salt out the enzyme. This is based on the method followed by Kharatmol et al., 2012. Dialysis was done to remove the salt from the sample. The precipitated enzyme was dialyzed with phosphate buffer according to the method followed by Ãâ¦ÃžiÃâ¦ÃŸecioÃâßlu et al., 2010. The separation can be liquid/solid (adsorption) or liquid/liquid (partition) in column chromatography. To purify the compound column chromatography was been carried out. The adsorbent used was silica gel and the compound was eluted using the phosphate buffer. [Yadav et al., 2012]. The molecular weight of the purified protein was checked by SDS-PAGE as described in Ulfat et al., 2012. |
ENZYME ASSAY |
| The enzyme assay was carried out with reference to the method followed by Nayanshree et al., 2014. Guaiacol (2mM) in sodium acetate buffer (10mM pH 5.0) was used as substrate. The reaction mixture contained 3mL 10mM acetate buffer of pH 5, 1mL guaiacol, 1mL of H2O2 and 1mL enzyme source and enzyme blank contained 1mL of distilled water instead of enzyme source. The mixture was incubated at 30ºC for 15minutes and absorbance was read at 450nm using spectrophotometer. |
ENZYME KINETICS |
Determination of Kinetic Constants Km, Vmax, pH and temperature |
| The kinetic constants Km and Vmax were determined by investigating the effect of different concentrations of MnSO4 as assay variable substrate in 1-5 mM concentration range. The data was used to construct the reciprocal plot using Lineweaver-Burk plot transformation of the Michaelis-Menton kinetic rate equation. The effect of pH on MnP was determined by varying the pH of sodium acetate buffer between 3-9 and then the mixture was incubated at 30ºC for 15minutes. The enzyme was incubated for 30 min at different temperatures such as 20-80 ºC without substrate before carrying out MnP assay. The absorbance was read at 450nm. |
PHYSICO CHEMICAL CHARACTERISTICS OF EFFLUENT |
| The color, pH, temperature, TDS, TSS, TS, BOD, & DO of the sample was been investigated with reference to the methods given by Singh et al., 2012 |
DEGRADATION OF THE DYE EFFLUENT |
| 10% sodium alginate beads was prepared with the MnP enzyme extract. The effect of degradation by the immobilized enzyme was been analyzed. The enzyme was added to the effluent in the ratio of 1:5. This mixture was incubated at room temperature for 10 days [Pandey et al., 2012]. According to the procedure of Peng et al., 2010, the changes that were made in the dye effluent as the result of the degradation process were determined using FTIR spectroscopy. NICOLET iS10 FTIR spectrophotometer from Thermo Scientific was used which gives transmittance spectra in IR range 4000 to 400nm. |
III.RESULTS AND DISCUSSION |
MANGANESE PEROXIDASE PURIFICATION |
| Manganese Peroxidase was formerly purified from a lot of fungal sources such as Aspergillus niger, Aspergillus terrus, Coriolus versicolor, Cerporiopsis subvertmispora, Nematoloma frowardii, Phanerochaete chrysosporium, Phanerochaete sordida and Pleurotus ostreatus. In this study the Manganese Peroxidase was been purified from another non-fungal source Musa acuminate. [Yadav et al., 2012]. |
 |
| The Manganese Peroxidase from the banana stem juice was salted out with 60% Ammonium Sulphate [(NH4)2SO4] to 6.8 fold purification with Specific Activity of 15.44U/mg. After dialysis the specific activity obtained was 13.85U/mg. The specific activity increased to 24.5U/mg with 10.8 purification fold after being purified by column chromatography. The overall yield was 32%. The Manganese Peroxidase was studied from various fungal sources. It had been purified by many different methods including acetone precipitation and fractionation by passing through DEAE Sepharose and Sephadex G-100 column. |
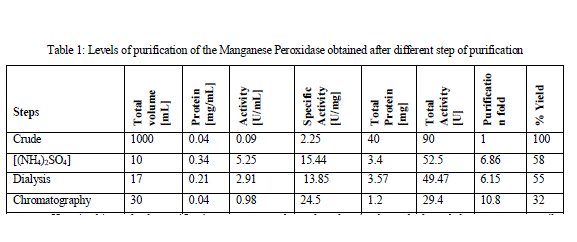 |
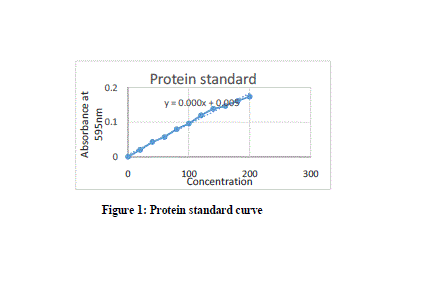
| Here in this study the purification process was been done by simple methods and the source was easily available. Standard protein curve obtained with the Bradford assay was given below in Fig 1. The Specific Activity, purification fold and the %yield obtained after every step of purification was summarized below in Table 1. MnP oxidizes Mn2+ to Mn3+, while Mn3+ acts as a diffusible mediator to oxidize polymeric lignin, lignin model compounds and aromatic pollutants, when they are chelated with oxalate or any dicarboxylic acid. The activity of MnP was decreased when EDTA was used as an ion chelator. The activity MnP was increased by addition of Mn2+. [Jha et al., 2011]. |
ENZYME KINETICS |
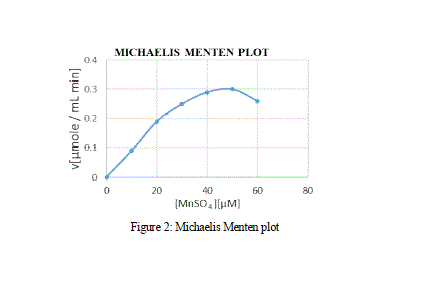
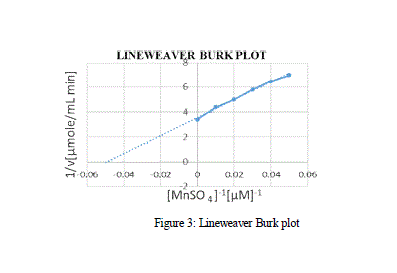
| effect of varying concentration of the substrate MnSO4 on the activity of the Manganese Peroxidase was estimated using the double reciprocal plot of 1/S vs 1/V, by which the Michaelis-Menten constants Km and Vmax. From the MM graph, the Km and Vmax value was 27 μM and 0.3 μM min-1 respectively. Various other Km values for MnP obtained from Bjerkandera sp. was 51 μM which shows high affinity and catalytic efficiency, whereas the Km values of MnP for H2O2 and 2,6-Dimethoxyphenol were 71.4 μM and 28.57 μM respectively [Asgher et al., 2013]. |
 |
 |
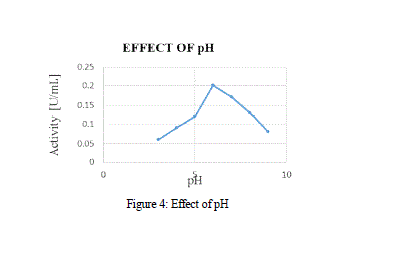
| Over the various pH, the activity of MnP showed a peak at pH 6 at Fig 4, with activity range of 1.6 U/mL, and a further increase in pH showed a decline in the activity of the enzyme. MnP was reported to be fairly stable between the ranges of 4-6. |
 |
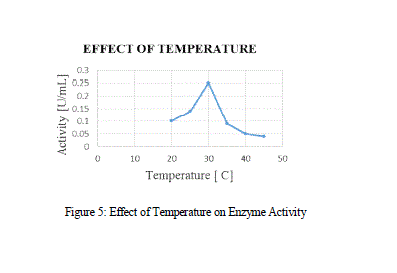 |
| In the Temperature vs Activity curve, initially the curve showed a gradual increase in the activity while after certain temperature, it showed a sudden decrease, which may be due to the heat denaturation. The optimized temperature was 30 ºC. According to Yadav et al., 2012, the optimized temperature was 25 ºC and the MnP obtained from P. chrysosporium and A. terrus was 28 ºC and 37 ºC respectively. |
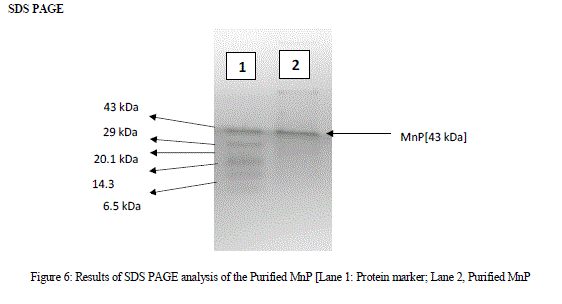 |
| A single band obtained from the SDS PAGE analysis was shown in Fig 6. The single protein band obtained indicates that the molecular mass of the purified protein was 43kDa when compared to the protein marker. MnP family peroxidases was reported as a glycoprotein containing heme groups. Their molecular masses vary from 32-75kDa [Asgher et al., 2013] |
PHYSICO CHEMICAL CHARACTERISTICS OF EFFLUENT |
| The temperature of the effluent sample was found to be 30 ºC. The pH is a measure of the acidity or alkalinity of water. Highly acidic or highly alkaline will kill aquatic life also changes soil permeability, resulting in polluting underground resources of water. At low pH most of the metals become soluble in water and therefore could be hazardous in the environment. At high pH most of the metals become insoluble and accumulate in the sludge and sediments [Nirgode et al., 2013]. Even the toxicity of the heavy metals gets increased at certain levels of pH. Thus the pH is an important factor to decide the quality of the effluents [Ahmed et al., 2012]. The pH of the effluent was 7.5, alkaline condition, is due to the increased levels of bicarbonates and carbonates in the effluent. Color present in dye effluent gives a straight forward indication of water being polluted, and discharge of this highly colored effluent can damage directly the receiving water. [Vijayaraman et al 2013]. The color of the effluent was found to be bluish black. The Dissolved Oxygen is a measure of the degree of pollution by organic matter, the destruction of organic matter substances. The standard for sustaining aquatic life was at 5mg/l a concentration below this value adversely affects aquatic biological life, while concentration below 2mg/l may lead to death for most fishes. |
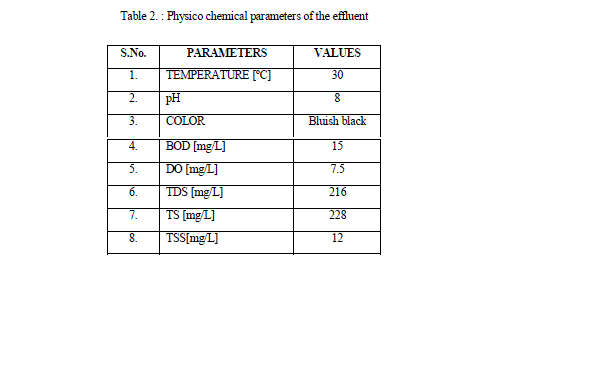 |
| A high amount of suspended particles has detrimental effects on aquatic flora and fauna and reduce the diversity of life in aquatic system and promote depletion of oxygen and silting in ponds during rainy season [Vijayaraman et al 2013]. High content of dissolved solids affects the density of water, influences osmoregulation of freshwater organisms, reduces solubility of gases (like oxygen), and utility of water for drinking, irrigation purpose [Ahmed et al., 2012]. The Total Dissolved solids was found to be 216 mg/L. BOD measure the amount of oxygen requires by bacteria for breaking down to simpler substances from the decomposable organic matter present in any water [Nirgode et al., 2013]. The BOD obtained in the effluent was 15mg/L. |
ANALYSIS OF DEGRADED PRODUCTS |
| Results of FTIR analysis of control, i.e., effluent sample and the sample after degradation by MnP showed various peaks. The control sample showed peaks at 652, 659, 668, 675, 710, 1634, 1639, 1650, 1655, 3288, 3333, 3346, 3354, 3362, 3372, 3562, 3570, 3591, 3615, 3625, 3631, 3653 cm -1 (Fig 7) while the degraded sample showed peaks at 1203, 1639, 2359, 3354 cm-1 (Fig 8 ). |
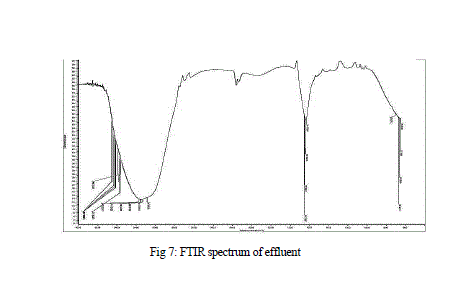 |
| The FTIR spectrum showed peaks at 3653 cm-1 for the intramolecular hydrogen bonding and O-H stretching. Peaks at 710 cm-1 and 1655 cm-1 represented the C-H bonding and C=C stretching of alkene group respectively. Peak at 3372 cm-1 showed N-H stretching of amine group. A stretching between C=O was reported at 1650 cm-1 |
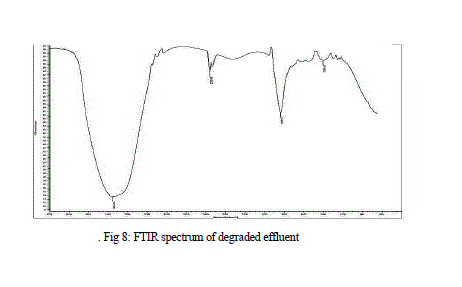 |
| The FTIR spectrum of degraded sample showed a significant change in position of the peaks when compared to the spectrum of the effluent sample. The peaks present in the effluent were mostly absent in the degraded sample representing the degradation of the effluent. New peak at 1203 cm-1 represented the C-O stretching of acid and ester group. Another new peak at 2359 cm-1, showed C=C alkyne stretching. The amine and amide group present in the effluent was absent, confirming the degradation of the groups. The absence of the 1655 cm-1 peak represents the breakdown of N=N bond. |
IV.CONCLUSION |
| Simple method to extract the enzyme when compared to fungi. The enzyme showed better activity and specific activity when compared to the one extracted from the fungal sources. The MnP was an iodinating agent in combination with H2O2. Further degradation analysis of the effluent can be done by other techniques such as HPLC, GC MS. |
References |
|