International Journal of Innovative Research in Science, Engineering and Technology
ISSN ONLINE(2319-8753)PRINT(2347-6710)
ISSN ONLINE(2319-8753)PRINT(2347-6710)
Salin Peter1 and Prof. Sreedevi C2
|
| Related article at Pubmed, Scholar Google |
Visit for more related articles at International Journal of Innovative Research in Science, Engineering and Technology
Sasthamkotta Lake, the largest fresh water lake in Kerala, a state of India on the south of the West Coast has been a designated wetland of international importance under the Ramsar Convention since November 2002 and one among the nineteen wetlands identified for conservation and management by the ministry of environment and forests under the national wetland conservation program. It meets the drinking water needs of half a million people of Kollam district in Kerala and also provides fishing resources. The lake is facing degradation due to anthropogenic activities such as directing human waste, soil erosion due to destruction of vegetation, changes in land use pattern etc. thus leading to the deterioration of environmental quality as well as a decrease in the surface area and depth. The present study is to assess the quality of the water in Sasthamkotta Lake by developing a WQI and to predict the future pollution level and its impact.
Keywords |
| Assessment of eutrophic condition, Characterizations of physicochemical and biological parameters, Freshwater Lake, Statistical analysis, Water Quality Index |
INTRODUCTION |
| Water is an essential natural resource for sustaining life and environment that we have always thought to be available in abundance and the free gift of nature. However, the chemical composition of surface and subsurface water is one of the prime factors on which the suitability for domestic, industrial or agriculture purpose depends. Natural, readily available water such as shallow groundwater, surface water, water from the boreholes and springs are the main sources for drinking water production [1]. Though surface water contributes only 0.3% of the total water resources on earth, it is one of the major and preferred sources of drinking water in rural as well as urban areas, particularly in the developing countries like India. But in the era of economic growth, surface water is getting polluted due to urbanization and industrialization. |
| Water quality is a term used to describe the chemical, physical, and biological characteristics of water, usually in respect to its suitability for a particular purpose [2]. Based on the separate parameters we could be confused about the assessment of the temporal and spatial changing trend of WQ; the zoning and classification of WQ; the comparison of WQ in the rivers; and the interpretation of water quality to the community[3]. Above disadvantages can be overcome by using Water Quality Index[4].WQI is an aggregation parameter calculated on many WQ parameters according to a defined method. A water quality index provides a single number that expresses the overall water quality at a certain location and time based on several water quality parameters[5]. A single number cannot tell the whole story of water quality; there are many other water quality parameters that are not included in the index. However, a water index based on some very important parameters can provide a simple indicator of water quality. Briefly we can say, WQI numerically summarizes the information from multiple water quality parameters into a single value [6]. |
| The State’s largest freshwater lake and one of the 26 Ramsar sites in the country, Sasthamcotta Lake in the Kollam district is fast becoming grassland (The Hindu, April 9, 2013). Even as it is feared that Sasthamcotta Lake is shrinking to death, a recent study by the Kerala Sasthra Sahithya Parishad (KSSP) brings the relief that the State's largest freshwater lake is not in danger of extinction. The study submitted to the State government shows that water level of the lake fell to alarming levels in 2004 and 2009. |
| Many research studies had been done regarding hydrological features of the lake. But most of them are not concentrated on water quality and other environmental features [7]. Very few studies reveal the physical, chemical and biological characteristics of the lake. No studies have been undertaken to estimate the eutrophic conditions of the lake. After detailed review of literature it has been understood that tools like GPS and computation of WQI can be effectively utilized for assessing the pollution level of the lake. So the present study was envisaged to have a detailed assessment of water quality of the Sasthamkotta Lake. |
| The objective of the study is to assess the quality of the water in Sasthamkotta Lake by developing a water quality index after analyzing the physical, chemical and biological parameters and finally to predict the future pollution level and its impacts. |
MATERIALS AND METHODS |
| A. Study area selection |
| The Sasthamkotta lake is located physiographically in the midland region between 9°0’- 9° 5’N latitude and 76° 35’-76° 46’E longitude at an elevation of 33 m above mean sea level. The Lake has a catchment area of 934.56 hectares, an average depth of 6.7 m and a maximum depth of 13.9 m. |
| B. Sampling and data collection |
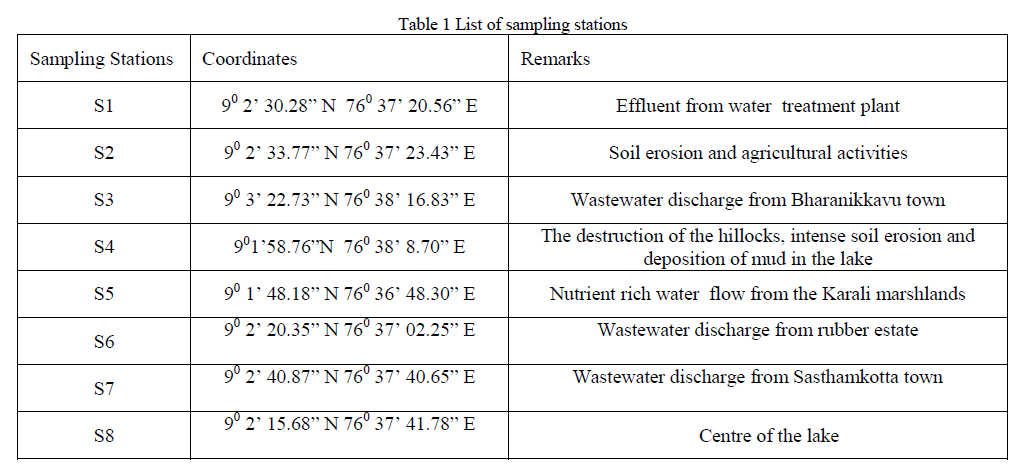
| The samples were taken from 8 stations (Figure 1) during the months from October 2012 to July 2013.The collections were made during day time. Maximum care was taken for the collection of samples, their preservation and storage as per the APHA standards[8]. Latitude and Longitude of the sampling stations are also marked by using GPS. The previous water quality data of Sasthamkotta Lake were obtained from the Kerala Water Authority, Q.C Division. |
| C. Measurement and analysis of water quality parameters |
| Water quality was analyzed for physical, chemical and biological parameters such as DO, BOD, COD, Turbidity, Total Solids, Electrical conductivity, Acidity, Alkanity, Sulphate, Total Hardness, Calcium, Magnesium, Chloride, Fluoride, Iron, pH, Total coliform and Fecal coliform for more accurate value of Water Quality Index. These parameters were measured as per standard method APHA[8]. |
| D. Water Quality Index |
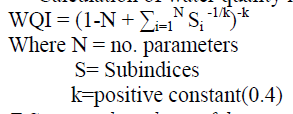
| Calculation of water quality index by using the improved method for aggregation of the water quality subindices (S) by Swami and Tyagi (2007). Water quality parameters such as temperature, turbidity, total solids, total hardness, nitrate, phosphate, fluoride, iron, pH, DO, BOD and total coliform were selected for preparing water quality index. |
| Calculation of water quality index by using the improved method for aggregation of the water quality |
 |
| E.Statistical analysis of data |
| Water quality data were statistically analyzed by using R software. To find out the most significant parameters among the quality variables, Pearson’s correlation studies were conducted between water quality index and parameters. Those parameters having coefficient of correlation nearer to one are more significant and the P-value should be less than 0.05. |
| F.Assessment of Eutrophic condition of the Lake |
| Eutrophic condition of the lake was analyzed by using Carlson trophic state index value. This index was developed for use with lakes that have few rooted aquatic plants and little non-algal turbidity. Use of the index with lakes that do not have these characteristics is not appropriate [9]. |
| The formula for calculating the Carlson Trophic State Index values for total phosphorus is given below. |
| TSI = 14.42 ln Total phosphorous (μg/L) + 4.15 |
| Where TSI is the Carlson trophic state index |
| Ranges of trophic state index values are often grouped into trophic state classifications (Table 11). |
RESULTS AND DISCUSSION |
| A. General |
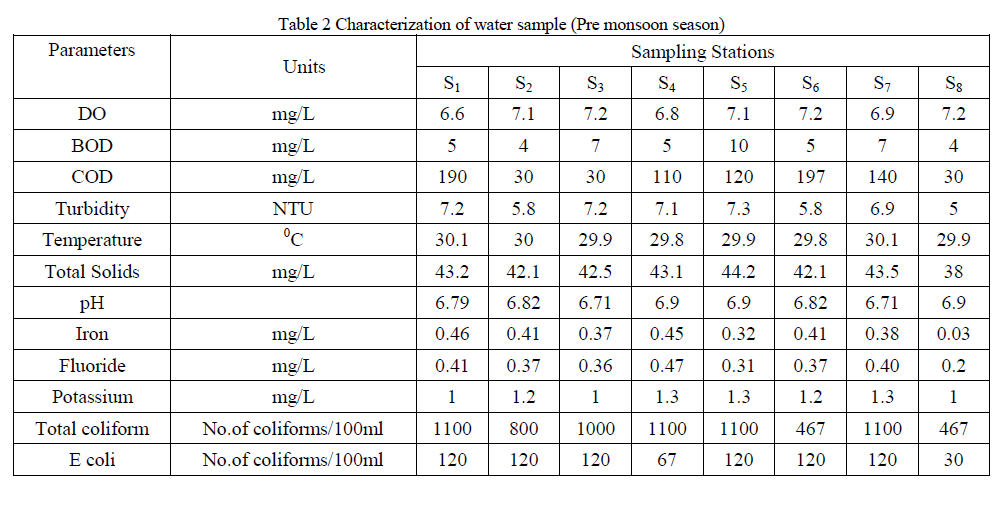
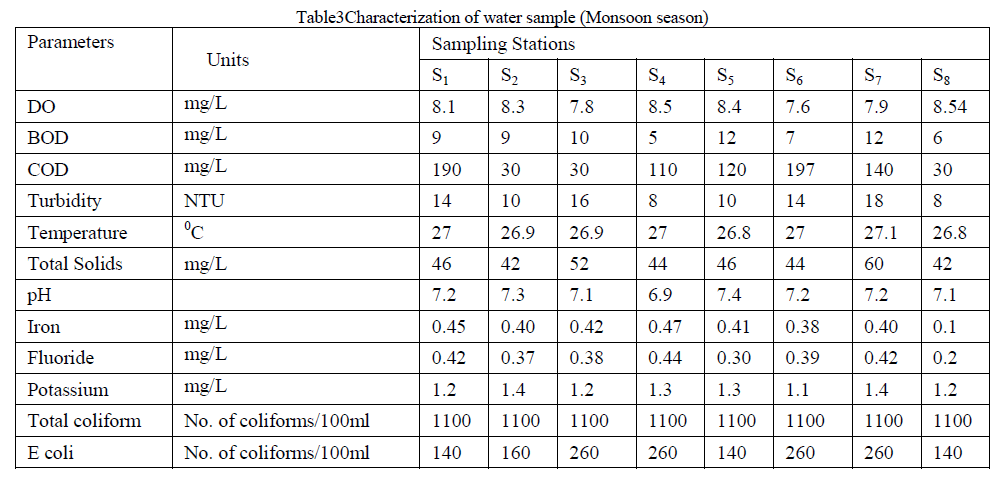
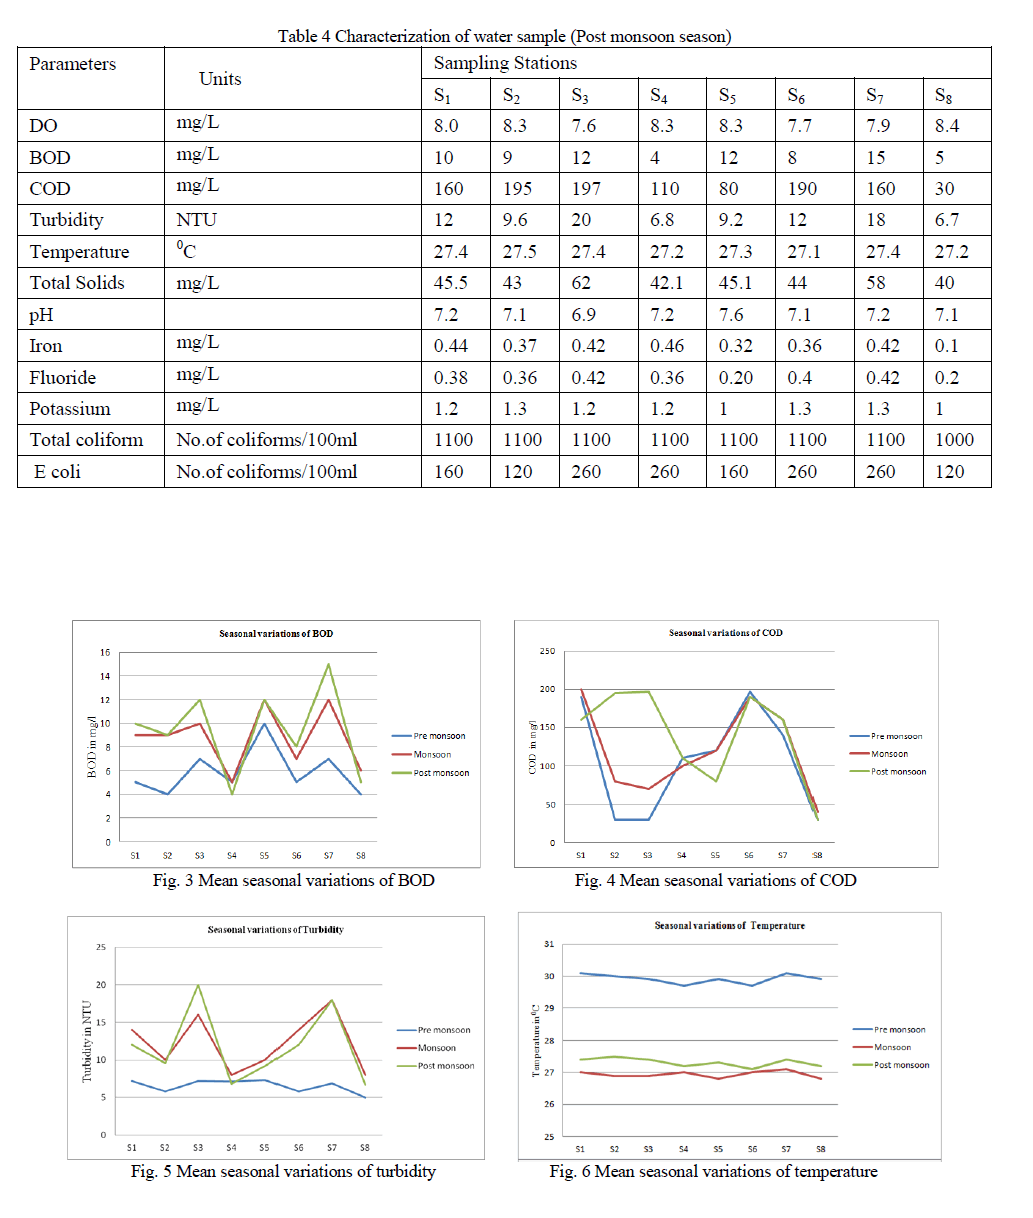
| After conducting detailed survey, identified the main contamination stations (Figure 1) and latitude and longitude of the stations also marked (Table 1). The samples were taken from the stations from the months of October 2012 to July 2013 and the characterizations of the samples in pre monsoon, monsoon and post monsoon seasons are shown in Table 2, 3 and 4. |
 |
| B. Water Quality Analysis |
| Seasonal analysis of water quality was done by using the average value of the parameters obtained from all the stations (Table 2, 3 and4). |
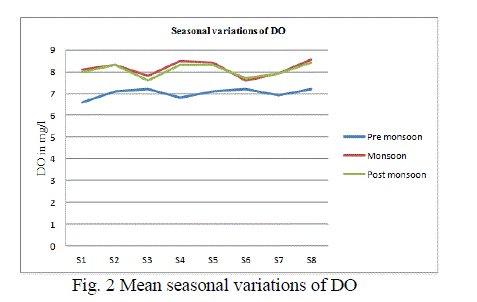
| Variations in the concentration of dissolved oxygen at pre monsoon, monsoon and post monsoon seasons from the eight sampling stations were, presented in Table 2, 3, 4 respectively and the graphical representation showed in Fig. 2. The average value of dissolved oxygen at pre monsoon season ranged from a minimum of 6.6 mg/L in S1 to a maximum of 7.2 mg/L in S8.At monsoon season it ranges from 7.6 mg/L in S6 to 8.54 mg/L in S8 and post monsoon season it ranges from 7.6 mg/L in S3 to 8.4 mg/L S8.Seasonal mean showed that dissolved oxygen is sufficient (> 5.0 mg/l) at all stations and highest during monsoon and post monsoon seasons than pre monsoon. |
| The observed variations of BOD at pre monsoon, monsoon and post monsoon seasons were illustrated in Table 2, 3, 4 respectively and the graphical representation in Fig. 3.The minimum BOD of 4 mg/L at pre monsoon season was recorded from S2 and S8 and highest BOD of 15 mg/L in S7 at post monsoon season. The maximum BOD was observed S7 at post monsoon season because of the direct discharge of waste water from Sasthamkotta and nearby areas. |
 |
 |
 |
 |
 |
| The observed variations of mean chemical oxygen demand values were illustrated in Table 2, 3, 4 and Fig. 4. At pre monsoon season the COD ranges from a minimum of 30 mg/L in S2, S3 and S8 to a maximum of 197 mg/L in S6. |
| At monsoon season it ranges from 30 mg/L in S2, S3 and S8 to 197 mg/L in S6 and at post monsoon season 30 mg/L in S8 to 197 mg/L in S3. In S3 and S6, COD value is very high because of the waste agricultural chemicals discharged into the lake from rubber plantations at Rajagiri, Bharanikkavu and the adjoining areas. All other stations COD value is high because of the waste agricultural chemicals discharged into the lake from rubber plantations at Sasthamkotta and nearby areas and the direct discharge of drainage water from Sasthamkotta, Bharanikkavu and nearby areas. |
| The observed variations in turbidity values were illustrated in Table 2, 3, 4 and Fig. 5.The turbidity values ranged between 5 NTU in S8 to 7.3 NTU in S5 at the pre monsoon, 8 NTU in S4 and S8 to 18 NTU in S7 at monsoon and at post monsoon season it was 6.7 NTU in S8 to 20 NTU in S3. The seasonal mean values of turbidity showed that minimum was observed during pre monsoon and maximum during monsoon and post monsoon season. In station S7 turbidity value is very high in the monsoon and post monsoon season because of the direct discharge of drainage water from Sasthamkotta and nearby areas. |
| Surface water temperature measured and the seasonal analysis during the period of study was given in Table 2, 3, 4 and Fig. 6. The average temperature ranges from 29.80C in S4 and S6 to 30.10C in S1 and S7 at pre monsoon season. At monsoon season it ranged from 26.80C S5 and S8 to 27.10C in S7 and at post monsoon season it from 27.60C in S6 to 27.50C in S2.Highest water temperature was observed at pre monsoon season in S1 and S7, while the lowest temperature was at monsoon season in S5 and S8. |
| The seasonal variations of total solids of the lake water are shown in Table 2, 3, 4and figure 7. At pre monsoon season TS values ranged from a minimum of 38 mg/L in S8 to a maximum of 44.2 mg/L in S5 and at monsoon season a minimum of 42 mg/L in S2 and S8 to a maximum of 60 mg/L in S7.At post monsoon season it ranged from 40 mg/L in S8 to 62 mg/L in S3.Total solid values at pre monsoon are slightly lower than monsoon and post monsoon seasons.The highest value was recorded during post monsoon season at S3 and the lowest was at S8 during pre monsoon season. |
| The seasonal variations of pH of the lake water are shown in Table 2, 3, 4 and figure 8.The desirable limit is 6.5 to 8.5(IS 10500:2004).All the seasons pH is within the range. At pre monsoon season pH ranges from 6.71 to 6.9, at monsoon it from 6.9 to 7.4 and at post monsoon it from 6.9 to 7.6. In pre monsoon season pH is slightly acidic, i.e., below 7. |
| Seasonal variations of iron of the lake water are shown in Table 2, 3, 4and figure 9.The desirable limit is 0.3 mg/l (as per IS 10500:2004).At pre monsoon iron ranged from 0.03 mg/L in S8 to 0.46 mg/L in S1,at monsoon it ranged from 0.1 mg/L in S8 to 0.47 mg/L in S4 and at post monsoon it ranged between 0.1 mg/L in S8 to 0.46 mg/L in S4.All the seasons presence of iron is beyond the range except sampling station 8, which is the centre portion of the lake. |
| Seasonal variations of fluoride of the lake water are shown in Table 2, 3, 4 and figure 10.Fluoride ranged between 0.2 mg/L in S8 to 0.47 mg/L in S4 at pre monsoon season, at monsoon it ranged from 0.2 mg/L in S8 to 0.44 mg/L in S4 and at post monsoon it ranged from 0.2 mg/L in S8 to 0.42 mg/L in S3 and S7. All season presence of fluoride are within the range. |
| Seasonal variations of potassium of the lake water are shown in Table 2, 3, 4 and figure 11.The desirable limit is 1 mg/L (as per IS 10500:2004).At pre monsoon season potassium ranged from a minimum of 1 mg/L in S1,S3 and S8 to a maximum of 1.3 mg/L in S4,S5 and S7,at monsoon it ranged from 1.1 mg/L in S6 to 1.4 mg/L in S2 and S7 and monsoon season it ranged from 1 mg/L in S5 and S8 to 1.3 mg/L in S2,S6 and S7. In all seasons presence of potassium are slightly above the desirable limit. |
| Seasonal variations of number of coliforms in the lake water are shown in Table 2, 3, 4 and figure 12. At pre monsoon season number of colifrms ranged between 467 / 100 ml in S6 and S8 to 1100 / 100 ml in S1,S4,S5 and S7 and at monsoon and post monsoon seasons number of coliforms in all stations were 1100 / 100ml. All seasons presence of coliforms are beyond the limit. At monsoon and post monsoon season numbers of coliforms are higher than pre monsoon season. |
| Seasonal variations of number of E coli in the lake water are shown in Table 2, 3, 4 and figure 13.At pre monsoon season the number of E coli ranged between 30/100 ml in S8 to 120/100 ml in S1,S2,S3,S5,S6 and S7,at monsoon season it ranged from 140 / 100ml in S1,S5 and S8 to 260 / 100 ml in S3,S4,S6 and S7 and at post monsoon season it from120 /100 ml in S2 and S8 to 260 / 100 ml in S3,S4 and S6.In all seasons presence of E coli are beyond the limit. At monsoon and post monsoon season number of E coli are higher than pre monsoon season because of the direct discharge of waste water from Sasthamkotta, Bharanikkavu and nearby areas. |
| C. Water Quality Index |
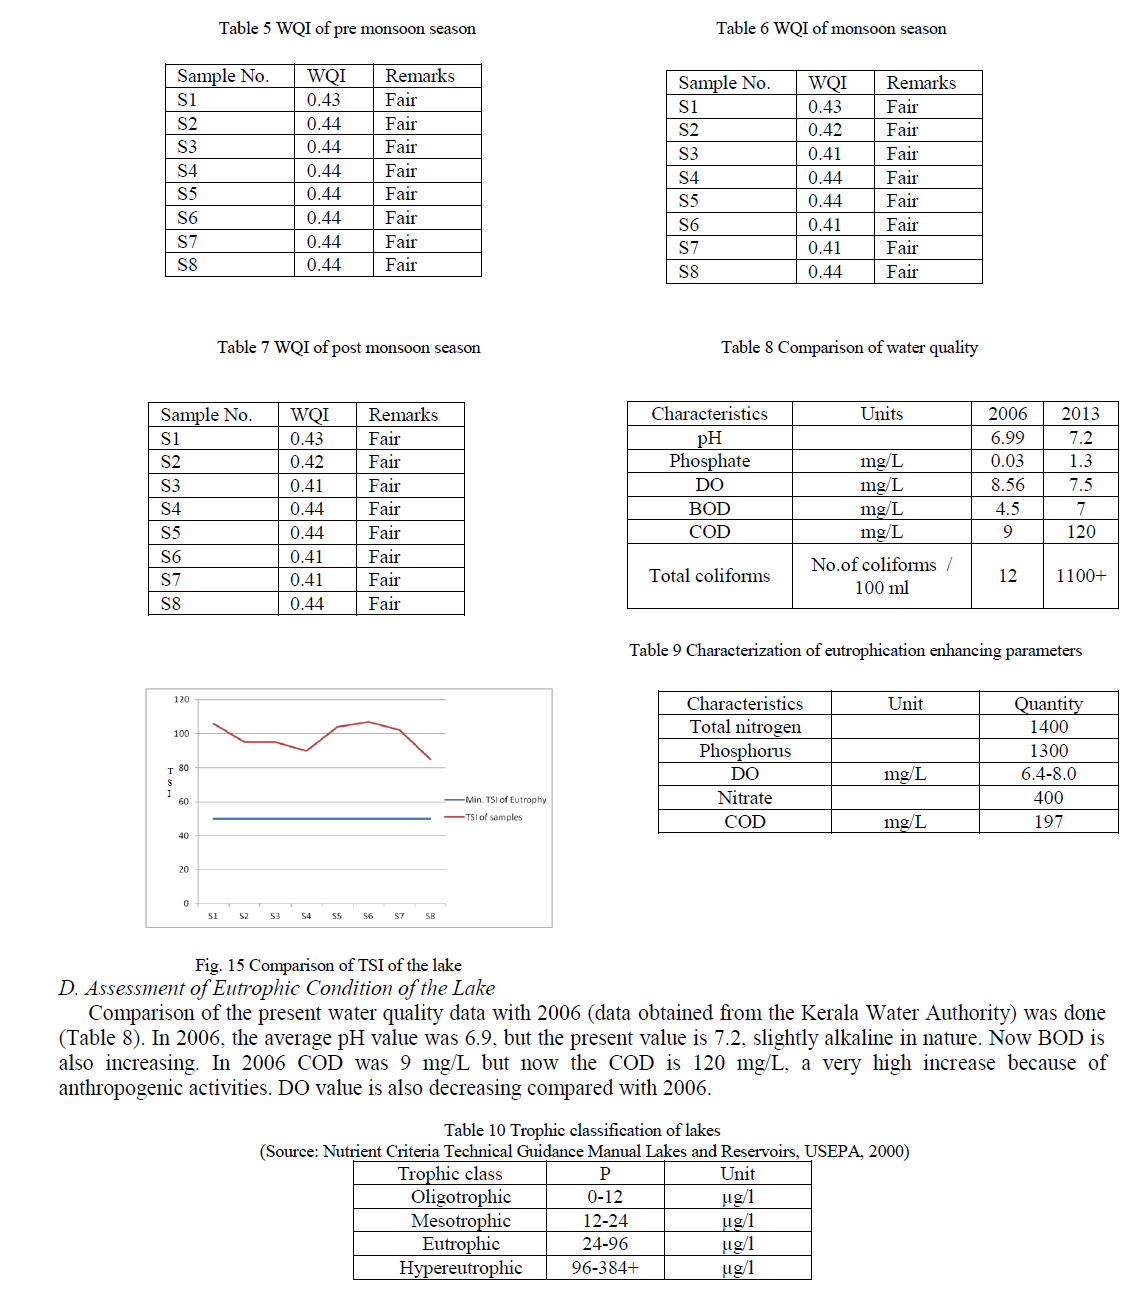
| The water quality index also calculated by using the improved method by Swami and Tyagi, comparing the seasonal variations of WQI (Table 5, 6,7and figure 14) .In pre monsoon season almost all the samples have the same WQI, i.e., 0.44; it belongs to the fair condition. In monsoon and post monsoon season the least WQI is from stations S3, S6 and S7.Stations S3 and S7 are the direct drainage water discharge from Bharanikkavu and Sasthamkotta towns respectively. S6 is the waste water discharge from rubber estates. |
 |
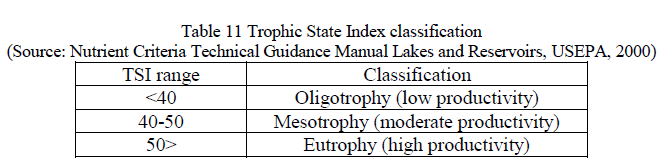 |
| This Lake managed to remain a freshwater body for long owing to the virtual absence of nutrients in it. It was the lack of nutrients that prevented the growth of algae in the lake. In 2006, the value of nutrient contents, i.e., total nitrogen and phosphorus were negligible, but now the value is high (Table 9) and it leads to the hypereutrophic condition (Table 10).Also the eutrophication condition of the lake was analyzed by using Carlson trophic state index (Table 11 and figure 15).From these analysis it is clear that the lake is in eutrophic condition. The algal growth in the lake has already lent a green hue to the lake in some pockets, and this is causing unusual sedimentation in the Sasthamcotta water treatment plant and in the overhead water tanks fed by the treatment plant. |
CONCLUSIONS |
| The present paper analyzes the water quality data collected from the Sasthamkotta Lake. Important issues include decreasing water quality, alternations in biological productivity (tropic state), increase in nutrient concentrations, contaminant migration into the lake etc. |
| The DO values were found to range from 6.6 to 8.54 mg/L in all seasons. In comparison with the previous data, the DO of the lake is decreasing dangerously due to anthropogenic activities.The BOD range from 4 to 15 mg/L in all seasons. BOD is slightly increasing compared with the previous values.The COD ranges from 30 to 197 mg/L. Compared to the previous data, COD is increasing rapidly. This may be due to the waste agricultural chemicals discharged into the lake from the adjoining rubber plantations.The turbidity ranges from 5 to 18 NTU. This is high in monsoon and post monsoon seasons compared with pre monsoon season because of the direct discharge of drainage water from Sasthamkotta, Bharanikkavu and nearby areas.In pre monsoon season pH is slightly acidic, i.e., below 7.In all season pH is within the limit. |
| Coliforms ranges from 400 to 1100/100ml.Number of coliforms is increasing very rapidly compared with the previous values. Ecoli ranges from 30 to 260/100ml.This is also found to be increasing very rapidly compared with the previous values. |
| The quantities of phosphate and nitrate are increasing and higher than the prescribed limits.DO values of the lake are decreasing. They indicate that the lake is in hypereutrophic condition.In all the season water quality index remains in the category“fair”. |
| As per the analysis of the results it can be seen that in the post monsoon season the physical, chemical and biological parameters are higher than pre monsoon season. Presence of coliforms and Ecoli are beyond the limit. So it can be concluded that during monsoon season contaminant migration into the lake is happening abundantly and thus result in the poor quality of water. Also based on total nitrogen and phosphorus, the lake belongs to hypereutrophic class. If eutrphication and contamination proceed at this rate, within next 5 to 10 years our own Sasthamkotta Lake, the largest fresh water lake in Kerala, categorized as a designated wetland of international importance under the Ramsar Convention, will end up in a miserable condition. Hence the issues revealed in this study will have to be addressed seriously by all concerned. |
References |
|