ISSN ONLINE(2319-8753)PRINT(2347-6710)
ISSN ONLINE(2319-8753)PRINT(2347-6710)
S. Sunder Rajan1, L.Yeshodha2, S. Suresh Babu3
|
| Related article at Pubmed, Scholar Google |
Visit for more related articles at International Journal of Innovative Research in Science, Engineering and Technology
Solid waste management is a global environmental problem at present. There is an increase in commercial, residential and infrastructure development due to the population growth and this has negative impact on the environment. Urban solid waste management is considered as one of the most serious environmental challenge confronting municipal authorities in developing countries. One of these impacts is due to location of dumping site in unsuitable areas. The present study deals with selecting suitable sites for disposal of Solid Waste generated from Hosur Municipality by integrating RS and GIS. It is observed, that suitable site identified for disposal of Solid Waste is the Chennathur region of Hosur.
Keywords |
| Solid Waste, Analytical Hierarchy Process, Weight Linear Combination, RS, GIS |
INTRODUCTION |
| The rapid growth of urbanization decreases the non-renewable resources and disposal of effluent and toxic waste indiscriminately, are the major environmental issues disturbs threats to the existence of human being (Allen et alÃÂþ 1997)[2]. The most common problems associated with improper management of solid waste include diseases transmission, fire hazards, odour nuisance, atmospheric and water pollution, aesthetic nuisance and economic losses (Jilani et al)[4]. There has been a significant increase in solid waste generation in India over the years from 100 gm per person per day in small towns to 500 grams per persons per day in large towns. Presently most of the municipal solid waste in India is being disposed unscientifically (AkolkarÃÂþ 2005)[1]. Generally municipal solid waste is collected and deposited in sanitary landfill, such unscientific disposal attract birds, rodents and fleas to the waste dumping site and create unhygienic conditions (Suchitra, et al)[8]. The degradation of the solid waste results in the emission of carbon dioxide (CO2), methane (CH4) and other trace gases (MeBean, E.A et al ; Amar M. Dhere et al ;1995)[4]. The present study is intend to find out suitable sites for the disposal of urban solid waste generated from Hosur municipality and surrounding areas with the help ofRemote sensing and GIS techniques. |
STUDY AREA |
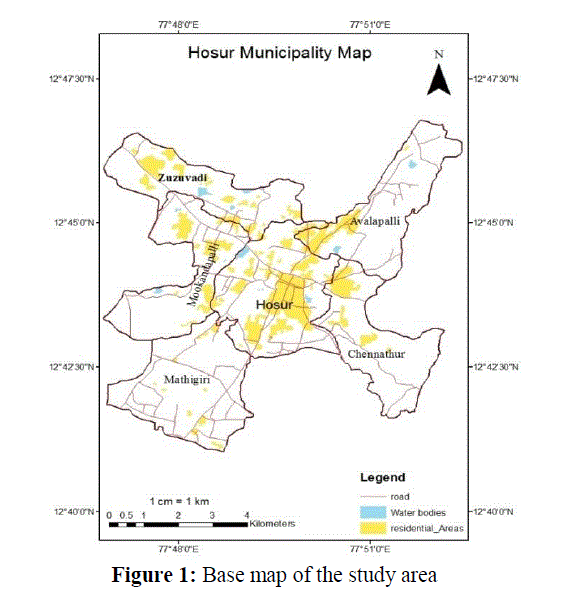
| Hosur Municipality is a town located in the western corner part of Tamil Nadu state. TheMunicipality lies inlongitudes77°49’48 North and Latitudes 12°43’58 East. The total area of the municipality is 72.41sq.km. It has more than twenty thousand families as residents and a host of business and office establishments and educational institutions. The boundaries of the municipality isEluvapalli and Marasandiram Panchayath (North), Mookandapalli Panchayath (East), Poonapalli Panchayath (South) and Karnataka State (West). Hosur municipality is the headquarters of Hosur TalukÃÂþ With a population of 2,44,518. The Average annual rain fall is around 840mm. Theamount of solid waste generatedis approximately 82tons per day.The study area is shown in the Figure1 |
 |
MATERIALS AND METHODS |
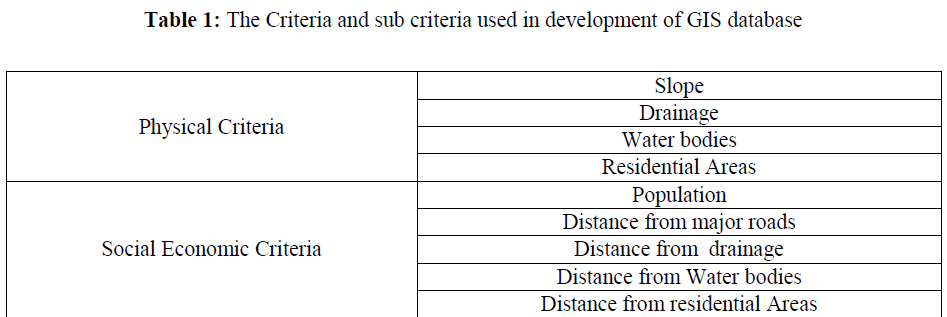
| LISS IV images of IRS P6 satellite acquired during March 2012, was processedfrom National Remote Sensing Centre (NRSC). It was geocorrected in Erdas imagine Package using UTM Projection and WGS 84datum and then co registered with the Survey of India Topographical map of the study area using Ground Control Points(GCP’s). LISS IV derived thematic maps, SRTM derived Digital Elevation Model and secondary data were integrated in GIS domain.The methodology utilizes GIS to evaluate the entire region based on certain evaluation criteria for the analysis of landfill site suitability.These Criteria are grouped into two main categories including physical and social economical information. The criteria were selected according to study areas local characteristics (Ozeair and Mohesn. 2009)[7]. The sub criteria that were used for spatial analysis are slope, drainage, population, and distance from major roads, distance from major residential area and distance from drainage. The Criteria and sub criterias used in development of GIS database as shown in the Table 1. |
 |
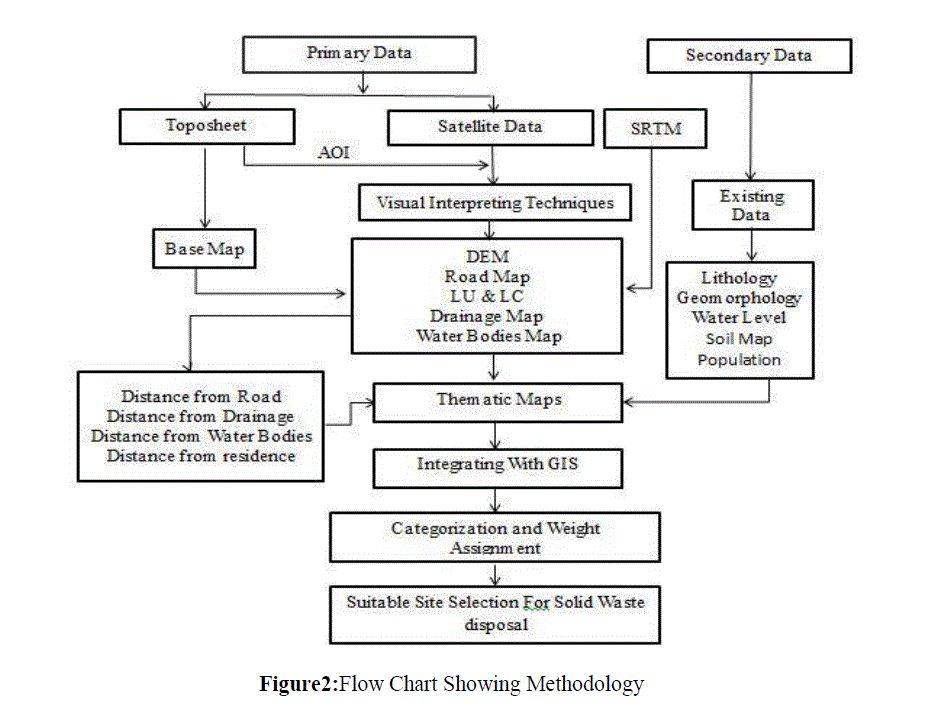 |
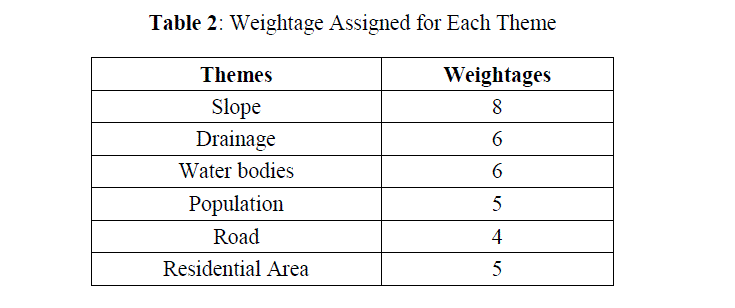
| Topology is the mathematical relationship built between objects and it makes an explicit bond between geographic features in the data base. After attributing the data base map was created and there after various thematic maps like Drainage, Slope, water Bodies, populations and road map were created and weightage allocate to them based on the key parameter. The weightage assigned for different themes are shown the Table 2. For identifying a suitable site for the disposal of solid waste buffer zones were created around the Municipality area. Various coverages in these themes were assigned a suitable score and converted in to raster format using Spatial Analyst in the Arc Map. The methodology of this study covers some sequential stepsÃÂþ The detailed methodology is shown in Figure 2. |
 |
| a) Weighting the Criteria |
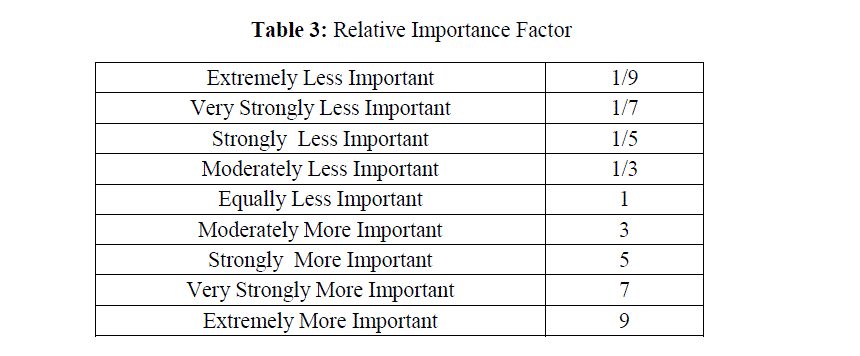
| The pair wise comparisons associated with the Analytical Hierarchy Process (AHP) the factors havebeen used to Weight the themes. Pair wise comparison matrix is created by setting out one row and one column for each factor in theproblem.This Matrix Judgment was made about the relative importance of factors involved, judgment 9 point scaling system Method was used in scientific study of referencesshown in Table 3 |
 |
Results and Discussions |
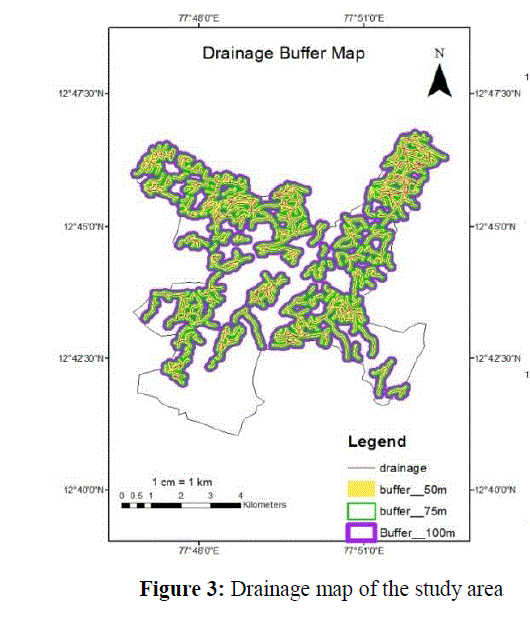
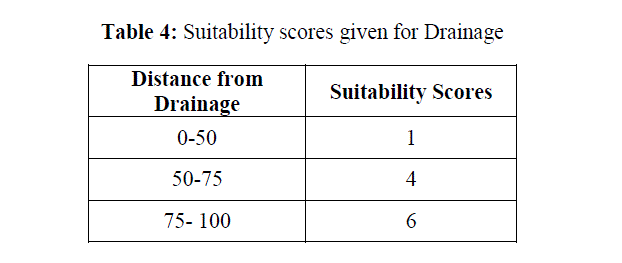
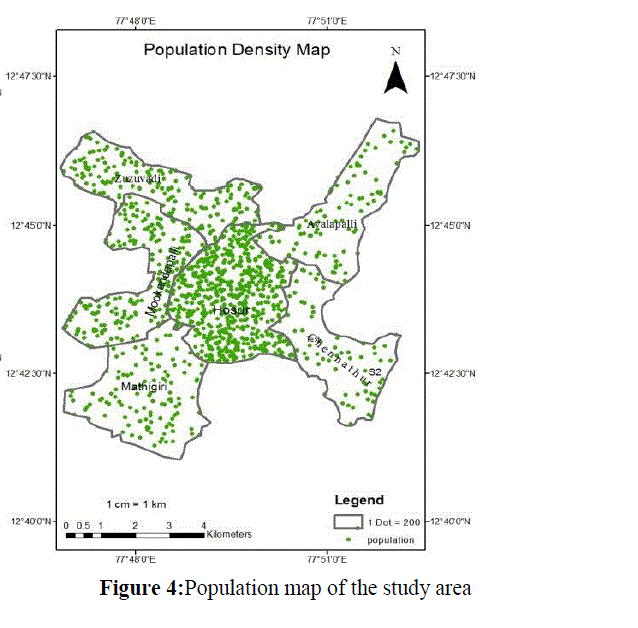
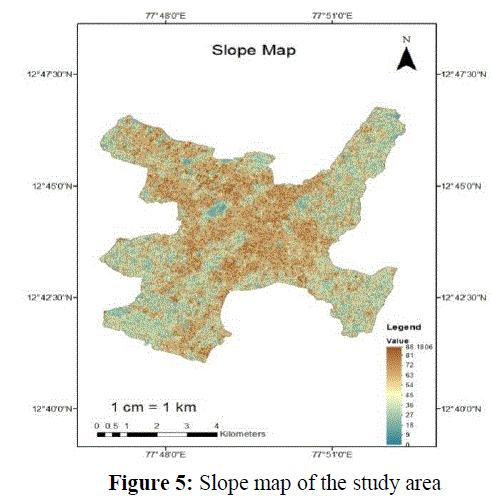
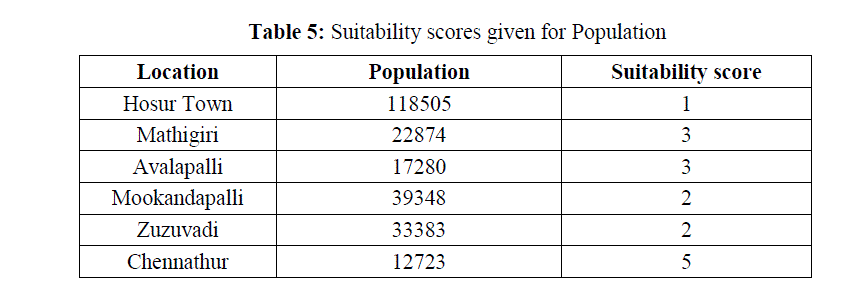
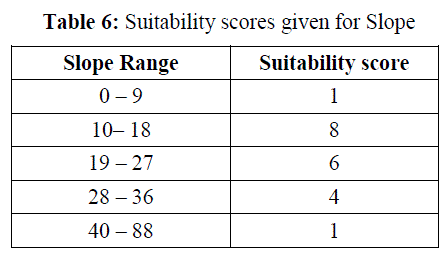
| Drainageis one of the important criteria for selecting a suitable site, because the drainage areas are having much more infiltration capacity. During flood time water spills over drainage and the whole plain will be submergedunder water. So the buffer zones were created and based on zone limits weightages were assigned. Shown in Table the population map was derived based on their own boundaries and the suitability score given for population zone in Shown in Figure 4 and Table 5 respectively.Slope class map of the study area and its suitability score are represented inFigure 5 and Table 6 respectively.From the slope ranges the weightages were assigned. In slope map the low elevated area is best suitable for disposing the solid wastes. |
 |
 |
 |
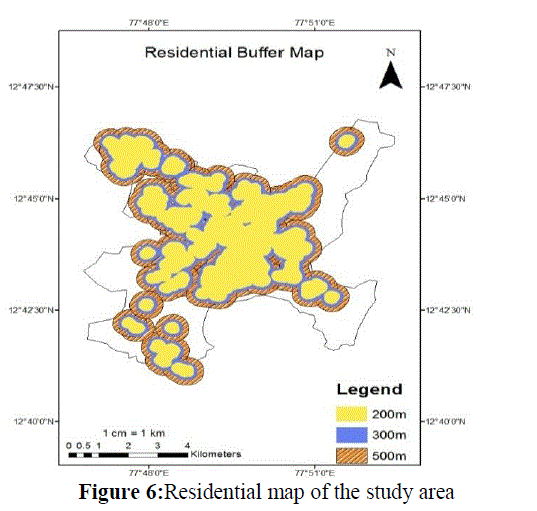
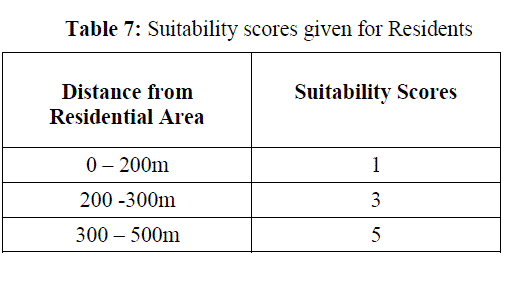
| Maps likedistance from Residence, distance from Major roads and their suitability scores are given in the Figures 6, 7 and Table7, 8respectively. After projection and Topology creation all feature classes like slope,drainage, water bodies, population and road were converted to Raster files and separate datasets were created using weightage and rank.For the analysis all the raster datasets fordifferent layers having different score were over laid and the scores of each compositeclass were added using raster calculator tool of spatial analyst extension of Arc Map. The final scores were reclassified to generate the output map showing various classes of suitable site for waste dumping. The degree of suitabilityfor findingsuitable land areas are given in the Table 9. |
 |
 |
 |
| The outcome generated through the GIS analysis is given below. From the GIS analysis, the result shows that 6.9393Sq.kmarea is less suitable, 3.4513 Sq.km areas is moderately suitable and 1.7059 Sq.km area is highly suitable for dumping waste identified. |
 |
 |
| The Suitable sites for Solid Waste Disposal were identified, based on Theme Weightages and Rankings.From the result of various themes, the most Suitable Sites are S1, S2, S3, S4 and S5 as shown in Figure 8.High Suitabilityzones were identified in the North Eastern part of Chennathur village and South Western part of Mathigiri town Panchayat.These sites are selected as most suitable site because oflow Urban Growth Factor compared to other sites and also has a barren land for waste disposal. The proposed method for site selection processes in otherconditions and locations where the intensity of introduced parameters shows discrepancies. |
Conclusion |
| The present study was to identify the potential waste disposal sites using Remote Sensing and GIS techniques for Hosur Municipality. Selection of suitable sites for waste disposal is based on several factors. GIS technology using Weighted overlay analysis is used to select the suitable solid waste disposal sites and are categorized in to three category. There are Good, Moderate and Poor. Accordingly the appropriate sites which were mightbe suitable from environmental, transportation and economic point of view. |
ACKNOWLEDGEMENT |
| The authors are thankful to the Agricultural Department, Krishnagiri district for providing the Soil and water leveldata. The Hosur Municipality forproviding the Census data and USGS for providing the SRTM sensor products. |
References |
|