ISSN ONLINE(2319-8753)PRINT(2347-6710)
ISSN ONLINE(2319-8753)PRINT(2347-6710)
Anantha Moorthy.U 1, K.Radhika2, Sangeetha Anand3
|
| Related article at Pubmed, Scholar Google |
Visit for more related articles at International Journal of Innovative Research in Science, Engineering and Technology
ABSTRACT:Cost efficient and economical treatment methods are the need of the hour in waste water treatment industry. Both the criteria can be met by the effective treatment method of “Microbial fuel cells” which is capable of converting the biomass substrate into electricity. In this paper, effort was taken to select reactor configuration which is essential for the single chambered membrane less MFC to perform efficiently. Two reactors of tubular configurations were selected in this project, one with activated carbon media and another one without media. The flow pattern and mixing behaviour in the reactor are analysed by conducting the tracer test using sodium chloride and KMnO4 as tracers. NaCl is measured in terms of electrical conductivity and KMnO4 for estimating the flow rate to be adopted for the tracer test. KMnO4 tracer test was conducted to identify the presence of dead zones inside the reactors. Result of the NaCl tracer test is obtained by plotting the RTD curves between electrical conductivity and time. Regression values and Peclet number are obtained from the graph to decide the pattern between PFR (plug flow reactor) or CSTR flow regime.
Keywords |
| Tracer study, Flow rate optimization, Microbial fuel cell, Tubular reactor, RTD curves, Electrical conductivity. |
INTRODUCTION |
| A technology known as microbial fuel cells (MFCs) that convert the energy stored in chemical bonds in organic compounds to electrical energy achieved through the catalytic reactions by microorganisms has generated considerable interests among academic researchers in recent years [11]. For any treatment process the necessary component that determines its efficiency is the configuration of the reactor. Reactors play an important role in bringing a treatment process to its maximum efficient level. The reactors should be reliable and suitable for a process in an environmentally safe and in cost effective way. Major reason of designing a reactor is to obtain an ideal condition for analysing the reactor performance in treating wastewater. One of the best methods to assess the hydraulic performance of a reactor is by using dyes and tracers for measuring the residence time distribution curves. Tracer test in reactors can be conducted by injecting tracer into the influent end either as slug input or step input. Time of arrival of the tracer at the effluent level is determined by collecting tracer a series of samples over a period of time. Tracers of various types are used commonly to assess the hydraulic performance of the reactor used for waste water treatment. Tracer response curves, C curve (concentration versus time) is obtained and the hydrodynamic properties of the reactor are analysed [10].Real flow reactors that are not completely mixed exhibit behaviour that is between plug flow and completely mixed regime. The reactor flow behaviour is a function of the relative strength of the mixing process (or dispersion) compared to the advective flow. Single chambered microbial fuel cell with tubular reactor configuration can be analysed through the one dimensional problem. But the dispersion problems are three dimensional, as the dispersion coefficient varies with the direction and the degree of turbulence. Considering the equation of molecular diffusion, the transfer of mass by diffusion in stationary system can be represented as follows: |
| The negative sign in the equation (1) denotes that the diffusion takes place in the direction of decreasing concentration as described in Fick’s first law of diffusion. Similarly under the turbulent condition without flow, transfer of mass is brought about by “turbulent or eddy diffusion”. In this case, molecular diffusion term Dm is replaced by the turbulent diffusion term De. Under the turbulent flow condition, the longitudinal spreading of a tracer is caused by dispersion, measured as Coefficient of Dispersion D. D is an inclusive term which includes the effects of dispersion caused by advection (i.e., transport caused by difference in fluid velocity), turbulent eddies and molecular diffusion. While the magnitude of the molecular diffusion depends on the chemical and fluid properties, turbulent or eddy diffusion and dispersion depend primarily on the flow regime. During the literature review, it was observed that the equation 2 represents the Peclet Number of longitudinal dispersion. It is denoted by Pe. Pe = uL/D (2) The Peclet number represents the ratio of the mass transport brought about by advection and dispersion. If the Peclet Number is greater than 1, advection is the dominant factor in mass transport. If the Peclet number is less than 1, dispersion is the dominant factor in mass transport [8]. Based on the literatures it was evident that tracer should be easy to handle and identify effectively even after injecting into the feed stream. In this paper attempt was taken to conduct the tracer test in an optimized flow rate condition and to identify the effective concentration of the tracer at which the designed reactor might perform to higher level. |
II. MATERIALS AND METHODS |
| In this paper, attempt was taken to understand the process responsible for the distribution of substrate in the single chambered microbial fuel without a membrane and also to determine the hydrodynamic behaviour of the reactor with the presence of packed media and without packed media. Two tubular MFCs were taken for the study, one without packed media of Activated carbon and another one with packed media. The tracer tests were conducted using NaCl was conducted in the tubular reactors to identify presence of the dead zones and optimize the flow rates. NaCl tracer test was conducted in both the reactors and measured in terms of electrical conductivity using digital conductivity meter. Since the reactor is of tubular and horizontal section it is considered to have a non-ideal plug flow with axial dispersion. The hydrodynamic characteristics of the non–ideal reactors can be modelled by taking dispersion into the account as explained in literature [10]. |
III. DESIGN OF REACTOR AND EXPERIMENTAL SETUP |
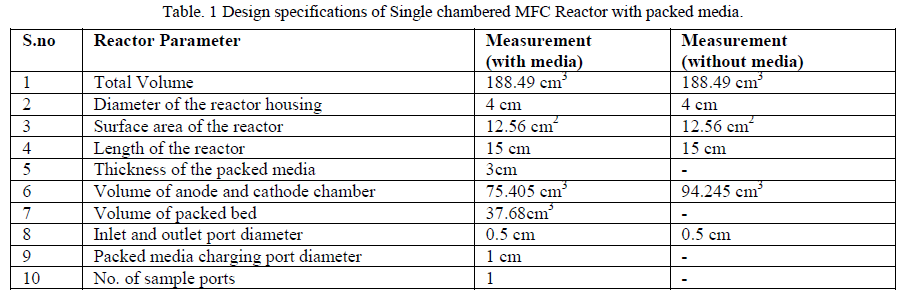
| Single chambered microbial fuel cell is constructed as a horizontal tubular reactor made of acrylic material. The reactors are of 15 cm in length with the diameter of 4 cm acrylic tubing and sealed with 2.5 cm thick acrylic blocks using rubber oaring. Based on several literatures, the reactor was designed as tubular and horizontal flow section. The design specifications of the both reactors are provided in Table I. Proposed design of the tubular reactor for MFC consists of 3 sampling ports and packed media consisting of Glass wool and activated carbon. Due to complications in the reactor media packing activated carbon layer alone was placed in the reactor for about 3 cm thickness. The activated carbon used was of 4/8 mesh size with iodine value of 550, made from coconut fronts. A charging hole was provided to fill the activated carbon between the perforated acrylic rings. |
 |
 |
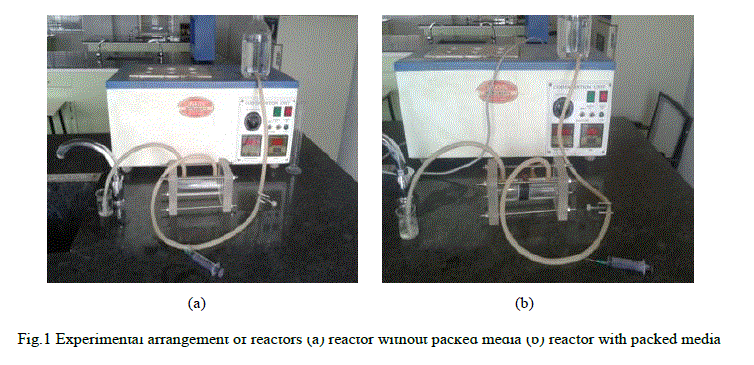
| The Single chambered MFC reactors are set up for the tracer test in a continuous mode to conduct the tracer study. Initially the tracer was connected to the 1 litre storage tank in which the tap water was filled continuously. The tracer was injected at the inlet tube using a 10 ml syringe at the beginning of each run. The samples are collected using 50 ml beakers at regular intervals of time. Figure 1a and 1b shows the reactors set up for tracer test. |
 |
IV. SELECTION OF TRACER AND OPERATIONAL PARAMETERS |
| The tracers selected for this investigation are NaCl (Sodium Chloride) and KMnO4 (Potassium Permanganate). KMnO4 was used for optimizing the flow rate for conducting the tracer test in both reactors and to detect the dead zone availability inside the reactors. Flow rate optimization was conducted by utilizing the KMnO4 tracer at a concentration of 5% by weight (5 gm. of KMnO4 in 100 ml of distilled water). The tracer solution was injected in the using a 10 ml syringe and flow rates were varied form 10 ml/minute, 20 ml/minute and 40 ml/minute. In this paper, tracer test was conducted through the slug input method. 10 ml of tracer was injected through the effluent inlet using a 10 ml syringe. The tracer test was conducted with the tap water and it was fed to the reactor from 1 litre storage glass container connected to the reactor using synthetic rubber tube. Initially, before conducting the tracer test with NaCl, optimization of flow rate was conducted using the KMnO4 of 5% concentration (5 grams in 100 ml distilled water). Flow rate optimization was done at three varying flow rates with same concentration of tracer. After the flow rate was justified and optimized, tracer test for analysing the hydrodynamic and mixing characteristics of the MFC reactors will be conducted using NaCl with three different concentrations. NaCl concentrations were taken by 5%, 10% and 15% concentration by weight (5, 10, 15 grams in 100 ml of distilled water). The tracer NaCl is measured as Electrical conductivity measures in micro Siemens using ELICO cm 183EC-TDS Analyser and the procedure was followed from the APHA manual [2] |
V. RESULTS AND DISCUSSION |
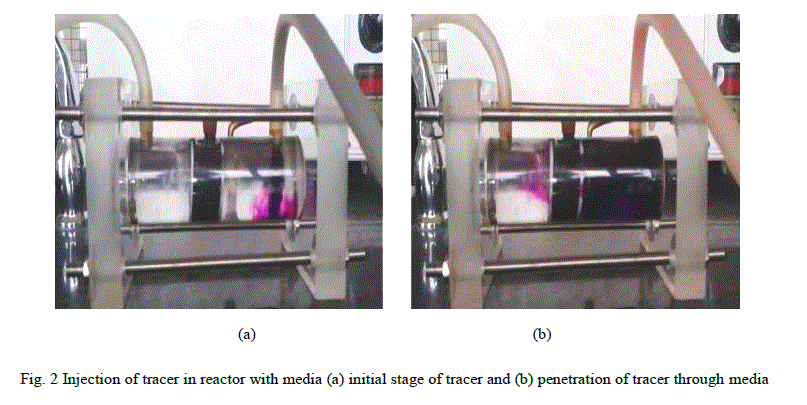
| After the experimental arrangements were made both reactors was analysed one by one, first the MFC reactor with the packed media and later the reactor without media. Since it is the tubular reactor in horizontal axis, the inlet and outlet of the reactor were placed in the upper side of the reactor. Tap water was filled continuously in the storage container and flow was adjusted using the screw holder placed at the tubing. Once all arrangements were made, KMnO4 tracer was prepared and 10ml of was taken in the syringe and made ready for injecting. As soon as the flow was made continuous the tracer was injected into the reactor with 10 ml/minute as the initial flow rate. Since the reactor is of relatively small volume, the tracer reached the outlet end in fractions of seconds. The presence of Activated carbon media in the reactor reduced the internal mixing of the tracer with the tap water. Since the flow rate was too slow, tracer got trapped at the inlet for a while and then stated flowing through the media and reached the other compartment. The same procedure was followed for flow rates 20 ml/minute and 40 mi/minute. During the tracer study the trapping of KMnO4 was found in the reactor with media at the flow rates of 1ml/minute and 20 ml/minute, whereas at 40ml/minute no trapping was found and tracer passed through the reactor without any disturbance. Figure 2a and 2b shows the flow pattern of tracer inside the MFC reactor with packed media. Since there was a packed media, the tracer as it entered into the reactor was not dispersed immediately, it was observed that the tracer was stagnated in the inlet and slowly penetrated through the media. The tracer passed out of the reactor without any dead zone at all the flow rates adopted |
 |
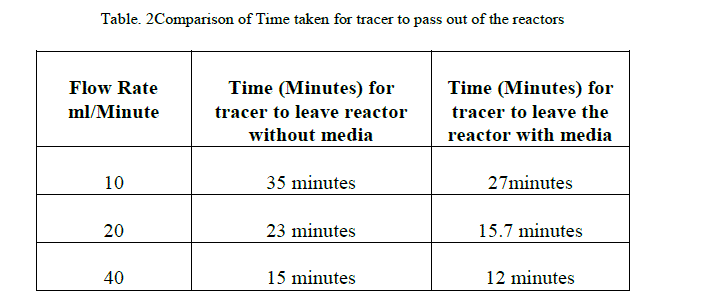
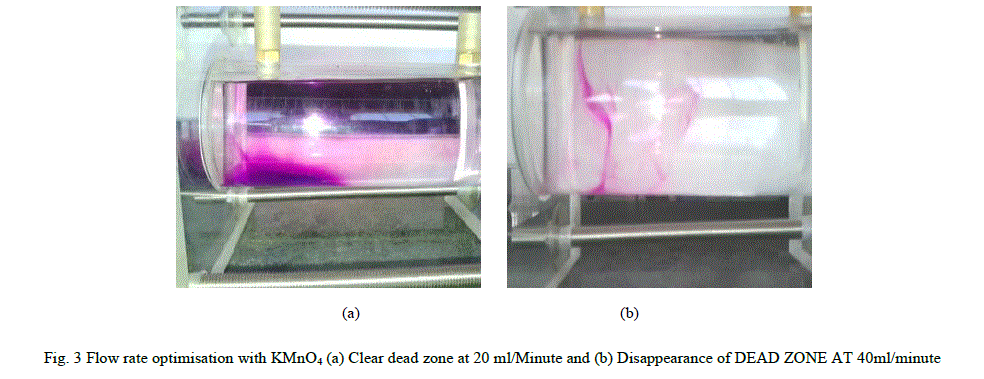
| Once the above test was conducted, Flow rate determination in reactor without media was conducted using the same tracer of 5% concentration with same flow rates. But in this case, as there was no packed media in the reactor dead zones were seen in the reactor while operating at the flow rates of 10 ml/minutes and 20 ml/minutes. Table 2 shows the time taken by the tracer to pass out of the both reactors. From the table, it was clearly stated that, the time taken by the tracer to pass out of the reactor decreased with increase in flow rate. As the result flow rate of 40ml/minute has the times of 12 minutes for the tracer to completely pass out of the reactor. |
| Similarly, Figure 3a and 3b shows the dead zone availability and disappearance of dead zones with increase in flow rate. On comparing both the result of the reactor, 40 ml/minute was found to be proper flow rate which was suitable for conducting the tracer test for analysing the hydrodynamic and mixing pattern in the reactors. Hence the optimized flow rate for the both reactor were found to be 40ml/minute based on the time taken by the tracer (KMnO4 ) to leave the reactor and dead zone removal during the test. |
 |
Hydrodynamic Behaviour and Mixing Pattern Analysis: |
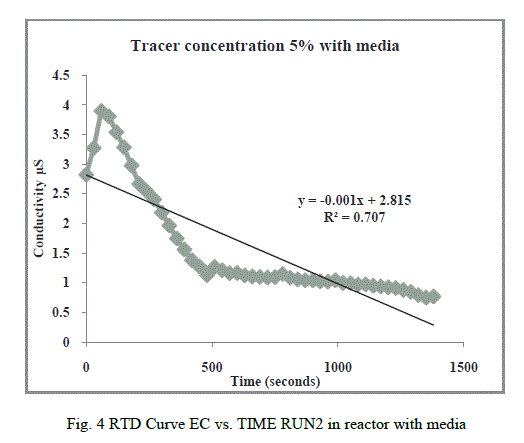
| After the flow rate optimization, 40 ml/minute was justified and tracer test using sodium chloride was initiated. Tracer test using NaCl was conducted at three different concentrations of 5%, 10%, and 15% are taken as mentioned above. Tracers of each concentration were injected into using 10 ml syringe at each run. Run1, Run2 and Run3 are conducted for both reactors respectively, with 5% tracer concentration at Run1, 10% tracer concentration at Run2 and 15 % concentration at Run3 for both reactors. Before each run was conducted, conductivity of tracer concentration were measured and recorded. Conductivity of the tap water was also rescored before the test was conducted. Grab samples were conducted at 30 seconds interval and EC reading was recorded in Micro Siemens. After the completion of each run for both reactors, calculations were made based on the assumption of plug flow with axial dispersion model and Peclet number, Standard deviation and mean were determined. Based on the obtained Electrical conductivity reading obtained graphs were plotted between Electrical Conductivity versus Time for all runs conducted in both reactors. The best run was selected by the regression value obtained from the graph. These plots are so called the RTD curves (Residence time distribution curves). Figure 4, shows the conductivity versus time plot for Run1 in reactor with packed media. It has the regression value of 0.704 for the tracer test with NaCl of 5% concentration conducted at the optimized flow rate of 40ml/minute. |
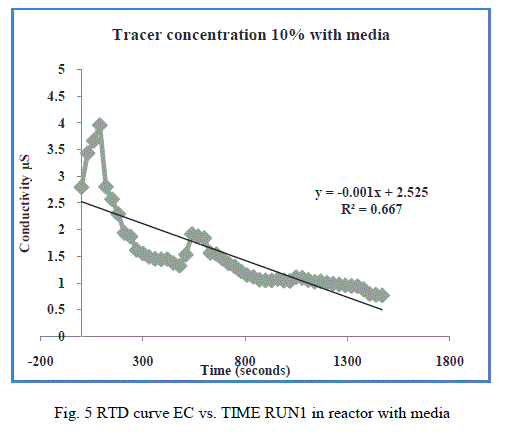
| Figure 5 shows conductivity versus time plot for Run2 in reactor with packed media. It has the regression value of 0.6678 for the tracer test with NaCl of 10% concentration conducted at the optimized flow rate of 40ml/minute. |
 |
 |
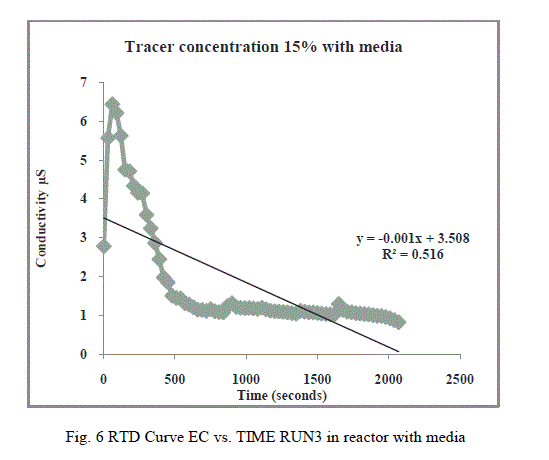 |
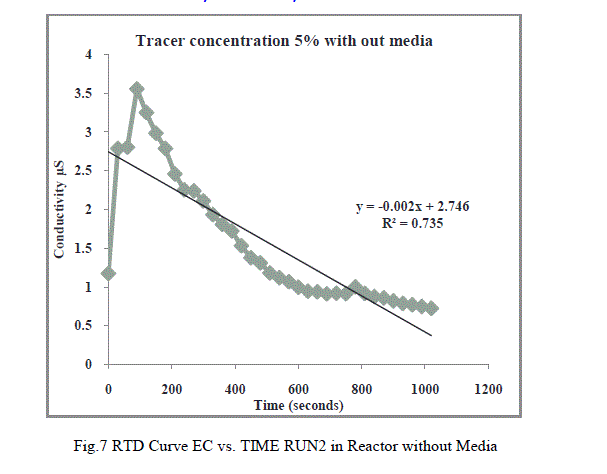
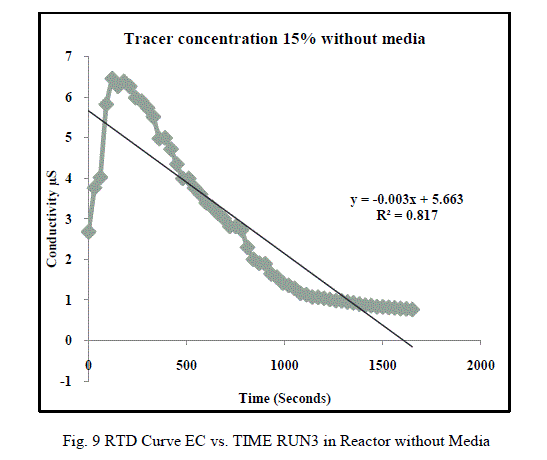
| Based on the analysis of the RTD curves plotted for both reactors at similar operating conditions resulted that the reactor with media has low regression values with maximum of 0.7074 in Run1, whereas the reactor without packed media showed a regression value of 0.8999 as maximum in Run2. Peclet number for the corresponding runs in the reactor without media mentioned above were 1.36, 2.269 and 3.426 which means the dominant factor in the reactor was advection process responsible for mass transport. But in Run3 of reactor with media, Peclet number was below 1, which means the dispersion has taken place longitudinally, during the runs in the reactor was reported in Metcalf and eddy [8]. |
 |
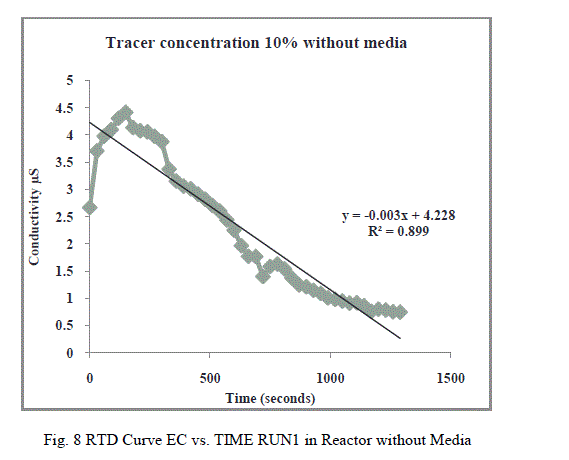 |
| Accordingly, Figure 7 and 8 shows the plot between conductivity versus time plot for Run1 and Run2in reactor without packed media. These two plots were obtained for the tracer test with NaCl of 5% and 10% concentrations respectively at the optimized flow rate of 40ml/minute in the reactor without packed media. Each RTD curve was plotted on the linear regression and the respective regression values were analysed to determine the effective performance. |
| Figure 9 shows the plot between conductivity versus time plot for Run3 in reactor without packed media. These two plots were obtained for the tracer test with NaCl of 15% concentrations respectively at the optimized flow rate of 40ml/minute in the reactor without packed media. |
 |
| Theoretical detention time τ was obtained for the reactors which was equal to 5.889 minutes and the mean residence time of both the reactor s were slightly higher that the theoretical time. Based on the applied plug flow with the axial dispersion model, dispersion number, d was obtained to be higher than 0.25 which means there was a high dispersion phenomenon occurred in both reactors axially with PLUG FLOW PATTERN. Entire test was conducted at the optimized flow rate of 40ml/minute. Dispersion numbers obtained for both reactors shows that there has been high dispersion phenomenon occurred inside the reactor based on the condition d>0.25.This states that there was high degree of axial dispersion with the plug flow pattern in both the reactors as explained in Metcalf and eddy [8]. Table 3 shows the corresponding regression values, Peclet number Pe, Mean and Standard deviation, Dispersion number d, Dispersion Coefficient determined for the graphs plotted for both reactors at each run. |
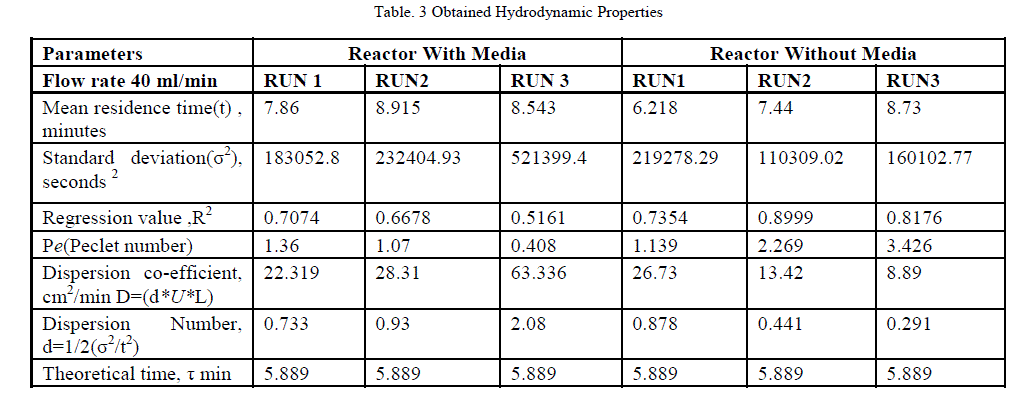 |
| The mean residence time obtained for each run varies slightly from theoretical detention time of the reactors. But from the Peclet number Pe, it was clear that advection is the dominant factor in mass transport in the reactor without media. Both dispersion and advection were the influencing factor in the reactor with media based on the Peclet number obtained in each run. During each run it was observed that some electrical conductivity was measured when flushing was done in reactors after each run. It shows that there was some dead zone or trapping of the tracer slug inside the reactors. The measured conductivity of tracers prepared varies from the EC value measured after tracer injection in to the reactor. This is due to the high dilution property of the sodium chloride with water. |
VI. CONCLUSION |
| Tubular reactors designed in this project for the Single Chambered Microbial Fuel cell were found to be in Plug flow reactor pattern with advection being the dominant factor responsible for mass transport inside the reactors. Most accurately it has been found that the reactor without packed media shows the best characteristics that can be suitable for the implementation for MICROBIAL FUEL CELL than the reactor with packed media. Run 2 of the reactor with media showed the regression value of 0.899, which states the optimal concentration of tracer for the reactor is 10% at flow rate of 40 ml/min. similarly deviation on the reactor with packed media, justifies that the reactor have the possibility of providing reduced efficiency at higher concentration feeds. Hence from this study it is understood that, the reactor without packed media can provide effective result for lab scale Single Chambered Microbial Fuel cell than the reactor with packed media. |
References |
|