International Journal of Innovative Research in Science, Engineering and Technology
ISSN ONLINE(2319-8753)PRINT(2347-6710)
ISSN ONLINE(2319-8753)PRINT(2347-6710)
Vijaya S. Sangawar2, Roshani N. Bhagat1
|
| Related article at Pubmed, Scholar Google |
Visit for more related articles at International Journal of Innovative Research in Science, Engineering and Technology
Poly(ethylene oxide) (PEO) complexed with Cadmium sulfide (CdS) are prepared by a solution cast technique. Several experimental techniques such as XRD, SEM, FTIR, DSC, PL and Raman spectroscopy are employed to characterize the sample. The powder X-ray diffraction (XRD) result indicates that the nanoparticles are crystallized in cubic phase. The UV-visible absorption, Differential scanning calorimetry, Photoluminescence and Raman spectra of the sample are recorded and discussed briefly.
Keywords |
| CdS/PEO thin film, XRD, SEM, FTIR, DSC, UV, PL, Raman Spectroscopy |
I. INTRODUCTION |
| Composites of inorganic particles with polymers is an interesting research subject because of the important potential applications in photocatalytic degradation of polymers, the production of controlled release products such as pesticides and drugs, and in the fields of adhesives, textiles, optics and electronics. The polymer nanocomposites has been successfully used for various stable inorganic colloids free from aggregation, such as titanium oxide, zinc oxide, magnetic and metal nanoparticles [1, 2]. |
| Polyïÿýïÿýethylene oxideïÿýïÿý has known to exhibit the property to solvate high concentration of ionic salts. The complexation of ionic salts with PEO has been the subject of active interest in polymer electrolytes, where the weak columbic interaction between the cations and ether oxygen being the major to facilitate ion pair separation. Over the last three decades, many polymeric electrolytes are based on various salts dissolved in polyethers, particularly PEO have been widely investigated because of their applications in high performance batteries. |
II. EXPERIMENTAL |
| The resin used in this work is poly (ethylene oxide) resin (M W 4,000,000). Thin films of CdS/PEO thin film were prepared by dissolving PEO resin in deionised water at 1000C; the CdS powder was dissolved in this solution at the same temperature. This solution mixed together for one hour by using a magnetic stirrer until a homogenous solution is obtained. Then the mixture was cast on a leveled glass substrate and evaporating the solvent at room temperature under normal atmospheric pressure. Samples of different concentrations were dried at room temperature for two days. The drying process was repeated until prepared membranes have fixed weight to ensure the removal of solvent traces and to ensure uniform thickness. Then after completing evaporation, the film was detached from ring surface. In this way, the films were prepared by solution evaporation technique (casting method). (PEO + CdS) were prepared in the laboratory by weight percent method with an accuracy of 0.0001 g., Electronic single pan balance. The prepared films contain 5, 10, 15 and 20 wt%. |
III. RESULT & DISCUSSION |
X-RAY DIFFRACTOGRAM (XRD) |
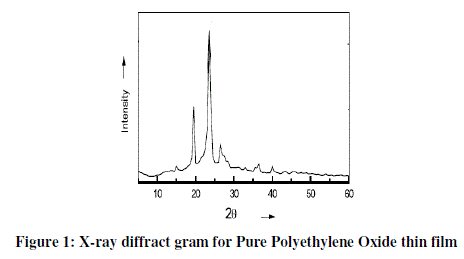
| The X-ray diffraction (XRD) spectra for Pure PEO samples are shown in Figure 1. The peaks present at 2θ=18.77°, 22.42°, 28°, 43.18 and 52°. The strongest XRD peak at 2θ=22.42°. |
 |
| Figure 1 (a- d) shows the X-ray diffraction patterns of 1, 5, 10 & 15 wt. % for CdS/PEO nanocomposite thin film. Few differences in diffraction patterns are identified between the pure PEO & composite films. |
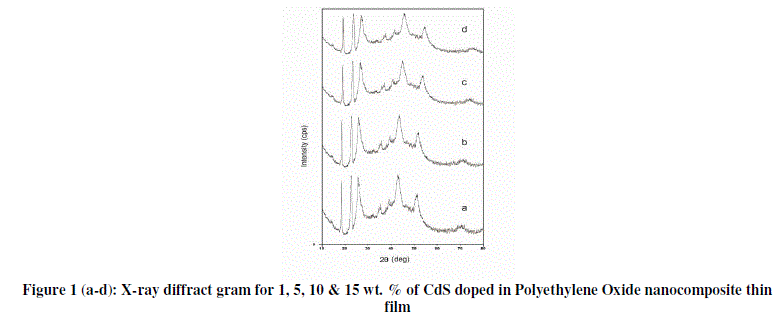 |
| First, the diffraction peaks between 2θ=15–30°, clearly apparent in pure PEO [3, 4] were found to be less prominent in nanocomposites thin films. Accompanying the decrease is in the gradual broadening of the diffractions with increasing wt. % of CdS in PEO [5]. The peaks exhibit a drastic decrease of their intensity with broadening at higher wt. % of CdS. The results affirm both the decrease of degree of crystallinity and the lamellae size with increasing CdS. The lost of long-range order in X-ray diffraction results evidence of decrease in crystallinity with increasing the concentration of CdS [5]. From diffractograms it is observed that as % of CdS in PEO increases peak shifted towards the lower angle, along with increase in peak width where as peak height decreases. This type of findings might be due to the small size of the crystal. Apart from these diffraction peaks, two broad peaks observed at an angle 2θ=43.180 &520 respectively which analogous to the presence of CdS in PEO, which are clearly observed in pure CdS diffractogram. |
SCANNING ELECTRON MICROSCOPY (SEM) |
| SEM micrographs as shown in figure 2 reveal some interesting morphological differences between pure CdS and CdS/PEO nanocomposites thin film with different wt.% i.e. 1, 5, 10 & 15%. From figure it is shows that CdS nanoparticles are dispersed in PEO thoughout the thin film, having homogenous phase structure. The synthesized particles are in the nanoscale range (4 nm) [6]. All nanoparticles are spherical in shape. The small size and monodispersion indicated necessity of the capping agent for synthesis of nanoparticles [7]. Figure 2 (a-d) shows that CdS are in well dispersed form in PEO microspheres and this dispersion is non uniform. Particles are crystal in the polymer matrix. As wt. % increases (figure 2 (a-d)ïÿýïÿý presence of number of CdS particle increases and also the agglomeration are clearly observed. |
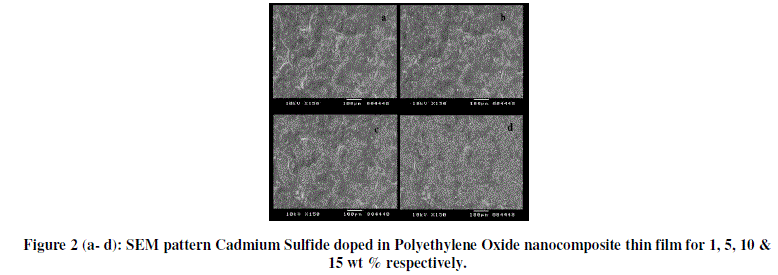 |
| Thus SEM of all the samples revealed the formation of nanocomposites. The SEM images for lower loading percentage of CdS were similar to one another but when the CdS proportion reached towards highest value, the morphology of CdS can be easily observed in host matrix. |
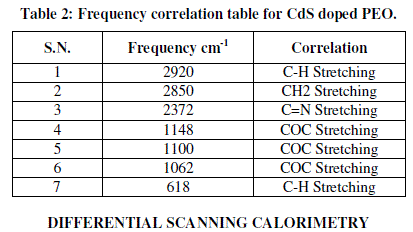
INFRARED SPECTROSCOPY (FTIR) |
| The FTIR technique is very important in this work since it allows one to study the specific interactions between the polymer and organic compound. |
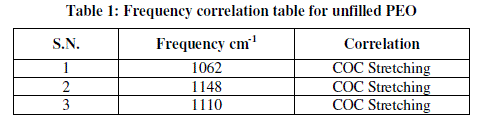 |
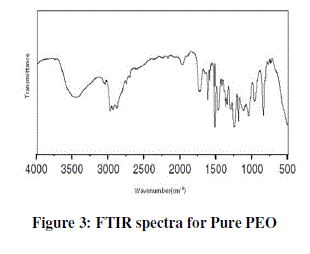
| Figure 3 shows IR spectra of pure PEO film and their corresponding frequency correlations are enclosed in table 1. In figure pure PEO transmission spectra in the range of 1250-950 cm-1 and the presence of the crystalline PEO phase is confirmed by the presence of the triplet peak of the COC stretching vibration at 1148, 1110, and 1062 cm-1 with maximum at 1110 cm-1 [8, 9]. |
 |
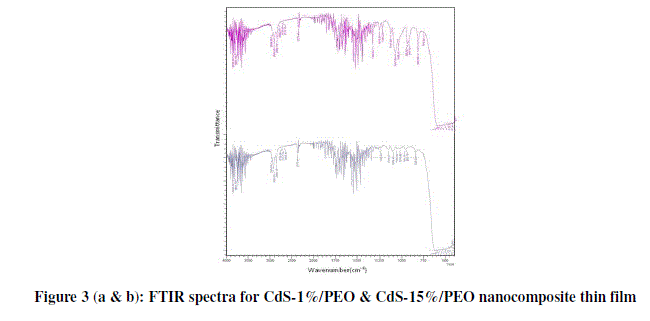
| Figure 3 (a & b) presents the FTIR transmission spectra of CdS/PEO nanocomposite thin film for wt. % 1 and 15 respectively from 4000 to 500 cm-1 and their corresponding frequency correlations are enclosed in table 2. The aliphatic CH stretching vibrational bond found at 2920 cm-1. Absorption at 2850 cm-1 is due to CH2 asymmetric stretching. The weak peaks due to C=N stretching are observed at about 2372 cm-1. It is apparent that COC stretching and the deformation broad band width at intensity around 1100 cm-1. Changes in the intensity, shape, and position of the COC stretching mode are associated with the interaction between PEO and CdS. The bands at 1148 and 1062 cm-1, attributed to the combined mode COC stretching and CH2 rocking, respectively. It is also verified by its CH3-stretching vibrations occurring as very weak peaks just below 3000 cm-1. The weak peaks due to C-H stretching are observed at about 618cm-1. These observations convincingly support template role of Urea in the control of the size of CdS particles. Other peaks are also observed to be shifted and the intensity of these peaks increases as the amount of CdS increases in the composites [10]. |
 |
 |
DIFFERENTIAL SCANNING CALORIMETRY |
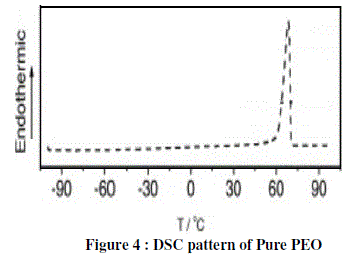
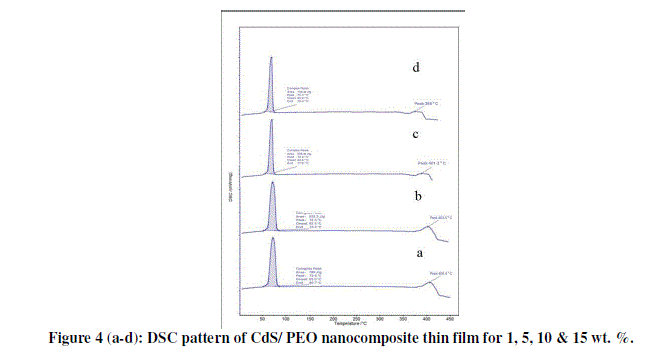
| Figure 4 shows the DSC curves of pure PEO measured at a scanning rate of 10 C/min. The glass transition temperature of pure PEO was found to be 70°C Tg. |
 |
| The differential scanning calorimetry (DSC) curves of CdS/PEO composite thin film for 1, 5, 10 & 15 wt. % is given in figure 4 (a-d). First peak of all the samples gives the melting point of PEO while second peaks are due to impurity of Urea in CdS. DSC investigations suggested lower degree of crystallinity and smaller lamella size with the addition of CdS to PEO. This signifies that CdS is well dissociated to effect the weak complexation with PEO, which leads to the disruption of continuous crystallite, and gives rise to smaller lamellae dimention. Although, this function is in close resemblance to that previously reported for lithium and KI salts, the complexation of CdS with PEO appears to be stronger, and more pronounced in the reduction of PEO crystallinity and spherulites [11]. |
 |
ULTRAVIOLET SPECTROSCOPY (UV) |
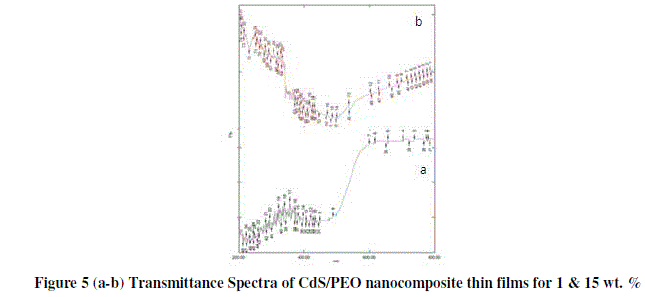
| Transmission spectra of films were recorded as a function of wavelength in the range of 400-800 nm. The transmittance spectra of the CdS/PEO nanocomposite thin films in the visible region for different wt. % are shown in the figure 5 (a-b). It reveals that the transmittance decreases with the increases filler concentration. |
 |
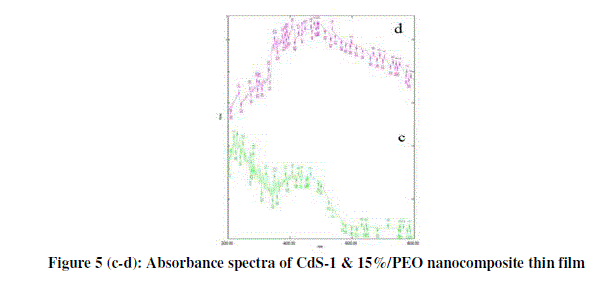
| From figure 5 (c-d) optical properties of nanocomposite thin films are determined from absorbance measurements in the range of 300-900 nm. The absorption coefficient can be written in terms of the incident radiation energy. |
| Α = A(hγ-Eg) |
| Where ‘h’ is the Plank’s constant and ‘γ’ is the frequency of the incident radiation. |
 |
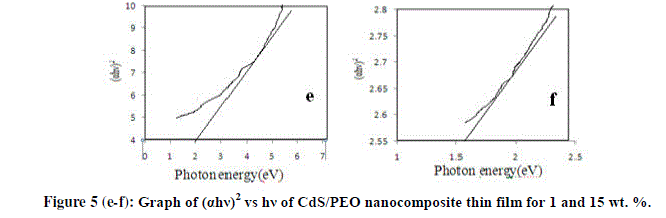
| The optical band gap can be obtained by extra plotting the linear portion of the plot (αhγ)2 versus hγ. From plot, the variation of (αhγ)2 versus photon energy for different wt. % (i.e. 1& 15) are shown in figure 5 (e-f) respectively. The presence of a single phase in nature and the type of transition is direct and allowed [12]. The direct band values of the thin films are found to be 2 eV and 1.6 eV. Thus, the filler concentration increases band gap energy value decreases. |
 |
PHOTOLUMINESCENE (PL) ANALYSES EMISSION SPECTRUM ANALYSES |
| Photoluminescence of CdS doped PEO nanocomposite thin film of different wt. % are shown in figure 6 (a-d) PL peak of PEO is reported between 350 nm to 480 nm and is attributed to π-π* transition. In our case it is centred on 385 nm for all composition. In the PL spectra all composition i.e. 1, 5, 10 & 15 wt. % of CdS doped in PEO nanocomposite thin films this emission peak is shifted towards higher wavelength (upto 400 nm), this red shift in PL spectrum of all blends is an evidence for the formation of new bonds and miscibility of the polymers as has been observed in SEM and optical micrographs. |
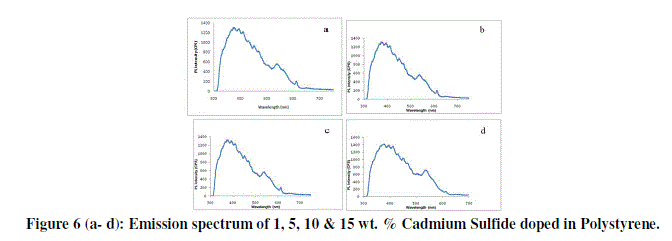 |
| The enhancement of PL emission intensity with CdS/PEO nanocomposite content can also be explained as follows: There are electron donating groups in CdS and electron withdrawing groups in PEO, which enhance the mobility of π#electron in the films. So as CdS content increases the combination probability and electron mobility increases further. This is turn favours the formation of singlet excitons, which decay radiatively to ground state resulting in enhanced PL emission intensity. |
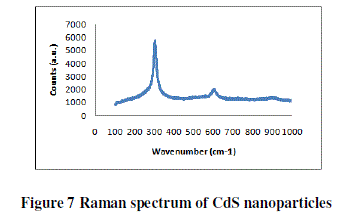
| RAMAN SPECTROSCOPY |
| The Raman spectra of the prepared samples of CdS-15%/PEO thin film were recorded shown in figure 7 in the range 100- 1000 cm-1. The spectrum of as prepared sample exhibited an intense, broad peak at 303.54 cm-1 corresponding to the LO phonon mode. Higher order phonon modes were also observed at 606.334 and 912 cm-1 in the spectra. A noticeable asymmetry in the Raman line shape indicated the effect of phonon confinement. |
 |
IV. CONCLUSION |
| We have successfully prepared a new PEO composite thin film using CdS as a filler by solution casting technique. The complex formation in CdS/PEO composite system has been confirmed from the XRD results. SEM it is evident that the nanoparticles of CdS are dispersed in PEO throughout the thin film, having homogenous phase structure. FTIR confirms that the prepared sample is PEO/CdS thin film. In DSC first peak of all the samples gives the melting point of PEO while second peaks are due to impurity of Urea in CdS. From UV-absorption spectra, the transmittance spectra reveal that the transmittance decreases with the increases filler concentration. The energy band gap was estimated using the Tauc relation is found to be 2 eV and 1.6 eV. Thus, the filler concentration increases band gap energy value decreases. In the PL spectra all composition i.e. 1, 5, 10 & 15 wt. % of CdS doped in PEO nanocomposite thin films this emission peak is shifted towards higher wavelength. In Raman Spectroscopy asymmetry in the Raman line shape indicated the effect of phonon confinement. |
References |
|