Research & Reviews: Journal of Microbiology and Biotechnology
E- ISSN: 2320 - 3528
P- ISSN: 2347 - 2286
E- ISSN: 2320 - 3528
P- ISSN: 2347 - 2286
Hongfei Yu1, Liuyang Wang1, Lijun Guo1, Yiming Chen1, Wensheng Qin2 and Yun Liu1*
1Beijing Key Laboratory of Bioprocess, College of Life Science and Technology, Beijing University of Chemical Technology, Beijing, P R China
2Department of Biology, Lake head University, Ontario, Canada
Received date: 07/08/2017; Accepted date: 28/09/2017; Published date: 03/10/2017
Visit for more related articles at Research & Reviews: Journal of Microbiology and Biotechnology
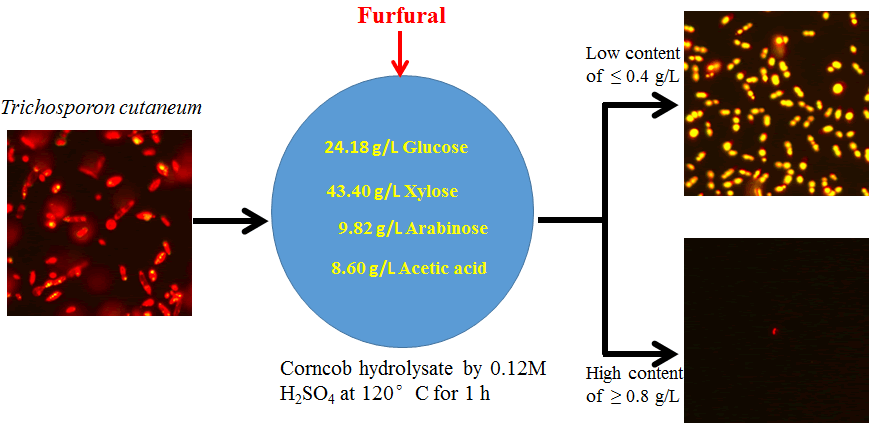
Oleaginous yeast Trichosporon cutaneum is an ideal strain to produce microbial lipids by fermentation on corncob hydrolysate. However, furfural, routinely generated during lignocellulose hydrolysis, shows detrimental effects on microbial lipids accumulation, which mechanism has not been well marked so far. In this paper, corncob biomass was hydrolyzed by 0.12 M dilute H2SO4 and directly used as the T. cutaneum fermentation medium. The different initial furfural content was obtained by adding the proportional amount of furfural into the detoxified corncob hydrolysates. To explore the furfural-mediated mechanism on microbial lipids accumulation in this work, atomic force microscopy was used for visualizing the morphology characteristics and high performance liquid chromatograph was employed for evaluating the furfural metabolism of the yeast during the furfural-detrimental process. Furthermore, flow cytometry was used to monitor the yeast growth and fluorescence spectroscopy was imaged in the dynamics process of microbial lipids accumulation. Analysis reveals that furfural at a low concentration (≤ 0.4 g/L) can be metabolized by the yeast into 2-furoic acid with little detrimental effect on microbial lipids accumulation. The furfural detriment mechanism relating to the damage of cytomembrane for preventing the yeast cell growth is proposed as the main cause of no microbial lipids accumulation of T. cutaneum in high concentration furfural situations (≥ 0.6 g/L). These results provide valuable information for developing and designing a more efficient biomass-into-lipid fermentation bioprocess.
Trichosporon cutaneum; Microbial lipid accumulation; Furfural; Detrimental mechanism; Biomass-into-lipids bioprocessing
In the last two decades, a common concern has been the considered microbial lipids produced by oleaginous yeasts as an alternative to vegetable oil feedstock for biodiesel production [1,2]. Recently, substantial attention is turning towards the biomass-into-lipids bioprocess due to the low cost and substantial amount of lignocellulosic resources. Some excellent research papers and/or review articles on this topic have been available in the scientific literature. For example, Zhang and co-workers [3] used Laminaria residue hydrolysates for lipid production by Rhodosporidium toruloides Y4 and Rhodotorula glutinis AS 2.107, and lipid yields and cellular lipid contents reached 0.16 g g-1 Total Reducing Sugar (TRS) and 37.6%, and 0.07 g g-1 TRS and 22.2%, respectively. Liu et al. [4] investigated the lipid production by R. glutinis with undetoxified corncob hydrolysate, lipid titer and cellular lipid content reached 5.5 g L-1 and 36.4%, respectively. Gao and co-workers [5] reported Trichosporon cutaneum ACCC 20271 for lipid fermentation using corncob residue hydrolysates, and the lipid titer of 12.3 g/L and Dry Cell Weight (DCW) of 38.4 g/L were the highest values. Hu et al. [6] found that yeast T. cutaneum AS 2.571 could simultaneously utilize glucose and xylose for lipids production during fermentation of corn stover hydrolysate with a lipid content and coefficient of 39.2% and 0.15 g.g-1 sugar, respectively. Jin and co-workers [2] gave an overview of the feasibility and challenges that exist in realizing microbial lipid production from lignocellulosic biomass in biorefinery. Thus, various oleaginous yeast strains have displayed the potential of growth and microbial lipids production from biomass-into-lipids bioprocess, although it will take a long time before practical applications.
In view of the biomass-into-lipid bioprocess of oleaginous yeasts, the most immediate technical barrier for lipid production is the existence of many inhibitors in the lignocellulose hydrolysates, which show detrimental effects on yeast cell growth and intracellular lipid accumulation. T. cutaneum is oleaginous yeast capable of utilizing various sugars such as glucose, xylose, cellobiose, lactose [6] and robust-to- high levels of lignocellulose-derived inhibitors with considerable lipid accumulation capacity [7]. Wang and co-workers [7] demonstrated that T. cutaneum ACCC 20271 was relatively sensitive to inhibitor furans (including furfural and 4-hydroxybenzaldehyde), but strongly tolerant to high titers of inhibitor weak acids (including formic acid, acetic acid, levulinic acid) and phenolic compounds (including vanillin and syringaldehyde). On the contrary, in the previous study of the same group reported in 2009, Chen and co-workers [8] found that acetic acid, formic acid, furfural and vanillin were the strong inhibitors for the fermentation of oleaginous yeast T. cutaneum, while levulinic acid, 5-hydroxymethylfurfural and hydroxybenzaldehyde were relatively weak inhibitors. The above seemly contradictory phenomena show the inhibitors not only have the detrimental effects on intracellular lipid accumulation of yeast T. cutaneum, but also their inhibitory mechanism may be different and dependent on the inhibitor type existing within lignocellulosic hydrolysate. Common concern has indicated that furfural shows the strongest negative inhibitory effect on microorganism growth on lignocellulose hydrolysate.
Therefore, to fully advance understanding of the effect of inhibitors on lipid accumulation potentials of oleaginous yeast T. cutaneum using lignocellulose hydrolysate as cultivation medium in this work, the furfural-mediated mechanism was for the first time investigated from the views of the yeast cell morphology characteristics visualized by Atomic Force Microscopy (AFM) and furfural metabolism products detected by High Performance Liquid Chromatograph (HPLC) during the furfural-detrimental process. In addition, Flow Cytometry (FCM) was used to monitor the yeast growth and Fluorescence Spectroscopy (FS) was imaged in the dynamics process of microbial lipids accumulation.
To achieve the above-mentioned objectives, the corncob biomass was hydrolyzed by 0.12 M dilute acid H2SO4, followed by detoxification with Ca(OH)2 over liming to remove the inhibitors in the hydrolysate. The different initial furfural content (0.4, 0.8 and 1.2 g/L) was obtained by adding the amount proportion of furfural into the detoxified corncob hydrolysate. The detoxified corncob hydrolysate was directly used as cultivation medium for lipids
Fermentation as the blank reference in this work.
Microorganism and Chemicals
T. cutaneum ACCC 2.571 (Agricultural Culture Collection of China (ACCC), Beijing, China, http://www.accc.org.cn/) was used for microbial oil production in this work. The strain was routinely stored on malt agar medium at 4ºC in the fringe. Furfural (AR, 99%) was obtained from Shanghai Chemical Reagent Co., LTD (China). All other chemicals were from commercial sources and were of the highest purity available.
Corncob acid Hydrolysis and Detoxification
Corncob, gifted from Hunan Institute of Nuclear Agricultural Science and Space Breeding (Hunan, China), was milled and air-dried as raw material. The corncob was pretreated with irradiation according to the method reported by Zhou et al. [9]. The pretreated corncob was hydrolyzed in a 500 mL high pressure reactor (Beijing, China) using 0.12 M dilute acid H2SO4 at 120ºC for 1 h. After being separated with solid residue, the corncob acid hydrolysate has been detoxified by Ca(OH)2 over liming for 20 h [10]. Then the detoxified corncob hydrolysate was obtained through removing CaSO4 precipitation and adjusting pH 6.0. The concentrations of sugars and furan compounds in the detoxified corncob hydrolysate were analyzed by high-performance liquid chromatography (HPLC) to ensure no furan inhibitors were detected in this hydrolysate. The sugar composition of this hydrolysate was: glucose 24.18 g/L, xylose 43.40 g/L and arabinose 9.82 g/L. In addition, 8.6 g/L of acetate was determined in this hydrolysate.
Culture Medium and Microbial Oil Production
Without nutrient addition, the detoxified corncob acid hydrolysate (initial pH 6.0) with different furfural content was used as a culture medium for lipid production by T. cutaneum. The different initial furfural content was obtained by adding the proportional amount of furfural into the detoxified corncob hydrolysates. The final concentrations of furfural in corncob hydrolysate were fixed at 0.4, 0.8 and 1.2 g/L in this work.
The yeast was first cultured on YPD medium (20 g/L of glucose, 20 g/L of peptone and 10 g/L of yeast extract) at 30ºC and 150 rpm for 12 h, then 10% of the culture broth was inoculated into the fresh YPD medium and cultured at 30ºC and 150 rpm for 24 h, which was used as the seed culture of lipid fermentation. Then 10% seed culture was inoculated into the corncob hydrolysate. Cultivation was performed in a 250 mL conical flask containing 50 mL of hydrolysate in a rotary shaker at 28ºC and 150 rpm for designed periods. At predefined intervals, yeast cell growth, oil accumulation, sugar content and the furfural metabolism product were monitored as follows.
Cell Growth and Cell Dried Weight
The yeast cell growth (OD600) on corncob hydrolysate with different furfural content was measured d by 756CRT UV-vis spectroscopy (Shanghai Youke Co., China) at 600 nm. The microbial cell biomass, expressed as Dry Cell Weight (DCW), was harvested based on methods described in the literature [6], followed by biomass freeze-drying to constant weight.
Flow Cytometry (FCM)
Flow Cytometry (FCM) experiments were carried out according to the method reported by Linger and co-workers [11]. Briefly, yeast cell samples taken from the medium at 48 h cultivation were immediately diluted with the phosphate buffer solution (PBS, pH 7.0) to approximately 106 cells/mL and the cells were stained with 0.1 mg/ml Nile Red dissolved in Dimethyl Sulfoxide (DMSO) for 15 min. After washing two times with PBS (pH=7.0) and centrifuged at 5000 xg for 5 min, the stained yeast cell was re-suspended with PBS for flow cytometry measurement. Flow cytometry was carried out using a MoFlo XDP FCM instrument (Beckman Coulter, USA) fitted with a 22 mW ion laser for excitation (488 nm) while monitoring with a single emission channel (610 nm band-pass filter). Cell Lab Quanta SC software (Beckman Coulter, USA) was used for instrument control, data acquisition and data analysis. For each sample, 20,000 cells were recorded to generate the FCM histograms. All trials were carried out in triplicate and the final data expressed by average value were analyzed by Origin 8.0 software (product of Originlab Co., Northampton, Mass, USA).
Atomic Force Microscopy (AFM)
Yeast cell morphology properties were visualized with Atomic Force Microscopy (AFM), which was performed according to the procedures reported in the literature [12]. AFM images were recorded on a dimension FastScan AFM (Bruker, German) in ScanAsyst mode under ambient conditions. Scanning frequency was 1.49 Hz. Height and amplitude images of T. cutaneum were recorded simultaneously in the tapping mode (in air) with an MPP-11100 etched silicon probe with a nominal frequency of 300 KHz and a nominal spring constant of 40 N m-1. Root Mean Square (RMS) was commonly used to express the surface roughness after image flattening and plane fitting of the height images using the software that came with the instrument.
A 200 µL portion of the cell suspension was withdrawn from the culture of corncob hydrolysate with different furfural concentrations after 48 h cultivation. The suspension was centrifuged at 5,000 xg in an Eppendorf centrifuge for 2 min. The supernatant was removed and the cell pellet was washed with sterile water twice and fixed with 10% formaldehyde for 4 h. Then, through centrifugation at 5,000 xg for 5 min, the fixed cell pellet was obtained. This procedure was repeated twice. Finally, the fixed cell pellet was re-suspended in sterile water with OD600 equal to 0.1. A 5 µL portion of the cell suspension was placed on a freshly cleaved mica substrate and dried in air for 3 min immediately. All AFM measurements were made within an hour. Extra caution should be taken for guaranteeing the consistency of sample preparation and imaging conditions.
Fluorescent Microscopy (FS)
Lipid accumulation was visualized using DM1000 fluorescence microscopy (Leica, Germany). The preparation of yeast cells for imaging was according to the method reported previously [13]. Briefly, 0.5 mL of culture broth grown in corncob hydrolysate with different furfural concentrations was harvested at t=0, 48, 96, 144 h post-inoculation via centrifugation at 5000 xg at room temperature for 5 min. After the culture supernatant was removed, cells pellets were washed twice in 1×PBS. Then, cells were stained with 0.1mg/mL Nile Red dissolved in DMSO for 15 min, followed by re-suspension in 1mL PBS. A 5 µL portion of the cell suspension was placed on a freshly clean glass slide in sterile condition and cells on cover slips were subjected to fluorescence detection. Images were acquired using a Nikon Eclipse 80i microscope. Nile Red fluorescence was detected at excitation wavelength 488 nm and emission wavelength 610 nm using band-pass filtering.
The concentrations of sugars, acetic acid, furfural and furoic acid were determined by U-3000 HPLC (Dionex, USA), equipped with a refractive index detector (RI-101, Shodex, USA) and UV detector (Alltech 1500ÃÆïÃâüÃâà âAlltech Co.ÃÆïÃâüÃâà âUSA), using an Aminex HPX-87H column (Bio-Rad, Hercules, CA, USA). The conditions of HPLC were: temperature 55ºC, UV wavelength at 210 nm and the mobile phase was 2.5 mM H2SO4 at a flow rate of 0.5 mL/min. The detailed procedures were modified according to our previous works [9,10].
Effect of Furfural Concentration on Substrates Metabolism and Cell Growth of Yeast T. cutaneum
Figure 1 depicts the substrates metabolism and cell growth of yeast T. cutaneum in corncob acid hydrolysate with different furfural concentrations.

Figure 1:The substrates metabolism and cell growth of yeast T. cutaneum in corncob acid hydrolysate with different furfural concentrations. A: without adding furfural (0 g/L, as control); B: 0.4 g/L furfural; C: 0.8 g/L furfural; D: 1.2 g/L furfural; E: Time course of yeast cell growth; D: dried cell weight (DCW) at 144 h cultivation.
As seen in Figure 1A, when the detoxified corncob hydrolysate without adding furfural was used as the culture medium (as the control), interestingly, T. cutaneum could assimilate glucose and xylose simultaneously, with even the average consumption rate of xylose (0.43 g/L.h) being a little higher than that of glucose (0.35 g/L.h). This unusual phenomenon in the yeast has been reported since 1998 in the literature [6,14,15]. Co-consumption of glucose and xylose in lignocellulosic hydrolysate is crucial for biomass-into-microbial oil bioprocess [16]. However, arabinose was almost not used by T. cutaneum after 96 h fermentation until glucose and xylose reached less being left in the culture medium. After 144 h cultivation, all sugars were almost exhausted by T. cutaneum. (Figure 1A) also shows that T. cutaneum consumed acetate and sugars simultaneously, rather than sequentially. This trend was in accordance to other oleaginous yeast (Cryptococcus curvatus) which could co-utilize acetate and sugars for facilitating microbial lipid production from lignocellulose hydrolysate [17]. Several studies also confirmed that acetate was effectively metabolized for oil production by oleaginous microorganisms such as Motierella isabellina, C. curvatus and Yarrowia lipolytica Po1g [18].
In the case of adding 0.4 g/L furfural in the detoxified corncob hydrolysate, the trend of substrates metabolism of yeast T. cutaneum was similar to that of the control (Figure 1B). In addition, the lag phase of cell growth of T. cutaneum was not observed with or without 0.4 g/L furfural in hydrolysate (Figure 1E). This result revealed that yeast T. cutaneum has the capacity to grow on corncob hemicellulose hydrolyzate with the presence of 0.4 g/L of furfural. The trend was in good accordance with other micro-organisms (Rhodotorula mucilaginosa, Aspergillus oryzae and Mucor plumbeus) on the hydrolysate of oil palm empty fruit bunch with 0.56 g/L of furfural [18]. However, Wang and co-workers demonstrated that T. cutaneum was relatively sensitive to furfural and 0.5 g/L of furfural within corncob hydrolysate led to the half reduction of the yeast cell growth [7].
To further confirm this phenomenon, when the concentration of furfural in hydrolysate was increased up to 0.8 g/L (Figure 1C), it was clearly observed that the consumption of sugars was lowered, which led to delaying the lag phase of yeast cell growth (Figure 1E). There was ∼35% of residual xylose remaining in the media at the end of 144 h cultivation, even the arabinose and acetate were not utilized during the final fermentation. When 1.2 g/L of furfural was used in the experiment, no consumption of sugars and acetate by yeast T. cutaneum was observed (Figure 1D) and the growth of yeast cell was almost ceased (Figure 1E).
After 144 h fermentation, the Dried Cell Weight (DCW) of yeast was harvested and evaluated in view of different concentrations of furfural situations. As seen in (Figure 1F), 30.2 g/L biomass of yeast cell was achieved when T. cutaneum grew on the detoxified corncob hydrolysate without furfural. However, the biomass of the yeast cell decreased with the increase of furfural concentrations in the cultivation medium, which values were 22.8 g/L, 13.6 g/L and 1.15 g/L for the furfural content of 0.4 g/L, 0.8 g/L and 1.2 g/L, respectively. The results were in good accordance with the above mentioned effect of furfural on substrates metabolism and cell growth of yeast T. cutaneum (Figures 1A-1E).
Effect of Furfural on Lipids accumulation of Yeast T. cutaneum
To test yeast T. cutaneum relatively sensitive to furfural or the furfural-detrimental effect on microbial oil accumulation, T. cutaneum was grown in 250-mL shake flasks filled with a cultivation medium with different concentrations of furfural. The inoculum of the yeast was 10 % (v/v). Flow Cytometry (FCM) was used in all cases to monitor the accumulation of microbial oil. As expected, T. cutaneum grew quite well in the detoxified corncob hydrolysate without or with 0.4 g/L of furfural. Intracellular lipid accumulates over 48h in the detoxified corncob hydrolysate without furfural, with a fluorescence intensity distribution at 610 nm, were similar to that with 0.4 g/L of furfural (Figure 2A). An equivalent cell density of T. cutaneum was quantified with fluorescence data as a function of culture type (Figure 2B). With an increase of furfural concentration in the culture medium, the cell density of yeast decreased (Figure 2B). This trend was in good accordance with the yeast cell growth curves in (Figure 1F). It revealed that high concentrations of furfural showed detrimental effects on yeast T. cutaneum growth.

Figure 2: The effect of furfural content on lipid accumulation of yeast T. cutaneum analyzed by flow cytometry method. (A) FCM histograms recorded from 20,000 cells of Nile Red-stained cells for lipid accumulation of T. cutaneum. Cell counts are plotted as a function of fluorescence intensity in the initial inoculum (t=0) and cultures at t=48 h for corncob hydrolysate medium with different furfural concentration. (B) Fluorescence imaging of cells grown on inoculum medium, detoxified corncob hydrolysate with 0.4, 0.8, and 1.2 g/L of furfural stained with Nile Red demonstrates microbial oil production (Upper). Fluorescence quantitation of T. cutaneum cells from the lipid accumulation as a function of culture type adjusted to an equivalent cell density (Lower).
In the cases of the control and 0.4 g/L of furfural situations, Nile Red staining via fluorescence microscopy and quantitation per cell confirmed that the primary increase in fluorescence, reflective of lipid accumulation, occurred within 48 h of cultivation. And fluorescence intensity reached the maximal value at 144 h cultivation in corncob dilute acid hydrolysate (Figure 3). In view of 0.8 g/L and 1.2 g/L of furfural media, Nile Red staining via fluorescence microscopy and quantitation per cell revealed that no lipid accumulation even in a few cells growth was observed (Figure 3).

Figure 3: Nile Red staining per cell via fluorescence microscopy of T. cutaneum cells from the lipid accumulation as a function of culture medium type under different concentrations of furfural (0, 0.4, 0.8 and 1.2 g/L) and cultivation time (at 0, 48 , 96 and 144 h).
Furfural Metabolism Pathway during Lipids Fermentation of T. cutaneum
To further understand the degradation pathway of furfural by T. cutaneum for lipid accumulation, HPLC was employed to monitor the furfural metabolism performance during lipids fermentation of T. cutaneum in corncob hydrolysate with different concentrations of furfural in a 250 mL flask reactor. The results are shown in (Figure 4). When the detoxified corncob hydrolysate (without adding extra furfural) was used as a culture medium, no 2-furoic acid, furfural derivative compound was observed at 24 h and 48 h fermentation. When adding furfural (0.4, 0.8 and 1.2 g/L) into the corncob hydrolysate, the furoic acid was detected at 24 h fermentation (Figure 4A,4B,4C), but no further decrease of furoic acids was observed from 24 h to 48 h fermentation. These results indicated that T. cutaneum could biodegrade furfural into its furoic acid and furoic acid might be the final metabolite of furfural by T. cutaneum [7]. Ran and co-workers found that furoic acid would be very slowly converted through six steps and finally enjoin glycolysis or the Tricarboxylic Acid (TCA) cycle [19]. However, furfural concentrations significantly affected its biodegradation rate. For instance, in view of 0.4 g/L of furfural existing in the corncob hydrolysate culture medium, no furfural was left and 0.3 g/L of furoic acid was observed after 24 h fermentation (Figure 4A). It suggested that the furfural was almost completely consumed by yeast T. cutaneum and biodegraded into furoic acid within 24 h. In case of 0.8 g/L furfural existing in the medium, only 25% of original furfural biodegraded by T. cutaneum was observed over the same fermentation period at 48 h (Figure 4B). For 1.2 g/L furfural existing in the medium, 96.7% of the original furfural (1.16 g/L) remained in the culture system, thus, approximately 3.3% of furfural was biodegraded by the yeast at 48 h (Figure 4C).

Figure 4: Furfural metabolism product and pathway by yeast T. cutaneum biodegradation in corncob acid hydrolysate with different concentrations of furfural. A: furfural content 0.4 g/L; B: furfural content 0.8 g/L; C: furfural content 1.2 g/L; D: furfural metabolism pathway by yeast T. cutaneum through three steps.
According to the above experimental results for T. cutaneum and the previous pathway studies of T. cutaneum by Wang et al. [7], A. resinae ZN1 by Ran et al. [19], and Cupriavidus basilensis HMF14 by Wierckx et al. [20], the metabolism pathway of furfural by T. cutaneum could be proposed for three steps as shown in (Figure 4D). Furfural was converted to its corresponding furfuryl alcohol at the first step by alcohol dehydrogenase or aldehyde reductase. Furfuryl alcohol is a relatively weaker inhibitor against T. cutaneum cell growth than furfural [7]. For the second step, the furfuryl alcohol was oxidized back to furfural by alcohol dehydrogenase or aldehyde reductase. Finally, furfural was oxidized to furoic acid by aldehyde oxidase under oxygen condition for the third conversion step. The further conversions of furoic acid might be stopped in T. cutaneum at 48 h according to the experimental results. For continuing three consequent conversion steps, furfural should be maintained at a very low level (≤ 0.4 g/L) so that it does not affect T. cutaneum growth and metabolism. Otherwise, if furfural concentrations in a culture medium are still kept at a high level (≥0.6 g/L), the yeast cell growth ceased as seen in (Figures 1C and 1D). Wang et al. [7] suggested that the encoding genes of oxidoreductase genes in genome were responsible for furfural degradation capacity and its concentration tolerance ability of yeast T. cutaneum.
Effect of Furfural on the Morphology Properties of Yeast T. cutaneum
In order to evaluate the tolerance capacity of yeast T. cutaneum against furfural concentrations, typical AFM images of yeast cells fixed by 10% formaldehyde were collected [12,13]. As shown in (Figures 5A and 5a), height images revealed that yeast T. cutaneum grown in the detoxified corncob hydrolysate without furfural for 48 h were oval-shaped and with smooth surfaces without any detectable fine structures. Panels (Figures 5B and 5b) were the corresponding amplitude images of the yeast. It showed that though the heights of the yeast bodies were different, the amplitude contrast of the yeast body was almost the same, indicating the homogenous distribution of the yeast cell surfaces.

Figure 5: Typical height and amplitude images of yeast T. cutaneum growth on corncob acid hydrolysate different concentrations of furfural (0, 0.4, 0.8, and 1.2 g/L). Imaging size: (A, B) 7 μm, (C, D) 10 μm, (E, F) 9.4 μm, (G, H) 12 μm, (a, b, c ,d, e, f, g, h) 1.8 μm.
When adding furfural into the medium system, the morphology property and size of the yeast cell were changed dependent on the furfural concentration. For example, the length of yeast cell at the beginning of stationary phase was about 6.84 ± 0.65 µm, while after the addition of 0.4, 0.8 and 1.2 g/L furfural for 48 h cultivation, the cell average length increased to 10.59 ± 0.10 μm, 8.98 ± 0.08 μm and 11.56 ± 1.67 μm, respectively. Moreover, the whole cell shape was also changed from oval shape to near rod shape.
Correspondingly, in the case of 0.4 g/L furfural situation, AFM height and amplitude images revealed that the yeast presented series surface morphology variance with size and shape changes. As shown in (Figure 5C,5D) , the yeast surface was still smooth, but the cell length increased from 6.84 ± 0.65 μm of origin to 10.59 ± 0.10 μm, the characteristics in amplitude images with limited heterogeneity was observed in (Figures 5c and 5d). It indicated that T. cutaneum showed the tolerance capacity of 0.4 g/L furfural concentration. The phenomenon has been intensively confirmed in the literature [5-7].
When furfural concentration in the medium system increased to 0.8 even to 1.2 mg/L, as shown in (Figures 5e-5h), there were some patches appearing on the yeast surfaces. These nano-patches were condensed from the amplitude images in (Figures 5e-5h), revealing the increase of hardness of some surface components. The heterogeneity characteristics in the yeast cell surface suggested that the yeast was dead. In other words, the yeast T. cutaneum cannot survive in the high concentration of furfural (≥ 0.8 g/L) in the cultivation medium.
In addition, as observed in (Figure 6), with the increasing concentrations of furfural in the medium system, there was an apparent increase in yeast surface roughness. The characteristics of the surface crust structures of a single T. cutaneum yeast after 48 h cultivation was also investigated in this work. (Figures 7a1-7a4) are the height and amplitude images; (Figures 7b1-7b4) stand for 3D images of the yeast; and (Figures 7c1-7c4) represent the sectional analysis of the yeast height and amplitude images. These fine structure variances revealed that high concentrations of furfural would damage the yeast T. cutaneum surface structure resulting in cell death, thus lipid accumulation was ceased in these situations. This presumable conclusion was confirmed with the Nile Red staining per cell via fluorescence microscopy of T. cutaneum cells in (Figure 3).

Figure 6: Average roughness of yeast growth on corncob hydrolysate with different furfural concentrations (0, 0.4, 0.8, and 1.2 g/L).

Figure 7: The characteristics of the surface crust structures of a single T. cutaneum yeast by AFM analysis after 48 h cultivation in corncob hydrolysate with different furfural concentrations (0, 0.4, 0.8 and 1.2 g/L). a1-a4 are the height and amplitude images; b1-b4 stand for 3D images of the yeast; c1-c4 represent the sectional analysis of the yeast height and amplitude images.
In this study, the furfural-detrimental mechanism on lipid accumulation of T. cutaneum was visually investigated in corncob hydrolysate with different furfural concentrations. T. cutaneum showed the bio-metabolism capacity of furfural in its low level through three steps and 2-furoic acid might be the final metabolism product. The furfural detriment mechanism with no lipids accumulation of T. cutaneum was attributed to the damage of cytomembrane for preventing the yeast cell growth in lignocellulosic hydrolysate with high levels of furfural. Further researches into other inhibitors and their co-effects on lipid accumulation of T. cutaneum for biomass-into-microbial oil bioprocess are ongoing in our lab.
The authors declare that they have no competing interests.
HY wrote the manuscript; LG conducted most of the whole experiment; LW conducted the AFM experiment and draw AFM figures; YC conducted the FS images experiment; WS revised the manuscript; YL supervised the project, conceived the experiment and revised the manuscript. All authors read and approved the manuscript submission.
The authors acknowledge the financial funds from the National Natural Science Foundation of China (NSFC, 31270858; 21476016).