ISSN ONLINE(2319-8753)PRINT(2347-6710)
ISSN ONLINE(2319-8753)PRINT(2347-6710)
| Dr. Pooja Talreja Assistant Professor, Acropolis Institute of Technology & Research, Mangalia Square, Indore, India |
| Related article at Pubmed, Scholar Google |
Visit for more related articles at International Journal of Innovative Research in Science, Engineering and Technology
The Indian capital Market has witnessed a tremendous growth. An important recent development has been the Entry of Foreign Institutional investors are participants to the primary and secondary markets for the securities. In the past several years, investments in developing countries have increased remarkably. Among the developing countries India has received considerable capital inflows in recent years. The liberalization policy of the government of India has now started fielding results and the country is poised for a big leap in the industrial and economic growth. The Economy of the country is mainly based on the development of the corporate sectors. A better understanding of the stock market trend will facilitate allocation of financial sources to the most profitable investment opportunity. The behavior of stock returns will enable the investors to make appropriate investment decisions. The fluctuations of stock returns are due to several economic and non-economic factors. The study is aimed at ascertaining the behaviour of share returns. This paper analyses the equity share fluctuations in India. It also measures the strength of the trend and the money involved in investing in the stocks. Elliott Wave Principle along with Fibonacci sequence is applied for selected companies which would give the investor a sell signal or buy signal. In India most of the industries require huge amount of investments. Funds are raised mostly through the issue of share. An investor is satisfied from the reasonable return from investment in shares. Speculation involves higher risks to get return on the other hand investment involves no such risks and returns will be fair. An investor can succeed in his investment only when he is able to select the right shares. The investors should keenly watch the situations like market price, economy, company progress, returns, and the risk involved in a share before taking decision on a particular share. This study made will help the investors know the behaviour of share prices and thus can succeed.
Keywords |
| Market Behavioural Analysis, Equity Market, Elliot Wave Principle, Fibonacci sequence |
INTRODUCTION |
| Market Behavioral Analysis by definition is the psychology of actual market participants and how their present moods control market price movement, One tenet of B.A. is that "at a certain point in the future—hours, days, week, months, or even years from today—traders’ attitudes will shift from optimistic to pessimistic (or vice-a-versa) regardless of their current bias, bullish or bearish, and with that shift will come a price reversal in the market." |
| According to the BA model, price action follows predetermined patterns based exclusively on human emotion. |
| Future market psychology is ultimately driven by two simple human emotions: |
| • Greed (bullish) |
| • Fear (bearish) |
| The purpose of the present paper is to identify the trend & behaviour of Indian Equity Markets using tool like Elliott Wave Principle AND Fibonacci sequence |
| The wave principle gives idea about direction of trend and reversal with target prices if combined with Fibonacci. The magical wave principle is capable of identifying and understanding the market psychology and represents the future market direction. |
CONCEPTUAL FRAMEWORK |
Elliott Wave Principle For Market Psychology Trends |
| The Elliott Wave Principle states that markets move in natural patterns according to changing investor psychology and price momentum. Specifically, crowd psychology will move from optimism to pessimism, and back up again, making it possible to forecast the progression of certain market trends. |
| "The Wave Principle" is Ralph Nelson Elliott's discovery that social, or crowd, behaviour trends and reverses in recognizable patterns. The Wave Principle is not primarily a forecasting tool; it is a detailed description of how markets behave. Many areas of mass human activity follow the Wave Principle, but the stock market is where it is most popularly applied. Indeed, the stock market considered alone is far more important than it seems to casual observers. |
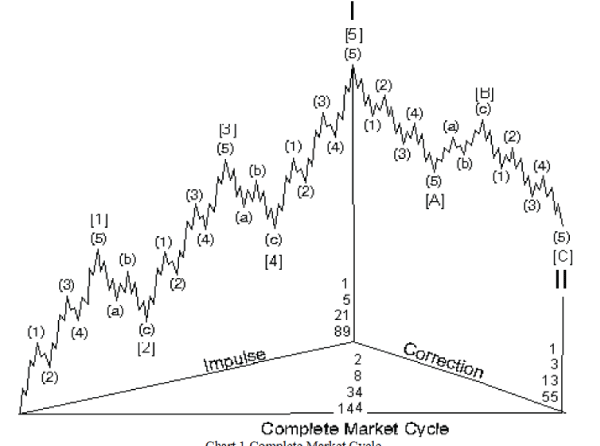
| According to the Elliott Wave theory, market move in the five distinct waves existing on the upside and the three distinct waves existing on the downside. The upwards waves that lie in the bull move are termed as Impulse waves and the other three waves that are against the trend direction are termed as Corrective waves. In the Financial market, major trend is determined by the major waves and the minor trend is determined by the minor waves. Example of Ideal Impulse & corrective wave is given below. |
| Every wave serves one of two functions: action or reaction. Specifically, a wave may either advance the cause of the wave of one larger degree or interrupt it. The function of a wave is determined by its relative direction. An actionary or trend wave is any wave that trends in the same direction as the wave of one larger degree of which it is a part. A reactionary or countertrend wave is any wave that trends in the direction opposite to that of the wave of one larger degree of which it is part. Actionary waves are labeled with odd numbers and letters. Reactionary waves are labeled with even numbers and letters |
 |
| All reactionary waves develop in corrective mode. If all actionary waves developed in motive mode, then there would be no need for different terms. Indeed, most actionary waves do subdivide into five waves. However, as the following sections reveal, a few actionary waves develop in corrective mode, i.e., they subdivide into three waves or a variation thereof. |
Rules followed by the Impulse waves |
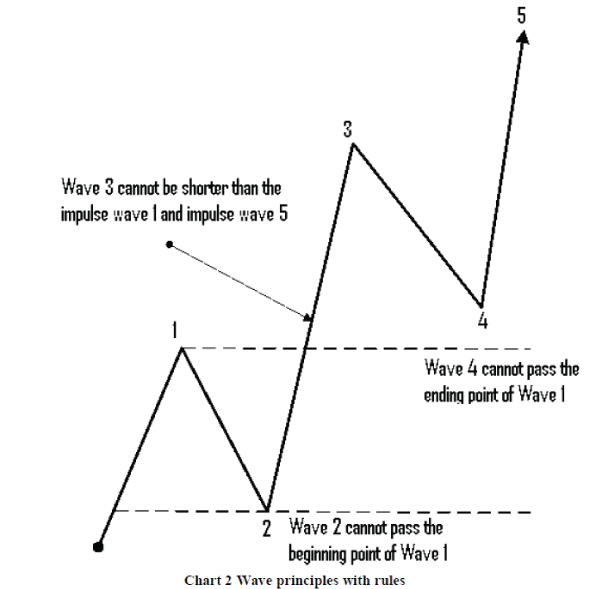
| Traders must analyze carefully that the impulse waves they observed are valid or not and this analysis must be done before predicting and acting on the predictions. There are certain rules that the impulse waves follow and these rules are listed below. |
| Wave 2 cannot pass the beginning point of Wave 1. |
| Wave 4 cannot pass the ending point of Wave 1. |
| Wave 3 cannot be shorter than the impulse wave 1 and impulse wave 5. |
 |
Rules followed by the Corrective waves |
| There are certain rules that the corrective waves follow and these rules are listed below. |
| The first wave cannot be retraced more than 100% by the first wave. |
| The second wave can be the short but cannot be the shortest in any impulse sequence. Mostly the third wave is the longest of all the waves. |
| The fourth wave never goes in the first wave’s price range The idea of wave personality is a substantial expansion of the Wave Principle. It has the advantages of bringing human behavior more personally into the equation and even more important, of enhancing the utility of standard technical analysis. |
| Wave Tendencies & Fibonacci |
| Fibonacci is a mathematical sequence of numbers in which every number has relation with the previous two numbers of the series. An example of Fibonacci series is (1, 1, 2, 3, 5, 8, 13, and 21). As you can see in this series that the sixth number is 8 and its previous numbers are 5 and 3 so according to the theory there must be some relationship between 8 and (5, 3). So what is the relation between these numbers? If you will check these numbers then you will find that 8 is the sum of 5 and 3 and this is the Fibonacci Relationship. According to the Fibonacci relationship in a sequence of Fibonacci numbers, every number is the sum of the previous two numbers. Leonardo de Pisa, a mathematician of the 12th century has given this beautiful and useful concept of numbers to the world. He told that every number of a Fibonacci sequence is approx 1.618 times greater than the preceding number and 0.618 times than its previous number. |
Use of the Fibonacci sequence |
| This concept in financial markets is used to find out the movement of the Trend lines and find out the minimum and maximum price points. A Fibonacci sequence is made up of Extension and Retracement. |
| The Golden Ratio |
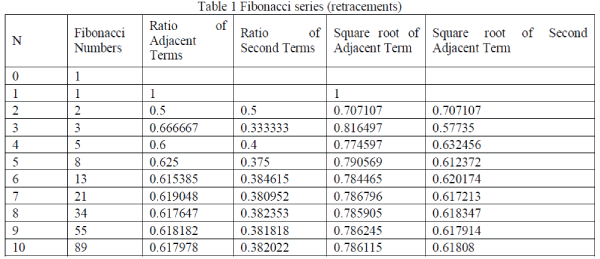
| After the first several numbers in the sequence, the ratio of any number to the next higher is approximately .618 to 1 and to the next lower number approximately 1.618 to 1. The further along the sequence, the closer the ratio approaches phi (denoted f) which is an irrational number, .618034.... Between alternate numbers in the sequence, the ratio is approximately .382, whose inverse is 2.618. |
| Some statements of the interrelated properties of these four main ratios can be listed as follows: |
| 1) 1.618 - .618 = 1, |
| 2) 1.618 x .618 = 1, |
| 3) 1 - .618 = .382, |
| 4) .618 x .618 = .382, |
| 5) 2.618 - 1.618 = 1, |
| 6) 2.618 x .382 = 1, |
| 7) 2.618 x .618 = 1.618, |
| 8) 1.618 x 1.618 = 2.618. |
| Besides 1 and 2, any Fibonacci number multiplied by four, when added to a selected Fibonacci number, gives another Fibonacci number, so that: |
| 3 x 4 = 12; + 1 = 13, |
| 5 x 4 = 20; + 1 = 21, |
| 8 x 4 = 32; + 2 = 34, |
| 13 x 4 = 52; + 3 = 55, |
| 21 x 4 = 84; + 5 = 89, and so on. |
| 1.618 (or .618) is known as the Golden Ratio or Golden Mean. Its proportions are pleasing to the eye and an important phenomenon in music, art, architecture and biology. William Hoffer, writing for the December 1975 Smithsonian Magazine, said: |
| ...the proportion of .618034 to 1 is the mathematical basis for the shape of playing cards and the Parthenon, sunflowers and snail shells, Greek vases and the spiral galaxies of outer space. The Greeks based much of their art and architecture upon this proportion. They called it "the golden mean." |
| Nature uses the Golden Ratio in its most intimate building blocks and in its most advanced patterns, in forms as minuscule as atomic structure, microtubules in the brain and DNA molecules to those as large as planetary orbits and galaxies. It is involved in such diverse phenomena as quasi crystal arrangements, planetary distances and periods, reflections of light beams on glass, the brain and nervous system, musical arrangement, and the structures of plants and animals. Science is rapidly demonstrating that there is indeed a basic proportional principle of nature. |
Fibonacci Retracement |
| Movement of price to some point on the trading chart and then retracing back is known as Fibonacci Retracement. 0% is the lowest level in a Fibonacci sequence and 100% is the highest. The other most important Fibonacci Retracement levels are 38.2%, 50% and 61.8%. Support or Resistance levels for any currency exist at the points obtained by dividing the length of swing by ratios of figures such as .382, .50 and .618. |
Fibonacci Extension |
| Fibonacci Extension is used to predict the behavior of a stock after swing high or swing low is crossed. Ratios such as 161.8%, 261.8% and 423.6% that extend beyond 100% are included in the Fibonacci Extension. These levels are used by the traders and investors for calculating the entry and exit points. In an uptrend, the traders and investors should attempt to earn profit on a long trade at these extension levels where as in a downtrend the traders and investors should attempt to earn profit on the short trade. |
Relationship Of Fibonacci Sequence With The Elliott Wave Principle |
| At any moment, financial market can be either bull or bear because bull or bear are the two sides of the market. Financial market if going bull, divides itself into five waves and when the market is going bear, divides itself into three waves. This way we can derive the 5-3 relationship and this is the principle of the concept of Elliott Wave. This concept shows the progress of market. A complete Fibonacci sequence can be generated using the concept of Elliott Wave Principle. A straight line decline can be drawn using the bear swing concept and a straight line advance can be drawn using the bull swing concept. Examples of bear, bull and both using the combination of the waves (1, 1, 2), (3, 5, 8) and (12, 21, 34) are shown in the figure below. |
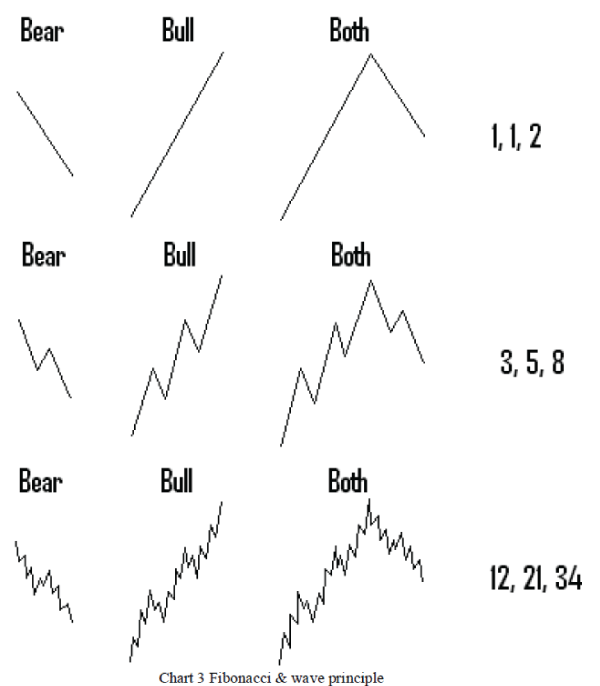 |
| The concept of the waves in bear and bull market according to an Elliott Wave Principle forms the Fibonacci sequence and this is the relationship between the Fibonacci sequence and the Elliott Wave Principle. Summarizing the relationship between Fibonacci and Elliot wave with illustrations |
 |
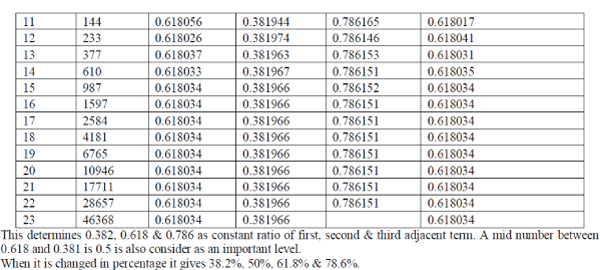 |
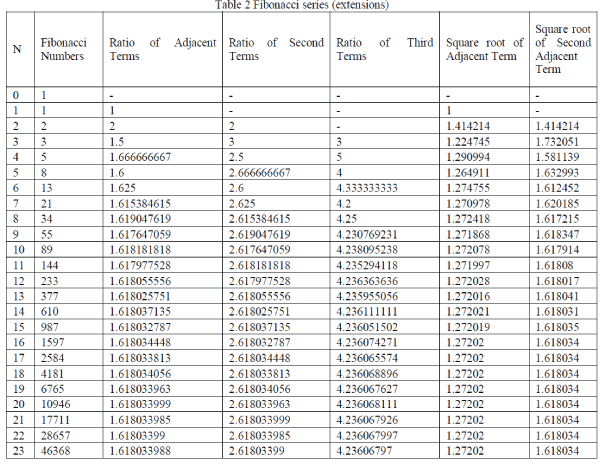 |
| This determines 1.272, 1.618, 2.618 & 4.23 as constant ratio of first, second & third adjacent term. When it is changed in percentage 127.2%, 161.8%, 261.8% & 423.6% are the percentages for extensions |
| Waves and Fibonacci: |
| Waves 1: Begins after completion of a market cycle really difficult to determine |
| Wave 2: Retracement of wave 1 up to 38.2%, 50%, 61.8% or 78.6% |
| Wave 3: Extension in the direction of main trend probably 100%, 127.2%, 161.8%, 261.8% or 423.6%, this wave can’t be the shortest wave |
| Wave 4: Retracement of wave 3 up to 38.2%, 50%, 61.8% or 78.6% If the wave 2 is 38.2% then wave 4 would be 61.8% or vice versa. As per basis guidelines this wave never entrance in the territory of wave 1 |
| Wave 5: Usually the price distance travelled in wave 5 is equals to wave 1. But sometimes 61.8%, 127.2%, 161.8%, 261.8% or 423.6% |
| Wave A: retracement of wave 5 up to 50%, 61.8% or 78.6% |
| Wave B: retracement of wave A up to 38.2%, 50%, 61.8% or 78.6% |
| Wave C: extension in the direction of correction. As per rule wave C is equal to wave A, sometimes 161.8% of wave A |
REVIEW OF LITERATURE |
| Daigler Robert T.et.Al., (1981)2 have conducted a study on the development and testing of trading rules on the New York stock Exchange which are based on the discriminant Function. The study analysis the ability of daily technical indicators to predict future changes in the "standard and poor's 500 index". The study also signifies that the Technical indicators possess predictive ability to the extent that investor's possess predictive ability to the extent that investors believe they contain information on Future Market developments, and/or to the extent that the indicators reflect changing expectations among market participants. The study summarizes that the initial analysis of the relationship between daily technical data and future market movements is accomplished by examining the statistical difference between the group means (computed via the usual F test applied to the group means estimated from the discriminant function) of predicted "up days" versus predicted "down days" ("Up" and "down" days are define shortly). The statistical analysis is extended by classifying the observations into groups. |
| Micko Tanaka Yamawaki et. Al., (2007) 7 have conducted a study on the Adaptive use of Technical Indicators for predicting the Intra-Day price movements. The researcher has proposed a system to select the best combination of technical indicators and their parameter values adaptively by learning the patterns from the tick-wise financial data. In this paper, the researcher has shown that this system gives good predictions on the directors of motion with the hitting rate at 10 ticks ahead of the decision point as high as 70% for foreign exchange rates (FX) in five years from kl1996 to 2000 and 8 different stock prices in NYSE market in 1993 The study concludes that the tick-wise price time series carry a long memory of the order of at least a few minutes, which is equivalent to 10 ticks. |
| Bennet, James A.et.al (2001) have conducted a study on "can money flow predict is defined as the difference between up stick and down stick dollar trading volume. The study says that despite little published research regarding its usefulness, the measure has become an increasingly popular technical indicator because of its own means. The study summarizes its most important finding that money flow appears to predict across- sectional variation in future returns. Their predictive ability is sensitive, however, to the method of money flow measurement (eg. The exclusion or inclusion of block trades) and the Forecast horizon. |
RESEARCH METHODOLOGY |
| Research methodology deals with a systematic and scientific methods that can be adopted to solve research problems. Methodology is a crucial step in any research because it directly influences the whole research and its findings. The data collected for the study is secondary in nature. The objective of the study is to study the trend and behavior analysis of Indian equity markets using tool of technical analysis like Elliott wave principle and Fibonacci sequence The study is carried out during the period April 2006 to march 2011. |
V.DATA ANALYSIS & INTERPRETATION USING FIBONACCI & ELLIOTT WAVE WITH MARKET BEHAVIORAL ANALYSIS IN INDIAN STOCK MARKETS WITH EXAMPLES |
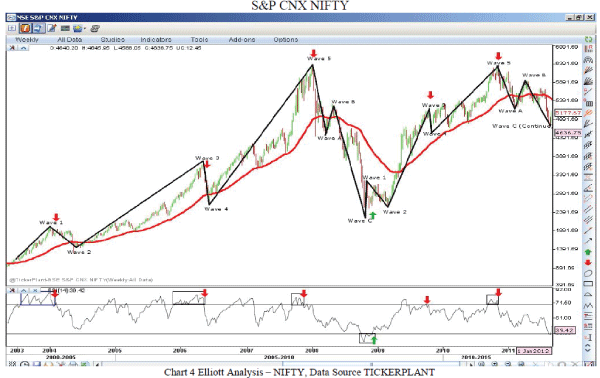 |
| First wave cycle with Fibonacci for NIFTY |
| • Wave1: 1125.50 to 2014.65 |
| • Wave 2: 2014.65 to 1456.20, 61.8% retracement of wave 1 |
| • Wave 3: 1456.20 to 3774.15, 261.8% extension of wave 1 |
| • Wave 4: 3774.15 to 2595.65, 50% retracement of wave 3 |
| • Wave 5: 2595.65 to 6357.10, 161.8% of wave 3 |
| • Wave A: 6357.10 to 4468.55, 50% retracement of wave 5 |
| • Wave B: 4468.55 to 5254.50, 50% retracement of wave A |
| • Wave C: 5254.50 to 2252.75, 161.8% of wave A |
| After completion of first wave cycle the second wave |
| • Wave1: 2252.75 to 3240.55 |
| • Wave 2: 3240.55 to 2539.45, 78.6% retracement of wave 1 |
| • Wave 3: 2539.45 to 5176, 261.8% extension of wave 1 |
| • Wave 4:5176 to 4538.50, 23.6% retracement of wave 3 |
| • Wave 5: 4538.50 to 6338.50, 61.8% of distance from wave 1 to 3 |
| • Wave A: 6338.50 to 5177.70, 61.8% retracement of wave 5 |
| • Wave B: 5177.70 to 5944.45, 61.8% retracement of wave A |
| • Wave C: 5944.45 to 4713.80, 100% of wave A (still continue in extensions to 161.8%) |
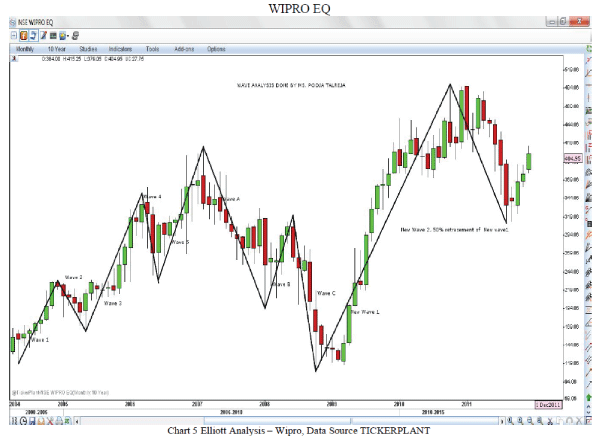 |
| • Wave 1: 119 to 232 |
| • Wave 2: 232 to 163, 61.8% retracement of wave 1 |
| • Wave 3: 163 to 351, 161.8% of wave 1 |
| • Wave 4: 351 to 228, 61.8% retracement of wave 3 |
| • Wave 5: 228 to 414, 161.8% of wave 1 |
| • Wave A: 414 to 194 |
| • Wave B: 194 to 321, 61.8% of wave A |
| • Wave C: 321 to 108, 100% of wave A |
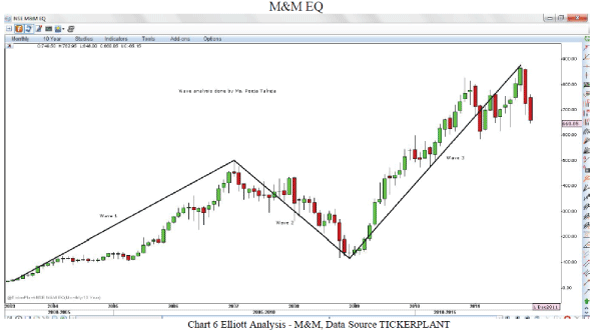 |
| • Wave 1: 27.83 to 500.40 |
| • Wave 2: 500.40 to 117.50,78.6% retracement of wave 1 |
| • Wave 3: 117.50 to 877.30, 161.8% of wave 1 |
| • Wave 4 in progress |
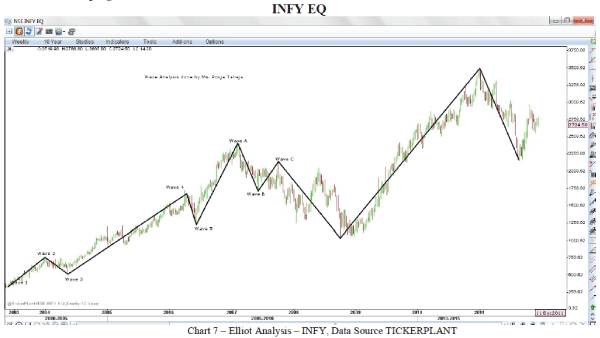 |
| • Wave 1: 337.50 to 762.50 |
| • Wave 2: 762.50 to 515.60, 61.8% retracement of wave 1 |
| • Wave 3: 515.60 to 1678.50, 261.8% of wave 1 |
| • Wave 4: 1678.50 to 1225,38.2% retracement of wave 3 |
| • Wave 5: 1225 to 2415, 100% of wave 3 |
| • Wave A: 2415 to 1715, 61.8% retracement of wave 5 |
| • Wave B: 1715 to 2141, 61.8% of retracement of wave A |
| • Wave C:2141 to 1040, 161.8% of wave A |
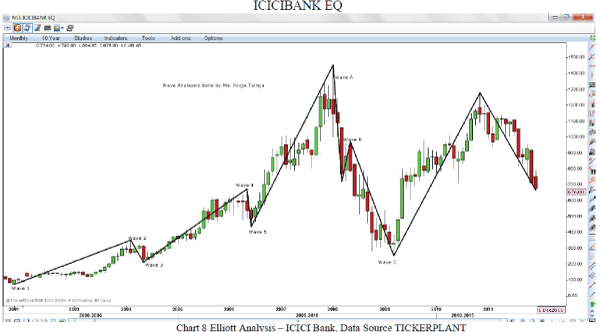 |
| • Wave 1: 72 to 352.30 |
| • Wave 2: 352.30 to 211.55, 50% retracement of wave 1 |
| • Wave 3: 211.55 to 675, 161.8% of wave 1 |
| • Wave 4: 675 to 435 , 50% retracement of wave 3 |
| • Wave 5: 435 to 1455.50, 423.6% of wave 1 |
| • Wave A: 1455.50 to 720.05, 61.8% retracement of wave 5 |
| • Wave B: 720.05 to 971, 38.2% retracement of wave A |
| • Wave C: 971 to 252.30, 100% of wave A |
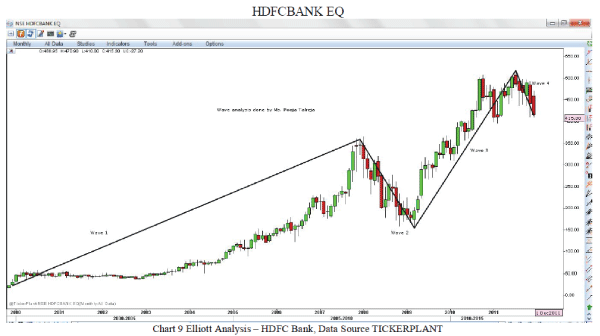 |
| • Wave 1: 22.59 to 359.56 |
| • Wave 2: 359.56 to 154.80 |
| • Wave 3: 154.80 to 519 |
| • Wave 4: In progress |
CONCLUSION |
| The wave principle discussed along with examples gives a fair idea about direction of trend reversal with target prices if combined with Fibonacci. The accuracy of and the applicability has proved that the magical wave principle is capable of identifying and understanding the market psychology and represents the future market direction. |
References |
|