International Journal of Innovative Research in Science, Engineering and Technology
ISSN ONLINE(2319-8753)PRINT(2347-6710)
ISSN ONLINE(2319-8753)PRINT(2347-6710)
| R. Rajamanikam 1, G. Poyyamoli 2 |
| Related article at Pubmed, Scholar Google |
Visit for more related articles at International Journal of Innovative Research in Science, Engineering and Technology
Handling, disposal and impacts of existing Solid Waste Management (SWM) system in Higher Education Institutions (HEIs) of Puducherry Region have not been well documented. The current article discusses the importance of waste stream analysis with special reference to the residential waste to design and develop sustainable solid waste management system in HEIs through a study conducted at Staff Quarters of Pondicherry Engineering College (PEC), an undergraduate institution of Puducherry. The Solid Waste (SW) was segregated into compostable (organic), dry and special wastes. Dry and special wastes were classified into 7 primary categories, which were further classified into a total of 30 recyclable sub-categories. Source-specific waste stream analysis was carried out among different incomeclasses and the quantity and type of each major category of waste was determined. The results show that the average household SW generation rate is 1.760 ± 0.712 kg/day. The high amount of waste generation rate was found in middle income group 1.982 ± 0.837 kg/household/day, compared to low and high income groups that represented 1.685 ± 0.713 kg/household/day and 1.612 ± 0.585 kg/household/day, respectively. The composition study found that kitchen waste constitute the major fraction with 53 % of overall solid waste stream followed by yard waste (12%), plastics (10%), paper (8%), miscellaneous (4%), silt, soil &mud (3%), glasses (2%), textile/leather (2%), metals (2%), wood (1%), household hazardous products (1%), e-wastes (1%) and sanitary waste (below 1%). Kitchen and yard wastes together accounted for 65% of total SW with C/N ratio of 29:1 and calorific value of 1342kcal/kg at 62% of moisture level, indicating that the fraction can be recovered as good quality compost. Further breakdown of the recyclable components shows that metal and glass wastes are 100% recyclable while paper and plastic have the recovery potential of 98% and 94% respectively. The study has shown that 95% of staff quarter SW could be recovered through source segregation, segregated collection, composting and recycling practices. Based on the findings the authors have suggested programs and policies for improving source segregation, storage of recyclables, collection, transportation and safe disposal methods to facilitate increased recovery rate towards framing an inclusive sustainable waste management system.
Keywords |
| Solid waste, Composition analysis, Resource recovery, Sustainable management, Educational institution. |
INTRODUCTION |
| Puducherry, formerly known as Pondicherry, is a Union Territory (UT) of India situated on the Coromandel Coast with a total land area of 492 km2[1]. It has a population of 1,244,464 persons according to 2011 census [2]. Being the second most densely populated place in India (2,593 persons per km2) with a decadal growth rate of 27.72 has prompted the city administrators to focus more on maintaining the quality of living conditions and improving sanitation. Even though fishery, agriculture and allied sectors play a major role in its economy, Puducherry economy is primarily tourism driven with 9, 05, 231 annual tourist arrivals due to its history, heritage and scenic beauty, and is one of the important tourist destinations in India [3]. Also, seven well established industrial estates, more health care facilities, automobile industries etc. attract neighbouring communities exerting further pressure on city infrastructure [4]. Apart from these sectors, UT is fast getting transformed to a Regional Higher Education Hub due to diversified educational opportunities, promotion of private participations and international collaborations in educational sector. The density of colleges per lakh population (population in the age group 18âÃâ¬ÃÂ23 years) is 64, which is much above the national average of 25 [5].Of the 141 higher education institutions present in Puducherry, 108(77%) are under private and 33(23%) are under Government ownership. Puducherry offers a wide range of courses and educational options. It has 18 arts, science and commerce colleges, 24 medical institutions, one veterinary college, one agricultural college, 2 law institutions, 16 engineering& technology institutions, 66 education colleges, 8 polytechnic institutions, 2 catering colleges and one Central University. The total number of students enrolled in the higher education institutions in the Puducherry region in the academic year of 2011-2012 was 41,386 which is about 3.3 percentage of total population [6]. |
| Higher education institutions (HEIs) can be considered as small cities since they replicate city characteristics, whose activities can produce similar environmental impacts [7]. HEIs are thus in an ideal position to showcase and inspire the local neighbourhood for adopting the sustainable practices successfully implemented by them [8]. Growing concern about environmental sustainability in HEIs has accelerated the concept of “sustainable campus” which integrates environmental sustainability in research, teaching and on-campus activities [9], [10]. The advantages of sustainable campus are many, it sensitizes and helps to built the consciousness of campus community; improves student performance by providing clean environment; increase job satisfaction and performance of staff by providing healthy work place; impress the local community by the difference in degree of cleanliness between sustainable campus and the environment which they are living in. The students, staff and neighbourhood communities thus become the direct beneficiaries of the concept. |
| HEIs in Puducherry are becoming increasingly committed to building environmentally responsible campuses by implementing effective environmental policy, plans and programs. These programs are aimed at conserving natural resources through adopting sustainable consumption and management practices for air, water, land and energy resources. Solid waste management (SWM) is an unavoidable area which ultimately has control over the healthy, safety and sustainable campus [11], [12]. Presently, HEIs are becoming increasingly environment conscious and are interested to develop their own waste management policies and programs. Often, they lack reliable information and expertise to initiate and implement an environmentally sound waste management system which is sustainable. The current study in Pondicherry Engineering College (PEC) was undertaken in such a scenario as part of “Campus Waste Stream Analysis” designed as the initial phase to develop a proper management plan for achieving the goal of “Zero Waste Campus”. The present article focuses on Staff quarter (residential units) which is a hidden or underestimated sector where appropriate services facilities need to be expanded. It is been well documented that the quantification and composition analysis of solid waste are the initial steps in sustainable waste management system [13]. The main aim of this study was to examine how far solid waste generation and compositional analysis in residential sector support the design of policies on waste reduction practices and implement sustainable waste management system in HEI campuses. |
II. STUDY AREA DESCRIPTION AND PROFILE OF PEC |
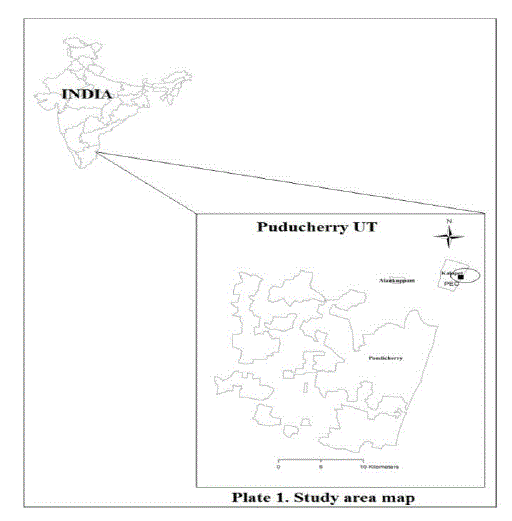
| Pondicherry Engineering College (PEC) is a Government-owned residential HEI established in 1984 as the first engineering institute in the region and is affiliated to Pondicherry University. It is located 14 km north to Puducherry town between 12.0133° N and 79.8538° E, at Pillaichavady. The campus spread across an area of 210 hectare and includes 37 Departments, 17 research units, and 4 laboratories, an administration block, 5 sports grounds, 3 student hostels , 3 staff quarter units, 12 commercial buildings, 1 children park and 1 temple. The institute offers applied and technical education in emerging engineering fields, such as 4-year Bachelor of Engineering (B.E.), 2-years Master of Engineering (M.E.) and 5-years of Doctoral Degree programs in 12 comprehensive disciplines. A total of 2, 300 students enrolled at PEC in the fall semester 2011-12. Out of 464 staff in the campus 67 staffs were residing at campus. The mean family size is about 5.43 persons and the total residential population is about 364. |
 |
| Based on profession, the staff quarters are distributed in 3 separate blocks. Block-1 quarter is allowed for Professors, assistant professors and core administrative staffs (Principal, registrar, finance officer, librarian, medical officer, and executive engineer) those who get salary of `60000 – 120000 per month. Block -2 quarter is allotted for lecturers and nonteaching staffs (Horticultural officer, personal secretary, section officer, senior research assistants) those pay scales vary between ` 30000- 60000 per month. Block -3 quarters are allotted for other non-teaching staff (technical assistant, electrician, driver, security inspector, sweeper etc.) whose pay is `12000 – 20000 per month. |
IV. METHODOLOGY |
| The study was carried out in two phases. The first phase focused on exploring and documenting the existing solid waste management (SWM) system/practices at PEC and Puducherry region in general. During the second phase, SW generation and composition analyses were conducted at selected residential units in staff quarters to assess the resource recovery potential and to propose sustainable SWM plan for the campus. |
| A. DOCUMENTING EXISTING SWM PRACTICES: Information on SW handling system (institutional arrangements, waste collection, transportation, resource recovery, treatment and final disposal services) and operational costs were obtained through informal interview among stakeholders and direct field observations in order to study the defects and performance of the existing system. Additionally, informal interviews with local scrap dealers and at recycling units were conducted to gather information on recycling opportunities and revenue generated through recycling. |
| B. SOURCE-SPECIFIC WASTE STREAM ANALYSIS: Waste stream analysis was carried out at PEC staff quarters through convenience sampling. Characterization and generation rate of SW during 7 consecutive days from November 05 to November 11, 2012 were done through collection, analysis and weighing the residential waste stream. To get a representative result, we followed a 45% sampling regime (since population size was smaller). The households were stratified into low (`12000 – 20000 per month), middle (` 30000- 60000 per month) and high income (`60000 – 120000 per month) groups and 10 units were chosen from each strata (30 households in total). Households participated in these studies were identified using non-random sampling technique, by their willingness or voluntary interest and accessibility; and total of 210 waste samples were collected. During the survey, each household was provided with five polythene bags of 4 kg capacity for the daily collection of 5 different categories of SW separately. At household level, waste components were segregated into five broad categories such as 1) compostable, 2) recyclables 3) sanitary waste 4) household hazardous products 5) E- waste. Afterwards, in order to assess the individual components and resource recovery potential of recyclables, wastes were resorted manually into 30 recoverable subcategories as listed in Table 2, which could be composted/ recycled in onsite or nearby industries. The garbage generated at each household was collected on a daily basis, food and yard wastes were weighted immediately at the source in houses. Recyclables and special waste were taken to sorting shed for secondary manual sorting. After sorting, the wet weight of each subcategory was measured separately using a manual weighing balance of 100kg capacity and 0.1kg accuracy and findings were recorded in the data sheet. The primary data was analysed using the MS excel software to determine the mean variation of waste generation among the different income groups. The per capita waste generation in staff quarters was determined by dividing the quantity (weight) of waste generated with the total number of individuals in the population studied. The characterization of organic waste, i.e., moisture content, C/N ratio and calorific values were calculated at laboratory. |
V. RESULTS |
| A. EXISTING WASTE MANAGEMENT PRACTICES: The current practice followed in Puducherry for SWM is by public-private collaboration. The municipalities are responsible for waste management; but due to lack of adequate facilities, they outsource the task to private parties under contract. Each of the 2 municipalities, 5 commune panchayaths have private waste managers operating on annual government contracts for collection from public bins, transportation and disposal. The facility is constrained by the fund allotted to the contractor (since the contract is auctioned to the lowest bidder) which affects the frequency of collection and number of sanitary labourers employed. From our survey it was found that most of the public bins in use were very old and in poor condition despite the growing number of shops, institutions and population; the same bins were used to receive all categories of waste(mixed waste); bins were unsightly and odourous and spilled around due to infrequent collection attracting cattle, dogs, vermin and flies; inadequate number of bins and distance from the bins has forced people to litter and burn the unsorted waste along the street; workers handle waste with bare hands and disposal method is open dumping or burning. There is no policy followed for waste reduction at source level and scientific methods of SWM (waste stream segregation, composting and biogas extraction of organic wastes, recycling of plastic, paper and metal wastes, incineration of hazardous wastes). However, valuable materials such as metal, cardboard, high density plastics and glasses were purchased by the local scrap dealers and recycled. The bins were not proportionate to the growing population nor designed for reception from diverse sources. The waste is transported to open landfill at Karuvadikuppam and Kurumampet or illegally dumped in outskirts (Puramboku lands), Tengaithittu mangroves and other water bodies polluting the ecosystem. There is no treatment of SW in municipal dump; waste is burned from time to time to make room for additional waste. |
| The lack of infrastructural facilities and limited resources have caused municipalities not to effectively serve the institutions for the treatment and disposal of SW, and most of the colleges lack proper waste disposal system. Pondicherry University is the only institution with collection and transportation facility of its own, but without treatment facility except for incineration of infectious wastes. Even though adequate number of bins was available in the said institution, the means for waste segregation and management of special wastes were lacking. Incineration facility for sanitary napkins is available at many institutional hostels, including that of PEC. The waste in PEC is generally not segregated but the different types of wastes are mixed up and deposited in community bins either left uncollected or burnt. Ineffectiveness in waste collection service has encouraged the residents to burn or discard their waste in open spaces on street, drains and sites near staff quarters. Wastes from community bins are manually transferred to trucks by the team of campus estate authority once in fifteen days; transported to landfill and disposed of in an open dumpsite or burned in the outdoors without taking any precautions. This type of disposal can pose serious threats to environment. There is no system to prevent and control environmental pollution that is greatly threat to human health [14], [15], [16]. |
| B. SOLID WASTE GENERATION AT THE STAFF QUARTERS: The average SW generated from the staff quarters in PEC was estimated to be 118 kg/day, generated from 67 households. The mean household SW generation rate was 1.760 ± 0.712 kg/day for an average of 5.43 residents per household. |
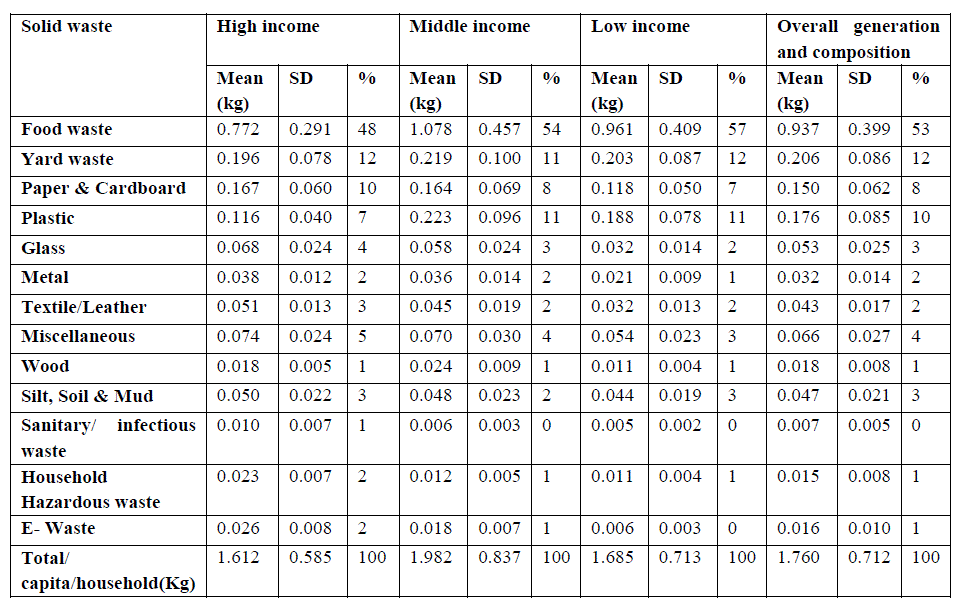 |
| The rate of solid waste generation was highest for the middle income group at 1.982 ± 0.837 kg/household/day, while low and high income groups showed similar generation rate at 1.685 ± 0.713 kg/household/day and 1.612 ± 0.585 kg/day, respectively. The average physical composition of SW generated by different income groups from all samples is given in Table 1. The two SW categories contributing to the greatest proportion of the total solid waste stream as well as at each of three income groups are food waste and yard wastes, contributing to 53% and 12% of total waste stream respectively. Plastic and paper follows the share with 10% and 8%, respectively while miscellaneous category contributed to 4% of the waste stream that included rubber/tubes, textile, footwear, jute bags etc. The minor waste stream components included silt, soil &mud (3%), glasses (2%), textile/leather (2%), metal (2%). Household hazardous waste materials consisting of used oil and paint containers, personal care and home maintained products contributed 1% of the waste stream, similar to E-wastes. Sanitary wastes formed only less than 1% forming the least fraction may be due to hesitation of individuals to divulge information on sanitary waste generation and disposal methods. The generation rate and composition of solid waste among the different generator groups demonstrated an extensive variation by weight and percentage (Table, 1). While the percentage of food waste reduced to 48% in high income group, the percentage for paper (10%), glass (4%), textile/leather (3%), miscellaneous (5%), household hazardous waste (2%), E-waste (2%) and sanitary/ infectious waste (1%) fractions were high when compared with other income groups. However, wood is the only material that is uniformly represented (1%) by weight at each income groups. Increased reliance on packaged food items and frequently “eating out” habits were observed to be the reasons of suppression of food waste fraction in high income group, as revealed in interview with the residents. The high fractions of sanitary/ infectious waste, household hazardous waste and E-wastes in this category are by-products of higher living standards. A significant amount of paper (10%) observed here when compared to low and middle income groups can be a result of extensive usage of newspaper/magazines, alternate use of paper in wrapping/packaging and plastic reduction practices. |
| Of the three income groups, the highest food waste (FW) generation rate was observed in low income group (57%) due to minimal use of processed food items and more self cooking practices, which contributes to more quantity of vegetable trimmings, peelings, bones and other inedible parts during meal preparation.. On the other hand lack of storage facilities, poor cooking practices and lack of awareness and understanding of the environmental implications of FW also get reflected in high amount of food waste generation. Poor storage facilities can in turn increase the frequency of grocery and vegetable purchases in low and middle income groups, which result in high amount of disposable plastic carry bags and plastic wrappings (LDPE) thus increasing their respective fractions in the waste stream by these income-groups(11% in both groups). The lowest generation rate of sanitary/ infectious waste, household hazardous waste and E- wastes in low income group may be due to income constraint on luxury purchases while educational and professional constraints curb electronic goods requirement. It is possible that sanitary waste fraction is under represented due to reservations within these groups to share the waste or habitual practice of alternate hygiene methods like washing, lack of wound dressing, use of washable materials like cloth etc unlike the use of tissue paper, sanitary napkins, band aid etc in high income groups. No variations could be identified between the middle and low income groups regarding the production of plastic (11%), textile/leather (2%), wood (1%), sanitary/ infectious waste (0%), and household hazardous waste (1%). At the same time, significant average different were found in paper (8%), glass (3%), metal (2%), miscellaneous (4%) wastes. A high Standard Deviation (SD) value represented by each category of waste generated among all income groups is a result of daily variation and variation in family size in waste generation. |
| C. DRY-WASTE GENERATION AND REVENUE RECOVERY POTENTIAL: For assessing the resource recovery potential, the author categorized residential dry waste into 7 primary categories and further sub classified each category into a total of 30 recyclable subcategories according to the priority set by local recyclers. The price value per kilogram of each category was arrived at after consulting with 5 local scrap dealers. Table 2 summarizes the individual fractions of recyclables and respective market prices. From weekly analysis, the daily dry-waste generation rate was observed to be 37 kg/day and it was found that 31.3 kg (89%) of waste belonging to 25 categories are potentially recyclable. Of the 7 primary dry waste categories, metal and glass have 100% recycling value due to high demand as secondary raw materials and high availability of recycling facility in and around the study area. This is followed by the categories paper and plastics respectively where 100 percentage recycling potential is not reached due to presence of some nonrecyclable/ partially recyclable subcategories like mixed paper and LDPE plastics. Presence of highly heterogenous and diverse materials in miscellaneous category, reduce resource recovery recovery rate to a low 48%. Due to lack of recycling facility, 33% of E-waste is not recyclable like lighting equipment (CFL, tube light) and batteries. Among all primary waste categories, the least recoverable subcategories belong to Special wastes where household hazardous waste category has 20% recycling potential contributed mainly by perfume cans. The total share of paper materials was dominated by mixed paper (32%), which was made of recyclable fraction consisting of catalogues, brochures, envelops, calendars, greeting cards, receipts, coffee cups and non-recyclable fraction of bakery wrappers, butter paper, wet paper, plastic laminated paper, paper napkins, carbon paper, soiled paper etc. |
| The two major types of plastic waste generated in the staff quarters were Low Density Polyethylene (LDPE) which accounted for 38% and High Density Polyethylene (HDPE) and Polypropylene (PP) which accounted for 21%. LDPE is mostly in the form of disposable carry bags, laminations, roof sheets and films, packaging materials, snack wrappers, fresh juice packets and bubble wrappers. 14 % of LDPE was identified as non-recyclables which include silver coated plastic (snacks packets) and soiled plastics. HDPE and PP are hard plastics used for making moulded products like furniture, buckets, trays, office products, bottle caps, air tight containers, toys, and waste bins. PET plastics accounted for about 13% of the total plastic wastes which consisted of PET bottles used for packing water, flavored soft drinks, oil, medical syrups etc. and moulded containers for bakery, cosmetics and electronics; which are of great demand in recycling industry and are 100 % recoverable. Polystyrene (PS) accounted for 12% which included foam, straws and styrofoam while the category „othersâÃâ¬ÃŸ(hybrid plastics) contributed to 10% of total generated plastic wastes. PVC accounted for lowest share (7%) in plastic waste stream while holding the highest market value (INR 23/ kg) as |
| secondary raw material. In terms of revenue recovery, paper(INR 6/kg) is preferred over plastics (INR 12/kg) at households despite their high value per kilogram, since households generate more LDPE and packaging waste plastics which are having no market with the local scrap dealers. The biased preference of local scrap dealers for high value categories of plastics coupled with lack of information on revenue potential of plastics result in low representation of this fraction in household revenue recovery. |
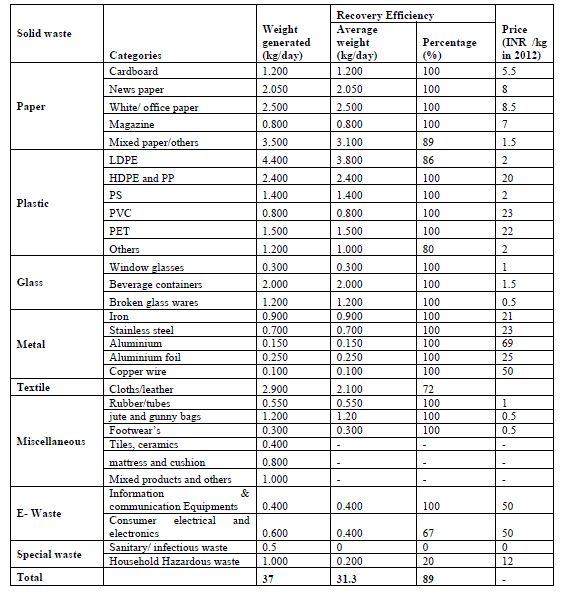 |
| Beverage glass containers represented about 57% of the total glasses generated followed by broken glass wares (34%) and window glasses (9%). The difficulty and effort needed to be invested for collection, identification, sorting into grades, packaging and transportation of broken glasses makes it unappealing to the local scrap dealers and is reflected in the lowest market value (50 paisa /kg) despite the high recovery potential. Unbroken glassware and bottles are taken back by the respective manufacturers for reuse after proper treatment and hence find good market. Analysis of metal waste stream showed predominance of iron materials (43%), mainly iron pots, knives, pan, furniture, automobile parts, plumbing materials, bicycles etc. The second dominant metal is stainless steel (33%) mostly from kitchen utilities and furniture. Aluminium foil makes up 11% which consisted of food, pharmaceutical and chocolate foils, foil containers and foil rolls. Aluminium accounts for only 7% of the metal stream mostly as siding, frames, utensils etc. but has highest market value when compared to other metal items. In miscellaneous category, except certain footwear, rubber, jute and gunny bags, recycling facility is not available and the major non-recyclable fraction goes to landfills. The miscellaneous fraction accounts for 12.5 % of total waste. E-waste forms around 3% of the residential MSW stream, in which information and communication equipments were made up of computer, printer, copying materials and mobile phones etc., share 40 % while consumer electrical and electronics contributes 60% of total E-waste stream that consist of large and small household appliances, lighting equipment etc. Recycling E-waste is on rise in the study area, but 33% of used lighting equipment is not having recycling facilities in Puducherry region. |
| The average solid waste generated from the staff quarters in PEC was 118 kg/day, in which kitchen and yard wastes together accounted for around 75.5 kg (65%) with 58% of moisture level, C/N ratio of 29:1 and the calorific value was around 1342kcal/kg reflects compositing as the ideal option through in which valuable compost can be produced. Of the 37 kg total recyclable 31.3 kg materials could be recycled locally that left 26 % of potential materials to be recycled from the total waste generated. Silt, soil and mud can be reused for road construction which accounted 3.1 kg and 1.2 kg wood can utilized for fuel wood purpose and totally 4 % materials reusable. |
VI. SUSTAINABLE SOLID WASTE MANAGEMENT PLAN FOR HEI’S |
| To achieve the maximum reduction and recycling rate, this study further focused on designing a management plan based on our findings from solid waste composition analysis. The plan has been developed in accordance with the Indian Solid waste Management Handling Rules, 2000. Since in most of the HEIs in India, the SW management systems are not much different from PEC, the following recommendations can be adopted with suitable modifications. |
| A. CONSTITUTION OF SOLID WASTE MANAGEMENT COUNCIL: The solid waste management council should be constituted by with representatives from campus authorities, residential members, students and one professional expert. They should be assigned specific responsibilities of framing appropriate policies, fixing targets, designing solid waste projects, approving annual budgets, allotment of workforce and infrastructure , revenue recovery etc . Such an organized body will help in resolving any issue that may arise while implementation and ongoing program and ensure co-ordination of the tasks. |
| B. WASTE PREVENTION/AVOIDANCE STRATEGIES: Substituting non recyclable and hazardous items with reusable or recyclable products at seller and consumer level could reduce the amount of landfill waste. Introducing better alternative products for non-recyclable categories like silver coated LDPE plastic, thermocol and foam would minimize considerable portion of landfill waste. Reducing the unnecessary plastic packaging and using electronic storage rather than paper storage for documentation will reduce considerable amount of plastics and generation of printed office paper that in turn will reduce pressure on primary raw materials. The study found that many of the discarded items were fine quality materials like cloths, furniture, personal computer and mobile phones that could be donated or gifted to less privileged people. Through a combination of buy-back centre and deposit /refund programs, plastic containers used for soft drink and beverages, refillable glass beverage bottles, metal oil container and aluminium cans could send back to the manufactures. A Repairing unit can be brought out in the campus for the selected materials. Providing services to repair e-waste, automobile parts and furniture can increase the life span of the product and keeping them out of the waste stream. Free store is an excellent option where good quality durable products can be collected and stored by a volunteer group and donated to others which extends the product life. |
| C. RAISING INFORMATION AND AWARENESS LEVELS: Conducting various awareness programs to sensitize and motivate the campus community towards the need for sustainable solid waste management system. As part of awareness program, a website can be created to get active community participation and support through sharing the information and recommendations on households responsibility, source reduction, standard segregation, waste container type, size, color coding and labelling, collection frequency and timing, purchasing waste equipments. Individual can also share their experiences and clear their doubt about specific questions. |
| C. RAISING INFORMATION AND AWARENESS LEVELS: Conducting various awareness programs to sensitize and motivate the campus community towards the need for sustainable solid waste management system. As part of awareness program, a website can be created to get active community participation and support through sharing the information and recommendations on households responsibility, source reduction, standard segregation, waste container type, size, color coding and labelling, collection frequency and timing, purchasing waste equipments. Individual can also share their experiences and clear their doubt about specific questions. |
| E. SEGREGATION AT COLLECTION POINT: The housing units of PEC staff quarters in apartment buildings have an average occupancy rate of 6 to 8 residents. A community on-site storage area is proposed to be common for 4 apartments and to be build at equally accessibledistance. Plastic containers mounted on wheels of 75L storage capacity is proposed for storing kitchen wastes based on the amount of waste to be collected per day. Food waste containers should be leak proof and secured from animal foraging. To separately store the various dry waste materials at each apartment waste containers of 300L capacity to be used for paper, plastic, glass, miscellaneous categories. Household hazardous product and E-waste are suggested tohave 120L bins. For sanitary wastes 60L bin equipped with lidis suggested and storage of these bins should be in a location accessible for the collection vehicles. |
| F. COLLECTIONS AND TRANSPORTATION SERVICES: Wastes stored in the common storage point can be collected by using manually driven small carts (pushcarts or tricycle) with 250kg waste carrying capacity once a week. This tricycle should be designed with special divisions/compartments for collecting the segregated waste without getting mixed up. Desirably 2 labourers have to be employed for the purpose at the scheduled time - morning between 7.30 – 9.30am. Compostable waste should be collected on daily basis and dry wastes along with household hazardous products can be collected once a week. Also drop- off centre could be arranged for voluntary residents through paper, HDPE plastic, unbroken glass and scrap metals can be collected. The transportation of recyclable waste from the primary collection points to secondary sorting sheds can be integrated with total solid waste management collection system arranged for the entire campus. These secondary sorting sheds should be under the supervision of competent personnel. Incineration facility for sanitary wastes should be provided in a location not far from the residential units. Direct dump method can be followed to dispose the mixed and non recyclable waste in the dump yard. |
| G. SAFE DISPOSAL OF SPECIAL WASTES: The Union Territory has a centralized dumping yard operated by the municipal authorities which can accommodate PECâÃâ¬ÃŸs toxic free waste materials that cannot be reused or recycled. Existence of incineration facility for bio-medical at the campus health centre can accommodate the residential unit sanitary items. Those toxic category wastes should be stored in a secure storage facility which can be sold back to the manufacturer when sufficient quantity is reached. |
VII. CONCLUSION |
| Composition analysis demonstrated that the solid waste stream from the staff quarters in PEC was consisted of 65% of compostable, 26% of potentially recyclable materials, 4 % of reusable or divertible products and 5% of waste materials which were not recyclable due to toxicity, composite-nature, contaminations and the absence local recycling industries. The results also indicated that the household solid waste generation and composition varies according to the household income, and highest average daily per capita waste generation rate was by middle income households at 1.982 ± 0.837 kg/household/day while the low income household produced 1.685 ± 0.713 kg/household/day and the high income household produced 1.612 ± 0.585 kg/household/day, which were similar. The findings of this research contribute to frame policies and program for effective waste reduction and recycle initiatives and developed appropriate guideline for waste handling practices such as source segregation, collection and transportation, resource recovery and safety disposal methods so that sustainable solid waste management could be achieved at HEIs. |
ACKNOWLEDGEMENT |
| The authors would like to extend our thanks to the staff quarter residents at PEC who helped us throughout the research. We thank Miss. Lekshmi. R (Research Scholar, Pondicherry University) for her help in the preparation of the MS. We thank Prof. V. Prithiviraj (the then Principal, PEC, Puducherry) for providing permission for the research in PEC. We are also grateful to Pondicherry University for providing research fellowship to one of us (RR) and for the facilities. |
References |
|