Research & Reviews in Pharmacy and Pharmaceutical Sciences
e-ISSN:2320-1215 p-ISSN: 2322-0112
e-ISSN:2320-1215 p-ISSN: 2322-0112
Gunawan Indrayanto*
Plant Biotechnology Research Group Faculty of Pharmacy, Airlangga University, Surabaya 60286, Indonesia
Received date: 04/04/2016 Accepted date: 30/05/2016Published date: 04/06/2016
Visit for more related articles at Research & Reviews in Pharmacy and Pharmaceutical Sciences
Some validation methods that could correlate data of accuracy, precision, pre-determined upper and lower specification range have been described. Application of those methods to validation data has been discussed.
Validation method, Probability approach, Method capability, Tolerance interval, Accuracy profile.
The importance of validation method of analysis for drugs development in the pharmaceutical industries, as well as for its quality control (QC) have been described in detail previously [1]; recently some newest Guidance’s for validation method of analysis have been also published [2-5]. Typical validation parameters described by the Guidance are: specificity, linearity, accuracy, precision (repeatability and intermediate precision), range, detection limit, quantification limit and robustness.
The most important parameter of validation method for analysis of API (active pharmaceutical ingredient) in finished products is accuracy and precision. Generally, the described acceptance criteria for accuracy and precision of the Guidance’s are independent; if the proposed method could fulfilled the requirement of each of those independent acceptance criteria’s, it can be assumed, the propose method is valid. Unfortunately by using these independent criteria, the proposed method could be assumed valid with either high possible bias or high variability [6,7].
Ermer, 15 years ago recommended that SD (standard deviation) of an analytical method should be lower than 1/6 of the acceptance specification range [8]. Feinberg [9] described, that the bias of every measurement of any sample should be inside the pre-determined upper and lower limit of acceptance range. Alasandro et al. [10], Hanna-Brown [6], and Rozet and Huber [7] stated that the values of precision and accuracy should be correlated each other in order to determine whether the results of analysis in the future will fall within the pre-determined acceptable specification range (for example 105-95% of expected value 100%); if the bias is relatively high, the precision will be relatively low or vice versa; combination of accuracy and precision must fall within the space of acceptance criteria of the contour plot of the prediction profiler [10]. Accuracy and precision should be considered together for determining whether (total) error is within the boundary condition of the drug preparations acceptance criteria [11].
Some published methods that described the relationship between accuracy, precision and acceptance specification range for validation method of analysis will be discussed in this present mini review.
Probability Approach
USP Medicines Compendium [12] published Equation (1), which can be performed with corresponding Excel function; it could calculate the probability of an assay value, to show whether it could fulfill a passing result to a defined pre-determined acceptance criteria [11].
Results=NORMDISK (Upper-Cert, Mean, SD, TRUE)-NORMDISK (Lower+Cert, Mean, SD, TRUE) (1)
Where Upper is the upper specification range (e.g. 105%), Cert is measurement uncertainty of the reference standard used (unless CRM or SRM used), mean is mean of recovery values (accuracy), SD is precision value, TRUE is logical operator, and Lower is lower specification range (e.g. 95%).
PPAC (Procedure Performance Acceptance Criteria) using the equation (1) is not less than 0.95. If the evaluation of accuracy and precision were performed on three concentration levels and performed on the three different days, the value of SD should be SD of intermediate precision (SR) of three different days.
Process/Method Capability (Cp, Cpk)
Method capability of an analytical method can be expressed by calculated values of CP and Cpk; this will show how good the relationship between accuracy, precision of the results of analysis to the upper limit and lower limit of the specification range. Cp and Cpk could be calculated using Equations 2 and 3 [13].
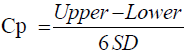 (2)
(2)
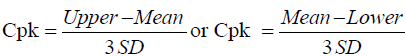 (3)
(3)
PPAC of Cp and Cpk should be >1; if Cp/Cpk is 1, it means 99.73% of the results of analysis would be within the pre-determined upper and lower specification range; The PPAC propose method is excellence, if the value of both Cp/Cpk >1.33 or higher.
Tolerance Interval (Ti)
Ermer in his recent excellent book of validation [11] described, that the distribution of expected data of a series of analysis can be statistically describe as tolerance or prediction interval around the observed mean. The tolerance interval (Ti) can be calculated using Equation (4).
Ti = kf x SD (4)
Where kf is specific tolerance factor in which the tolerance interval can be defined to contain a define fraction (e.g. 90%) of future results with a defined confidence (e.g. 95%), using tabulated tolerance factor for the number of determination (n) used to obtain the SD (http://www.math.wsu.edu/math/faculty/lih/tolerance.pdf). Applying equation (4), the results of an analysis than should be reported as follows:
Results (R) = Mean ± Ti (5)
Results of equation (5) can be calculated directly also using http://statpages.org/tolintvl.html. R of accuracy/precision evaluations of a propose method must be included in the pre-determined upper and lower specification range.
Accuracy Profile
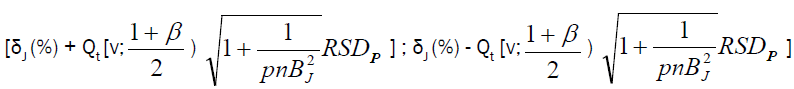
Accuracy profile approach is based on β-expectation tolerance interval (β-ETI), that will determine the upper and lower tolerance interval limits of analysis; calculated β-ETI values of analysis should lie between the pre-determined upper and lower specification range (± λ). Rozet et al. [14] and Hubert et al. [15] described equation for calculating β-ETI as follows:
 (6)
(6)
Where δJ (%) is the bias in concentration level J  , and RSDIP is the RSD of the intermediate precision; T=true value; p=series of measurement, n=replication
Intermediate precision SR2=Sr2+SB2; Sr2=within-condition variance, SB2=between-condition variance Qt (v; (1+β)/2)=β (the quantile of the Student t distribution with v degrees of freedom) and:
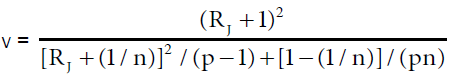
Table 1 showed data of our unpublished validation method using validation sample (VS) preparations (with 3 levels of concentration that determined in three different days); the pre-defined limit specification range for the drug preparation was set 95 to 105% of the expected concentrations (λ=± 5%).
| Sample VS 1 (T=80%) | Sample VS 1 (T=100%) | Sample VS 1 (T=120%) | |||||||
|---|---|---|---|---|---|---|---|---|---|
| n | Day 1 | Day 2 | Day 3 | Day 1 | Day 2 | Day 3 | Day 1 | Day 2 | Day 3 |
| 1 | 84.12 | 83.63 | 82.12 | 103.27 | 101.48 | 102.71 | 122.12 | 122.54 | 122.3 |
| 2 | 83.0 | 82.12 | 81.23 | 103.47 | 101.69 | 102.91 | 122.34 | 122.32 | 123.32 |
| 3 | 82.64 | 81.10 | 81.23 | 102.37 | 100.54 | 101.81 | 121.12 | 122.65 | 122.23 |
| 4 | 83.21 | 80.25 | 83.55 | 103.74 | 101.97 | 103.17 | 122.31 | 120.90 | 120.98 |
| 5 | 82.67 | 81.45 | 83.32 | 101.12 | 102.32 | 101.20 | 123.82 | 122.31 | 123.55 |
| 6 | 81.45 | 80.12 | 82.211 | 103.10 | 104.10 | 102.30 | 121.21 | 123.20 | 121.05 |
Table 1: Recovery data (%) of validation samples (VS):
Table 2 showed calculated values of % Bias (δ) were <5%); RSD of repeatability (Sr) and intermediate precision (SR) were <2%, so by applying traditional validation method, this proposed method seemed valid for its parameter of accuracy and precision. But unfortunately calculation of other data such as Cp/CPk, Ti, Β-ETI, probability approach, showed that the proposed method did not yielded acceptable criteria (see data printed in bold); only VS3 (120%) showed acceptable results for all data. It seemed, if data of Cp/CPK were not acceptable, data of Β-ETI and Ti will be yielded the same results (not acceptable).
| Parameter | VS1 (T=80%)i | VS2 (T=100%)j | VS3(T=120%)i |
|---|---|---|---|
| Srb | 1.31 | 0.96 | 0.91 |
| SBc | 0.69 | 0.01 | 0.0 |
| SRd | 1.48 | 0.97 | 0.91 |
| δe | 2.73 | 2.40 | 1.86 |
| Β-ETI (%)f | 6.15; -0.69 | 4.50;0.31 | 3.56;0.17 |
| Cp/Cpk | 1.09/0.50 | 1.69/0.87 | 2.09/1.31 |
| Tig (%) | 78.76-85.60 | 99.62-105.17 | 119.6-124.92 |
| Probabilityh | 0.93 | 0.99 | 0.99 |
| Specification rangej | 76-84% | 95-105% | 114-126% |
aCalculated using self-developed software VMA solution [17], bRSD (%) of within-condition precision (repeatability); cRSD (%) of between condition precision; dRSD (%)of intermediate precision; eBias in mean-true value/true value X 100% × 100 %), f% β-expectation tolerance interval (must be <|λ|; p=95%) [14,15]; g % Tolerance Interval; lower limit-upper limit for (p=95%; fraction=95%); hProbability approach
according to USP Compendium 2013 [12]; j λ was set ± 5% from expected concentrations (80, 100 and 120 %)
Table 2: Dataa of Β-ETI, Cp/Cpk, Ti, Probability-approach of Table 1 (λ=±5%).
Equations of Probability approach (Equation 1) and CP/CPk (Equations 2 and 3) showed that the SD data were obtained from the results of replicate measurements (n) of the analysis, but tolerance interval (Equation 5) and accuracy profile approaches (Equation 6) do use mathematical equations to predict the future results of the analysis. That is why the author recommends the application of Ti and Β-ETI approaches for doing validation method; Equations 5 and 6 can predict the concentration of APIs in whole batches of drug preparations. Reporting results of an analysis in a QC laboratory should be reported as Mean ± Ti, instead of Mean ± SD/RSD. It seemed that the newer USP chapter <1210> will be applied soon these approaches: combined validation of accuracy and precision [15,16].