International Journal of Innovative Research in Science, Engineering and Technology
ISSN ONLINE(2319-8753)PRINT(2347-6710)
ISSN ONLINE(2319-8753)PRINT(2347-6710)
P. R. Chaudhari1, D. V. Ahire2
|
| Related article at Pubmed, Scholar Google |
Visit for more related articles at International Journal of Innovative Research in Science, Engineering and Technology
The objective of this paper was to study the variability of the dielectric constant of dry soils with their physical parameters viz sand, silt, clay contents, bulk density and wilting point. Twenty nine soil samples were collected from different locations of four states Uttarakhand, Madhya Pradesh, Karnataka and Tamilnadu of India at the depth of 0 – 15 cm. Soil samples were analyzed for physical properties. The dielectric constant of dry soil samples was measured at C- band microwave frequency 4.5 GHz and its variation with physical parameters of soil samples were presented. The results were analyzed statistically, which showed that the dielectric constant has significant positive correlation with sand and bulk density of soil while significant negative correlation with silt, clay, wilting point and porosity of soil. Similarly higher order polynomial correlation of bulk density with texture of soil was observed
Keywords |
| Dry soil, dielectric constant, microwave frequency, physical parameters. |
I. INTRODUCTION |
| The properties of dry soil along with its type have a great importance in agriculture. The soil has physical, chemical as well as electrical properties. Colour, texture, grain etc. comprise the physical properties; Nutrients, organic matter, pH etc. comprise chemical properties while the electrical properties include dielectric constant, electrical conductivity and permeability. For microwave remote sensing dielectric constant is the primary important electrical property for dry soil. However due to dependence of dielectric constant on the physical constituents and chemical composition of the soil, the study of its variability with physical constituents and chemical composition is required. Soil is an intimate mixture of organic and inorganic materials, water and air. The relative amount of air and water present depends on way the soil particles are packed together. Soil texture is characterized by percentage of sand, silt and clay in it. |
II. LITERATURE REVIEW |
| Depending upon the percentage of each constituent, the soil texture is differently named. The measurement of dielectric constant of soil as a function of moisture content has been carried out over wide frequency range in the past several years using soils of widely different texture structures by Wang and Schmugge [1]. Calla et al [2] have studied the dielectric properties of dry and wet soil at microwave frequencies and reported that the dielectric constant of soil is strongly dependent on moisture content. Srivastava and Mishra[3] have studied the characteristics of soils of Chhaisgarh at X – band frequency and reported that dielectric constant of soils are strongly dependent on soil moisture and texture. Gadani and Vyas[4] have also reported the variation of dielectric constant with the sand content in the dry soil. Namdar-Khojasteh et al [5] have evaluated the dielectric constant by clay mineral and soil physico – chemical properties and showed that texture and mineral content of soil had different impact on dielectric constant. Calla et al [6] have showed that the variations of dielectric constant for different soils depend on the physical composition of soil. They reported decrease in dielectric constant with increasing of sand percentages, whereas it increases with the increase in silt and clay. Sengwa and Soni [7] have studied the variation of dielectric constant with density of dry minerals of soil at 10.1 GHz. |
| The present work provides the information about dielectric constant of Indian dry soils at C- band microwave frequency 4.5 GHz and its relationship with the physical parameters of 29 soil samples collected from different locations of four states of India. |
III. MATERIALS AND METHODS |
| Study Area: Haridwar district is located in south – western part of Uttarakhand State. It lies from 290 35' to 300 40' North latitude and 770 43 ' to 780 22' East longitude. The topography of Haridwar is characterized by sandy soils which do not retain water for long time. Due to unavailability of moisture in the soil the crop productivity is not very good in the region. Also, due to variation in altitude the rainfall also differs from place to place affecting the crop production. Coimbatore is located at an elevation of about 411 meters in Tamilnadu. It lies between 10° 10' and 11° 30' of the northern latitude and 76° 40' and 77° 30' of eastern longitude. The soil types of a particular area play critical role is determining the fertility status and cropping pattern. Red Calcareous soil, Black soil and Red non-calcareous soil are major soil types found in Coimbatore district. |
| Bangalore is situated in the southeast of the South Indian state of Karnataka. It is positioned at 12.97° N 77.56° E and covers an area of 2,190 square kilometers. Due to its elevation, Bangalore enjoys a pleasant and equable climate throughout the year. Winter temperatures rarely drop below 11°C and summer temperatures seldom exceed 36°C. Bangalore receives about 970 mm of rain annually, the wettest months being August September, October and in that order. The summer heat is moderated by fairly frequent thunderstorms and occasional squalls causing power outages and local flooding. |
| Bangalore is situated in the southeast of the South Indian state of Karnataka. It is positioned at 12.97° N 77.56° E and covers an area of 2,190 square kilometers. Due to its elevation, Bangalore enjoys a pleasant and equable climate throughout the year. Winter temperatures rarely drop below 11°C and summer temperatures seldom exceed 36°C. Bangalore receives about 970 mm of rain annually, the wettest months being August September, October and in that order. The summer heat is moderated by fairly frequent thunderstorms and occasional squalls causing power outages and local flooding. |
| Soil Sampling: The aim of this study was to determine the dielectric constant of dry soil samples and its variation with the physical properties of soil of four states Uttarakhand, Madhya Pradesh, Karnataka and Tamilnadu of India. Before sampling 15 mm topsoil was removed. Soil samples were collected from 29 different locations at the depth of 15cm. in zigzag pattern across the required areas. Five pits were dug for each sample. A composite sample of about 2 Kg. was taken through mixing of represented soil sample. These soils were first sieved by gyrator sieve shaker with approximately 2 mm spacing to remove the coarser particles. The sieved out finer particles are then oven dried to a temperature around 110oC for several hours in order to completely remove any trace of moisture. Such dry sample is then called as oven dry or dry base sample when compared with wet samples. |
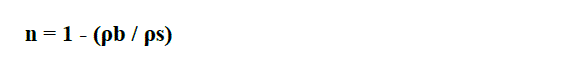
| Soil Properties: The samples were analysed for their physical parameters and also for pH and CaCO3 by standard analytical methods from Govt. College of Agriculture, Dhule. Bulk density is a measurement of the volume of soil composed of solid particles versus air space. Factors affecting bulk density are Pore space, Texture and Organic matter content. It is expressed as |
| n = 1 - (ρb / ρs) |
| Where n = porosity; ρb = bulk density and ρs = particle density The Wilting Point (WP) of the soils is calculated by using the Wang and Schmugge model [1] as follows: |
| WP = 0.06774 - 0.00064 X Sand (%) + 0.00478 X Clay (%) |
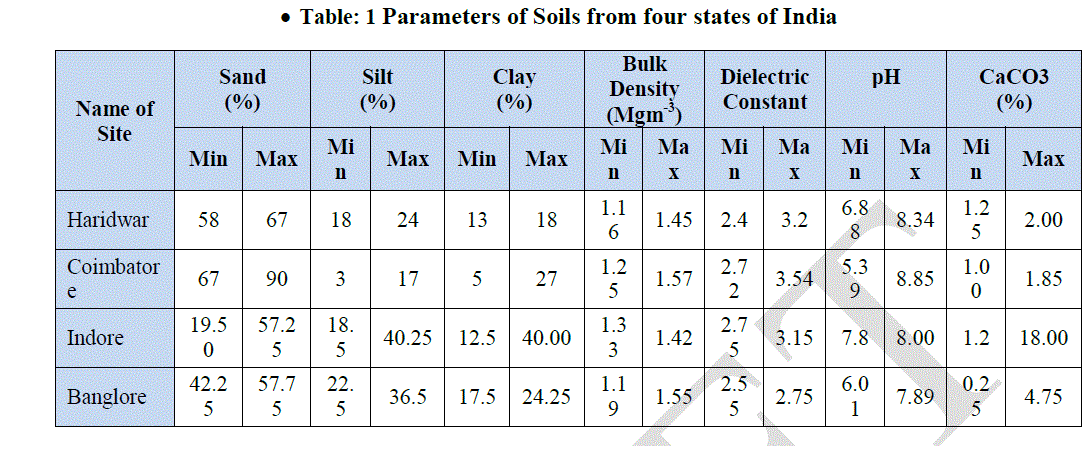
| The minimum and maximum values of sand, silt and clay content, bulk density along with dielectric constant, pH and CaCO3 of collected samples are listed in Table1. It is observed that most of the soil samples collected from Uttarakhand are sandy loam, moderately alkaline and slightly calcareous; samples from Tamilnadu are loamy sand and sand, moderately alkaline and acidic, calcareous and moderately calcareous; samples from Madhya Pradesh are loam and sandy loam, moderately alkaline and calcareous and samples from Karnataka are loam and sandy loam, moderately alkaline and slightly calcareous. |
 3 3 |
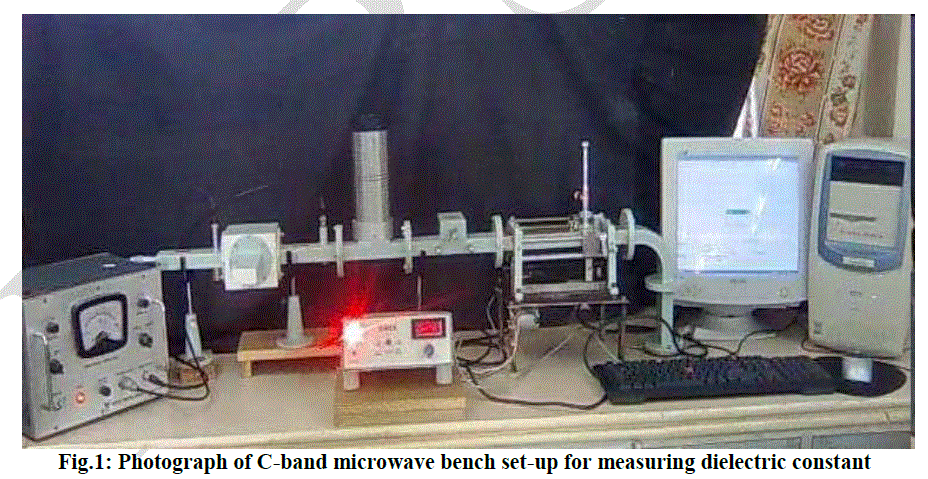
| Measurement of Dielectric Constant of dry Soil Samples: The waveguide cell method is used to determine the dielectric properties of the dry soil samples. C-band microwave bench set-up for measurement of dielectric constant of soil samples is shown in Fig.1. An automated C-band microwave set-up in the TE10 mode with Gunn source operating at frequency 4.5 GHz, PC-based slotted line control and data acquisition system is used for this purpose. The solid dielectric cell with soil sample is connected to the opposite end of the source. The signal generated from the microwave source is allowed to incident on the soil sample. The sample reflects part of the incident signal from its front surface. The reflected wave combined with incident wave to give a standing wave pattern. These standing wave patterns are then used in determining the values of shift in minima resulted due to before and after inserting the sample. Experiments were performed at room temperatures ranged between 25o-35o C. |
 |
| The dielectric constant ε' of the soils is then determined from the following relation: |
 |
| g̉̉ = real part of the admittance |
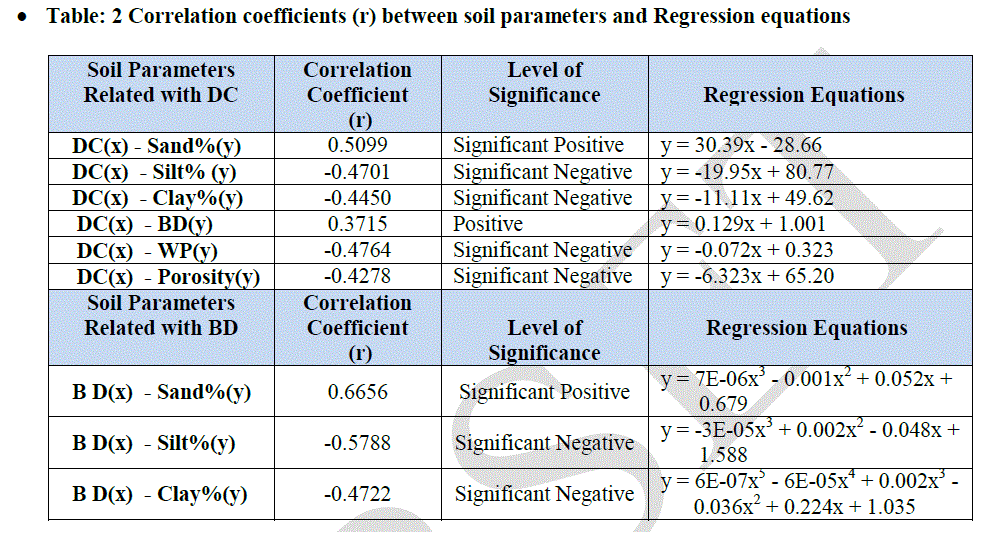
| Statistical analysis: The relationships of bulk density and dielectric constant with physical parameters of soils were determined using correlation coefficient “r”. Correlation coefficients (r) of bulk density and dielectric constant with physical parameters of soils along with respective regression equations are listed in Table 2. This table also gives an idea about the level of significance between various parameters. |
 |
IV. RESULTS AND DISCUSSION |
| The dielectric properties of a soil depend on a number of factors, including its bulk density, the texture of the soil particles (sand, silt, or clay), the density of the soil particles, the volumetric water content of the soil, the temperature, and the frequencies of interest [8,9,10]. Depending on the nature and type of soils from different states of India their dielectric constant have different correlations with their physical parameters. But our aim was to observe general relationship between dielectric constant and physical parameters of Indian soils. |
| (a). Relationship of Dielectric Constant with sand, silt and clay content of soil |
| Soil texture can be expressed significantly by its electrical conductivity and dielectric constant. Clay textured soil is highly conductive while sandy soils are poor conductors; reported by Marx et al [11]. Kumar M. and Babel A.L.[12] reported that the availability of micronutrients increased significantly with the increase in finer fractions (silt and clay). Simple correlation studies showed high degree of relationship between dielectric constant of soil with its physical constituents viz sand, silt and clay. Significant negative correlation of dielectric constant of soil with silt (r =-0.5788) and clay (r =-0.4722) content respectively was observed. While significant positive relationship was found between dielectric constant of soil and sand content (r = 0.6656). |
| (b). Relationship of Dielectric Constant with Bulk Density and Wilting point of soil |
| Since there is direct correlation between texture and bulk density of soil, dielectric constant of soil also depends on its bulk density and porosity. Dielectric constant of soils has positive correlation (r =0.3715) with its bulk density and negative correlation (r =-0.4278) with porosity. On the other hand dielectric constant has negative significant correlation (r = -0.4764) with its wilting point. |
| (c). Relationship of Dielectric Constant with pH, Organic Carbon and CaCO3 content of soil No significant correlation was observed between Dielectric constant and pH of Indian soils. Dielectric constant was found to be negatively correlated with organic carbon content (r = - 0.358) of soil samples but not so significant. Positive significant correlation between dielectric constant and CaCO3 content (r = 0.5745) of soil samples was observed. |
V. CONCLUSION |
| 1. The dielectric constant of Indian soils is dependent on the texture of soil i.e. the percent content of sand, slit and clay. Significant positive correlation of dielectric constant with sand content of soil and negative correlation with clay and silt content of soil was observed. |
| 2. The dielectric constant of Indian soils is dependent on the bulk density of soil and hence on porosity and wilting point of soil. Dielectric constant has positive correlation with bulk density of Indian soils and negative correlation with their porosity and wilting point. |
| 3. Dielectric constant of Indian soils was observed to be dependent on calcareous nature of soil and organic content while it was independent on pH of soils. |
| Laboratory studies of dielectric properties of soils with varied texture, bulk density, as well as other physical properties of soils are very important in correlating remotely sensed data with actual field conditions and in distinguishing targets having identical dielectric properties. |
ACKNOWLEDGEMENT |
| The authors are very much grateful to UGC, New Delhi and Principal, Z. B. Patil College, Dhule for providing a facility of microwave equipments to our Research Laboratory through CPE scheme. |
References |
|