ISSN ONLINE(2319-8753)PRINT(2347-6710)
ISSN ONLINE(2319-8753)PRINT(2347-6710)
P. Suresh1, K. Venkataramaniah2, T. Thayaparan3
|
| Related article at Pubmed, Scholar Google |
Visit for more related articles at International Journal of Innovative Research in Science, Engineering and Technology
Micro-Doppler signatures provide unique information about properties of the target. These micro-Doppler features can be used for real time target recognition in military applications and surveillance operations. In this paper, we present Gabor-Wigner transform for extracting micro- Doppler features from the radar returns. The effectiveness of the Gabor-Wigner transform in extracting micro-Doppler features has been compared with short-time Fourier transform, Wigner Distribution and S-method. The efficiency of the Gabor-Wigner transform in micro-Doppler feature extraction is demonstrated by applying it to different experimental data sets.
Keywords |
| Time-Frequency analysis, micro- Doppler effect, Short-Time Fourier Transform, Wigner Distribution, S-method, Gabor-Wigner Transform |
INTRODUCTION |
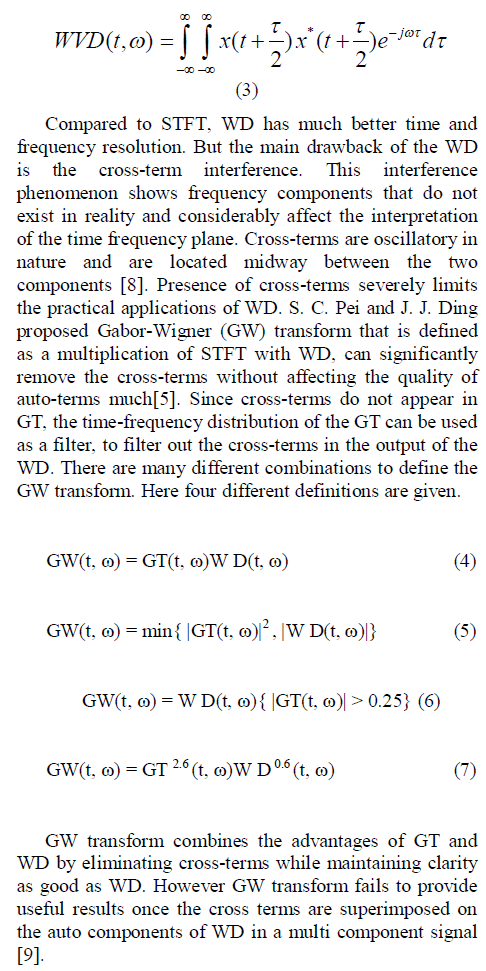
| In many cases, a target or structure on a target may have rotations or vibrations. These micro-motions of the target may induce frequency modulation on the radar returned signal. This may lead to generation of side bands about the center of the Doppler shifted carrier frequency. The frequency modulation due to target’s rotating or vibrating motion is called micro-Doppler (m-D) effect. [1]. Joint time-frequency methods can be used to extract m-D features [2]-[14]. The short-time Fourier transform (STFT) is the most widely used time-frequency representation. In STFT, the time and frequency resolution depends on the size of the window function used in calculating STFT. In order to improve timefrequency concentration, various quadratic timefrequency methods have been proposed. Wigner distribution (WD) is a well-known time-frequency method among the quadratic time-frequency methods, however it suffers from cross-term interferences. Stankovic et.al proposed S-method for improved distribution concentration in the time-frequency plane. Smethod (SM) has a property that, under certain assumptions, its value for multicomponent signals is nearly equal to the sum of the Wigner distributions of individual signal components [3]. The S-method is also numerically very simple and requires just a few more operations than the standard FT-based algorithm [4]. In 2007, S.C Pei et.al proposed Gabor-Wigner transform for the suppression of cross-terms in the output of WD function [5]. In this paper, we use Gabor-Wigner transform for the extraction of m-D features. |
II. GABOR-WIGNER TRANSFORM |
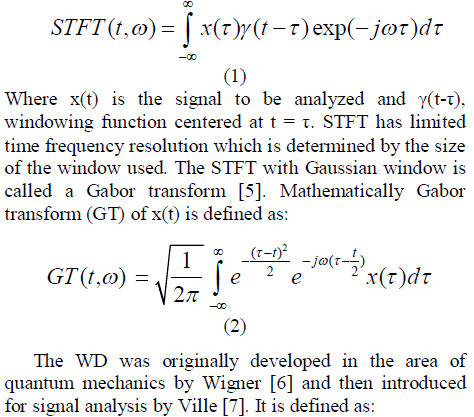
| STFT is the simplest time-frequency representation introduced for time localization of the frequency contents of a signal by using a suitable window. Basic principle behind STFT is segmenting the signal into narrow time intervals using a window function and taking Fourier transform of each segment. |
 |
 |
III. RESULTS |
| In this section, we demonstrate the application and effectiveness of GW transform as m-D feature extraction technique with two different types of experimental radar data obtained in different scenarios. |
A. Rotating antenna in SAR |
| We extract the m-D features relating to a rotating antenna in a SAR target scenario. The m-D for such rotating target may be seen as a sinusoidal phase |
| modulation of the SAR azimuth phase history. The phase modulation may equivalently be seen as a time-varying Doppler frequency[10]. The Doppler smearing due to the rotating parts is often well localized in a finite number of range cells. It is reasonable to process the Doppler signal for each range cell independently. Since the ground truth of the target is already known, the data at the range cell 123 was analyzed using the GW transform. Figure 1a illustrates the time-frequency signature using STFT and Figure 1b illustrates the timefrequency signature using WD at range cell 123. Figure 1c illustrates the time-frequency signature using the Smethod for L=4. Even though S method gives better resolution compared to STFT but still suffered from cross terms between close scatterers. Figure 1d shows that result from the proposed GW transform. Clearly it produces concentrated time-frequency signatures compare to STFT and WD. Using the time-frequency plot, the rotation rate of the antenna is estimated by measuring the time interval between peaks. The period is the time interval between peaks. As an example, in Figure 1d, there are 3 peaks. The time interval between peak 1 and peak 2, between peak 2 and peak 3, and between peak 1 and peak 3 are measured. The average value is then used to estimate the rotation rate. The estimated rotation rate is 4.8 seconds, which is very close to the actual value of 4.7 seconds. |
| B. Corner reflectors |
| High range resolution (HRR) profiles were collected using a stepped frequency waveform (SFWF) radar mode at X- band between 9.0 to 9.4 GHz, i.e., a synthetic bandwidth of 400 MHz; the frequency step size was 1 MHz The test target was made up of four corner reflectors, three of which are stationary to provide a geometric reference and a contrast to the shape of the oscillating reflector in the HRR profiles. Out of three stationary reflectors, two were placed closer to each other than the third stationary reflector. The test target was located at 2km from the radar system. HRR scans were performed at 2kHz PRF. This data set is used to extract the m-D features using different time-frequency analysis. Figure 2a illustrates the time-frequency signature of the signal which is obtained using STFT. As expected timefrequency representation of STFT is cross term free but its time and frequency resolution is not good. Figures 2b and 2c illustrate the time frequency signatures of the same signal using WD and S-method time frequency representations respectively. Even though WD gives best resolution, it is corrupted with cross terms. On the other hand S method with L value 2 gives better time frequency resolution than STFT. But still there are some cross terms between the two stationary reflectors which are close to each other. Figure 2d shows GW transform time-frequency representation of the signal. It can be seen that cross terms are removed between two close stationary reflectors. Results demonstrate that the GW transform is an effective tool to extract m-D features |
IV. PERFORMANCE ANALYSIS |
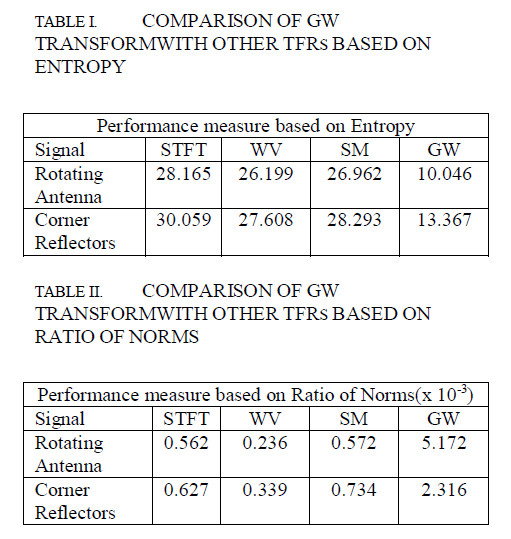
| The performance of the time-frequency representations (TFRs) can be compared based on their readability, resolution, cross-terms suppression and energy concentration. Cross-terms suppression and energy concentration of a time-frequency representation is evaluated by visual inspection or on the basis of quantitative measures like entropy measures and ratio of norms [15]. |
| Renyi entropy [16] of time-frequency representation, φ (t, ω) is defined as: |
 |
| where α is the order of entropy. In the case of TFRs, low entropy stands for high concentration of auto-terms, where as high entropy means lower energy concentration of auto-terms. Ratio of norms (RN) is calculated by dividing fourth power norm of a TFR, φ (t, ω) by its second power norm [17]. Mathematically |
 |
| Higher value of RN implies that signal autocomponents are highly concentrated [17]. From table I and II, it is evident that GW transform has minimum value of entropy and maximum value for RN. Therefore the proposed GW transform shows good energy concentration property compared to other TFRs. |
 |
 |
 |
V. CONCLUSION |
| This paper presents Gabor-Wigner transform approach for the extraction of micro-Doppler features of radar returned signals from targets. The method combines the advantages of short-time Fourier transform and Wigner Distribution in order to extract the m-D features of radar target returns. By applying the proposed Gabor-Wigner transform to experimental data, the effectiveness of this analysis technique is confirmed. From the extracted m-D signatures, information about the target’s micro-motion dynamics, such as rotation rate and period of oscillation, can be obtained. |
VI. ACKNOWLEDGEMENTS |
| This work is supported by the Defense Research & Development organization, Govt. of India, Ministry of Defense through the project ERIP/ER/ 1104582/ M01/1369. |
References |
|